Ichimoku Screener [Pineify]Advanced Multi-Timeframe Ichimoku Screener - Complete Market Analysis Tool
This sophisticated Ichimoku Screener represents a comprehensive approach to multi-timeframe market analysis, combining four distinct Ichimoku-based indicators into a unified screening system. Unlike traditional single-symbol indicators, this screener provides simultaneous analysis across multiple assets and timeframes, enabling traders to identify optimal trading opportunities with enhanced precision and efficiency.
Key Features
Multi-asset screening capability for up to 10 symbols simultaneously
Four customizable timeframes per symbol for comprehensive analysis
Four integrated Ichimoku-based indicators working in harmony
Real-time visual feedback with color-coded signals
Customizable Ichimoku parameters for personalized analysis
Clean, organized table display for easy interpretation
Automated signal strength assessment and timing
How It Works
The screener employs the traditional Ichimoku Kinko Hyo methodology, utilizing five core components: Conversion Line (Tenkan-sen), Base Line (Kijun-sen), Leading Span A (Senkou Span A), Leading Span B (Senkou Span B), and displacement calculations. Each component is mathematically calculated using specific period lengths:
Conversion Line = (Highest High + Lowest Low) / 2 over conversion period
Base Line = (Highest High + Lowest Low) / 2 over base period
Leading Span A = (Conversion Line + Base Line) / 2
Leading Span B = (Highest High + Lowest Low) / 2 over lagging span period
The screener processes these calculations across multiple securities simultaneously using TradingView's security() function, enabling real-time cross-asset analysis. The system tracks state changes using barssince() functions to provide precise timing information for each signal type.
Trading Ideas and Insights
This screener excels in identifying momentum convergence patterns where multiple Ichimoku components align across different timeframes. The most powerful signals occur when:
Cloud color aligns with price position relative to the cloud
Conversion Line crosses above/below Base Line in the same direction as cloud bias
Multiple timeframes show consistent directional bias
Entry signals appear with minimal bars since formation (indicating fresh momentum)
For trend following strategies , focus on symbols where the cloud maintains consistent color across higher timeframes while showing recent entry signals on lower timeframes. For reversal opportunities , identify assets where cloud color changes coincide with price re-entering the cloud after extended periods above or below.
The screener particularly excels in cryptocurrency and forex markets where momentum shifts can be dramatic and sustained. By monitoring multiple timeframes simultaneously, traders can identify when short-term signals align with longer-term trends, significantly improving trade success probability.
How Multiple Indicators Work Together
The four integrated indicators create a comprehensive analytical framework through synergistic interaction:
Ichimoku Cloud (IchiCld) establishes the primary trend bias by comparing Leading Span A with Leading Span B. When Span A > Span B, the cloud displays bullish characteristics; when Span A < Span B, bearish characteristics emerge. The indicator tracks duration since the last cloud color change, providing momentum persistence insight.
Ichimoku Lagging Cloud (IchiLagCld) determines price position relative to the displaced cloud formation. This indicator identifies whether current price action occurs above, below, or within the cloud structure, revealing support/resistance dynamics and trend confirmation signals.
Conversion vs Base (IchiC>Base) monitors the relationship between short-term (Conversion Line) and medium-term (Base Line) momentum. Crossovers in this relationship often precede significant price movements and provide early trend change warnings.
Ichimoku Entry (IchiEnt) synthesizes all components into actionable signals by requiring alignment between cloud bias, price position, and conversion/base relationship. This multi-factor confirmation approach significantly reduces false signals while maintaining sensitivity to genuine momentum shifts.
The mathematical foundation ensures that each indicator contributes unique information while maintaining logical consistency. The system's strength lies in requiring multiple confirmations before generating entry signals, following Ichimoku's original philosophy of comprehensive market analysis.
Unique Aspects
This implementation distinguishes itself through several innovative features:
Advanced State Tracking : Unlike standard Ichimoku indicators that show current values, this screener tracks duration since state changes , providing crucial timing information for signal freshness and momentum strength assessment.
Multi-Asset Efficiency : The screener eliminates the need to manually check multiple charts by presenting comparative analysis across assets and timeframes in a single view, dramatically improving analytical efficiency.
Customizable Visual Feedback : The color-coding system adapts to different signal types and strengths, with recent signals receiving enhanced visual prominence to draw attention to fresh opportunities.
Professional Table Architecture : The organized display accommodates up to 40 symbol-timeframe combinations (10 symbols × 4 timeframes), with intelligent pagination for optimal screen utilization.
Signal Correlation Analysis : By displaying multiple timeframes for each symbol, traders can quickly identify timeframe confluence and divergence patterns that would otherwise require extensive manual analysis.
How to Use
Symbol Configuration : Enter up to 10 symbols in the Symbol input group. Use full exchange:ticker format for optimal compatibility (e.g., "BINANCE:BTCUSDT").
Timeframe Selection : Configure four timeframes in ascending order for logical analysis progression. Recommended combinations include 1m/5m/15m/1h for intraday analysis or 1h/4h/1D/1W for swing trading.
Ichimoku Parameters : Adjust the four core parameters based on your trading style:
Conversion Line Length (default: 9) - Controls short-term momentum sensitivity
Base Line Length (default: 26) - Determines medium-term trend identification
Leading Span B Length (default: 52) - Sets long-term trend calculation period
Displacement (default: 26) - Controls forward projection of cloud structure
Signal Interpretation :
Green backgrounds indicate bullish conditions
Red backgrounds indicate bearish conditions
Numerical values show bars since last state change
"L:" prefix indicates long entry signals
"S:" prefix indicates short entry signals
"N/A" indicates neutral/transitional states
Trading Workflow : Scan for symbols showing consistent signals across multiple timeframes, prioritize fresh signals (low bar counts), and use individual charts for precise entry timing and risk management.
Customization
The screener accommodates various trading approaches through parameter adjustment:
Scalping Configuration : Use shorter periods (Conversion: 5, Base: 13, Span B: 26) with 1m/3m/5m/15m timeframes for high-frequency opportunities.
Swing Trading Setup : Employ standard parameters with 4h/1D/3D/1W timeframes for position trading across days or weeks.
Cryptocurrency Optimization : Given crypto's 24/7 nature, consider using 4h/8h/1D/3D combinations for optimal signal timing.
Symbol selection can focus on correlated assets (e.g., major cryptocurrencies) for sector analysis or diverse assets for portfolio opportunity identification. The flexible timeframe configuration allows adaptation to any market's characteristic volatility and trading patterns.
Conclusion
This Advanced Multi-Timeframe Ichimoku Screener transforms traditional single-chart analysis into a comprehensive market monitoring system. By integrating multiple Ichimoku components across various timeframes and assets, it provides traders with unprecedented analytical efficiency and signal reliability.
The mathematical rigor of traditional Ichimoku analysis combines with modern Pine Script capabilities to deliver a professional-grade screening tool. Whether used for identifying trend continuation opportunities, spotting potential reversals, or conducting broad market analysis, this screener offers the analytical depth and practical functionality required for serious trading applications.
The system's emphasis on signal confluence across multiple timeframes and indicators significantly improves trade selection quality while reducing analysis time. For traders seeking to leverage Ichimoku's proven methodology across multiple markets simultaneously, this screener represents an essential analytical upgrade to traditional single-symbol approaches.
Ichimoku_trader

Dynamic Support|Resistance SSA & SSBHello, traders. I offer you an indicator to complement the Ichimoku Kinho Hyo trading system. This indicator determines possible dynamic resistance and support levels based on pivots and end points of the Senkou Span A and Senkou Span B lines.
You determine the pivots yourself, choosing how many bars back to look for HIGH and LOW.
Attention! Unlike the classical theory of Goichi Hosoda: the levels are dynamic, that is, they change values with each new bar!
Also added is the MTF function for displaying levels from different time frames.
Goichi Hosoda TheoryGreetings to traders. I offer you an indicator for trading according to the Ichimoku Kinho Hyo trading system. This indicator determines possible time cycles of price reversal and expected asset price values based on the theory of waves and time cycles by Goichi Hosoda.
The indicator contains classic price levels N, V, E and NT, and is supplemented with intermediate levels V+E, V+N, N+NT and x2, x3, x4 for levels V and E, which are used in cases where the wave does not contain corrections and there is no possibility to update the impulse-corrective wave.
A function for counting bars from points A B and C has also been added.

Renko Ichimoku CloudThis script utilizes its source from a non-repainting renko closing price. Renko charts focus solely on price movement and minimize the impacts of time and the extra noise time creates. Employing the renko close helps smooth out the Ichimoku Cloud. Insignificant price movements will not cause a change in the plotted lines of the indicator unless a new threshold is breached or a "brick" is created.
This Ichmoku Cloud includes all standard lines with standard lengths. These include:
Tenken Sen
Kiju Sen
Senkou A/B
Chikou Span
We have also included plotted marks for when there is a Tenken Sen/ Kiju Sen cross and for the Kumo cloud twist.
There are two methods for selecting the box size. Box size is critical for the overall function and efficacy of the plots you will visually see with this indicator. Box size is set automatically using the Average True Range "ATR" or manually using the "Traditional" setting. The simplest way to determine a manual box six is to take the ATR of the given instrument and round it to the nearest decimal place. As an example, if the ATR for the asset is 0.017, you would round that number to 0.02 and utilize this as your traditional box size.
Ichimoku Cloud+quality lineIchimoku Cloud+quality line
this is ichimoku indicator, only quality line added.
Multi Timeframe Silent IchimokuMulti Timeframe Silent Ichimoku
Is an upgrade on my previous Silent Ichimoku indicator witch attempts to filter out the noise from the Ichimoku indicator By only coloring the bars
Green if the Ichimoku spots an uptrend
Red if Ichimoku spots a downtrend
And Gray if Ichimoku spots consolidation
This Indicator adds the ability to filter out some bad signals by taking the Ichimoku from the higher time frame into consideration and providing a visual back test
Huge shout out to fareidzulkifli for the Quick Backtest Framework Awesome tool to add to your framework

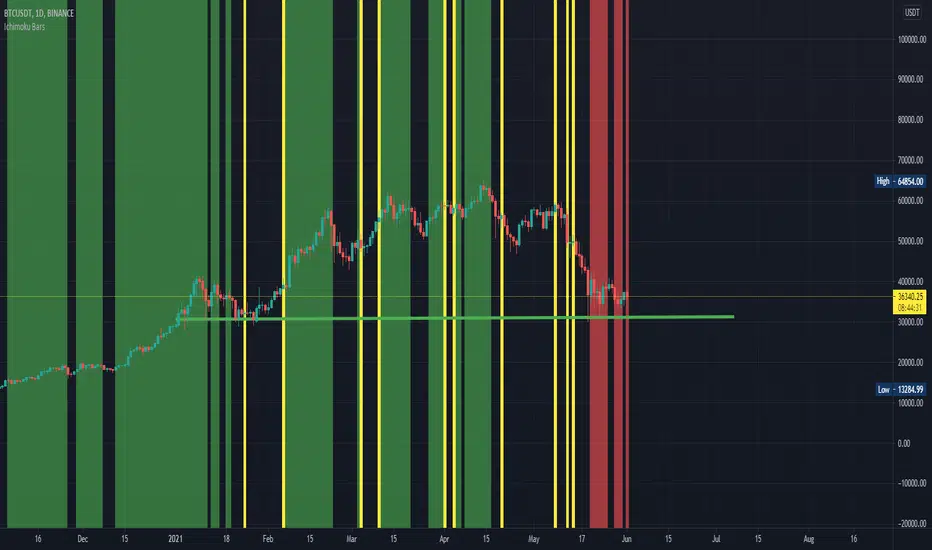
Ichimoku BarsThis script follows off the principles of the Ichimoku Cloud indicator. The green zones display optimal time to buy according to the Ichimoku model. The red zones show optimal time to sell according to the Ichimoku model inverse. The yellow zones show where the conversion line meets the base line (potential up or down movement at this point). Feel free to contact me to fix any problems or add additional info.
Ichimoku with Correct DisplacementThe default Ichimoku Cloud by TradingView is strange. The kumo is only displaced 25 periods forward, and the chikou is displaced 25 periods back. This is because TradingView had the correct value for displacement (26), but they decided to subtract this displacement by 1 when actually drawing the kumo and add 1 when drawing the chikou. This script fixes this and allows for easier customization of each line in the Ichimoku.

Ichimoku Clouds Strong Bullish/Bearish signals and alertsIchimoku Clouds Strong Bullish/Bearish signals with allerts
The Ichimoku cloud was developed by Goichi Hosoda, a Japanese journalist, and published in the late 1960s. It provides more data points than the standard candlestick chart. While it seems complicated at first glance, those familiar with how to read the charts often find it easy to understand with well-defined trading signals.
We provide you easy-to-use script which helps to decrypt meaning of lines in the indicator. The script takes Ichimoku clouds indicator formulas to calculate Tenkan, Kijun, SenkouA, SenkouB values and examines them in order to produce buy ( Bullish ) and sell ( Bearish ) signals which are displayed at the chart
The most appropriate time frame is 30m
Custom alerts are added to send you a notice with a webhook when bullish or bearish signal arrives.
You can easily add weak and neutral signals alerts by removing "//" in a specified place
Feel free to copy and use this script for your ideas and trading. You can modify the script by adding Parabolic SAR in order to increase accuracy of positions closure

Open Source Ichimoku Kinkō hyō Keizen 改善Open Source Ichimoku Kinkō hyō Keizen 改善
First of all, thank you for using my work, making changes and continuing to share it for free.
I chose as indicator name Ichimoku Kinkō hyō Keizen logically simply by
what the word Keizen reflects a Japanese method which means continuous improvement and quality.
The goal here is to correct already any offset faults that should not be present and to try
to bring the indicator of new things that can serve and advance
and provide additional support for the decision.
A continuation will surely be planned which will bring its batch of new elements which will come
naturally be grafted to this tool.
Possibility of adding or not adding new lines Jun (76), Kan (226), Junkan A, B (676).
- Junakan To be calculated on the average of Jun / Kan 151 periods.
- Junkan B calculate over the 676 periods.
- Possibility of adding or not adding a new kinkohoyo calculate on Jun (76) and Kan (226).
- Possibility of adding or not adding a new Kumo calculate over 676 periods.
- Possibility of coloring or not the kumos or the kinkohyos.
- Possibility of adding or not Chikō 9,26,52,76,226,676.
- Ability to display or not passive lines in the future, 5 shots ahead of the movement of lines, provided that the extremes are not broken.
Thank you:
Thanks to TomQSD to have tested all the different versions of this project and to have contributed his criticism that helped me a lot to develop the tool.
Thanks to Herveo for having agreed to share his code
on the passive lines.
Remarks:
Not all options are activated at the same time.
Please do not uncheck the boxes in style, only change the colors.
To enable or disable lines, go to input parameters.
//////////////////////////////////////////////////////////////////////////////////////////////////////////////////////////////////////////////////////////////////////////////////////////////////////////////////////////////////
Open Source Ichimoku Kinkō hyō Keizen 改善
Tous d'abord, merci d'utiliser mon travail, d'apporter des modification et de continuer à le partager gratuitement.
J'ai choisi comme nom d’indicateur Ichimoku Kinkō hyō Keizen en toute logique tout simplement par
ce que le mot Keizen reflète une méthode Japonaise qui veut dire amélioration en continue et qualité.
Le but ici est de corriger déjà tout les défauts de décalage qui ne devraient pas être présents et d’essayer
d’apporter sans trop charger l’indicateur des choses nouvelles qui peuvent servir et faire progresser
et apporter une aide supplémentaire à la décision.
Une suite sera sûrement prévue qui apportera son lot d'éléments nouveaux qui viendront
naturellement se greffer à cet outil.
- Possibilité d’ajout ou non de nouvelles lignes Jun (76) , Kan (226) , Junkan A,B (676).
- Junakan A calculer sur la moyenne de Jun/Kan 151 périodes.
- Junkan B calculer sur les 676 périodes.
- Possibilité d’ajout ou non d’un nouveau kinkohoyo calculer sur le Jun (76) et le Kan (226).
- Possibilité d’ajout ou non d’un nouveau Kumo calculer sur 676 périodes.
- Possibilité de colorier ou non le ou les kumos et le ou les kinkohyos.
- Possibilité d’ajout ou non de Chikō 9,26,52,76,226,676.
- Possibilité d’afficher ou non de lignes passives dans le future, 5 coups d’avance sur les déplacement des lignes, a condition que les extrêmes ne soient pas rompu.
Remerciement :
Merci à TomQSD d'avoir tester toutes les différentes versions de ce projet et d’avoir apporter sa critique qui m'a beaucoup aidé à développer l’outil.
Merci à Herveo pour sont accord d’avoir bien voulu partager son code
sur les lignes passives.
Remarques:
Toutes les options ne sont pas toutes à activer en même temps.
Merci de ne pas décocher les cases dans style, modifiez seulement les couleurs.
Pour activer ou désactiver des lignes, allez dans paramètres en entrée.

Kijun-sen Colored [aamonkey]I isolated the Kijun-sen from the Ichimoku Cloud and colored it.
You can do major damage by just entering when the price closes above the Kijun-sen and sell when it is the other way around.
Add some other confirmation indicators to filter some false breakouts and you are good to go.

