EMA SMA STRATEGY V1 2H// Strategy based on Simple Moving Average (SMA) and Exponential Moving Average (EMA)
// Greatest profit index on 2H time frame
// Created and based on Binance chart
// Working with comission
// No repaint
I-BTC

Relative Estimated Price KivanÇ version (Strategy) By Wicksell Thanks to the great work of KIVANÇ in the Relative Estimated Price REP by KIVANÇ fr3762, it has adapted modifications in the Lookback bar length, transformed into strategy, where a line determines a relative average price of XBTUSD, BTCUSD, ETHUSD and BCH.
the line is a calculation, where it involves reading previous candles where it determines what the current price should be.
When the REP line is above the candle, open buy and close sell, when it is below, open sell and close buy.
When setting which currency, do not forget to change the settings where they are:
1 - XBTUSD
2 - BTCUSD
3 - ETHUSD
4 - BCHBTC
may also be modified:
the Lookback bar length, stop loss settings, test date.
The best results are in the 1H time, with the default settings, but try to modify the data and if you find better results, I would be grateful if you post here.
pivot point strategy(lirshah)The pivot point levels are composed of a pivot point, two higher resistance levels known as R1 and R2, and two lower pivot point supports known as S1 and S2.
Each resistance level is considered a pivot point.
this strategy gives signals based on valid pivot points( reactionary price level) and it has a good results on the variety of pairs in different markets.

CS Basic Script: Customizable Volume Based Trading (Strategy)Customizable Volume Based Strategy Script that includes the Following Inputs:
- Custom Backtesting Date Range
- Optional Trailing Stop Loss
- Select the Volume Strategy Types (Crossing EMA, SMA, WMA, & Lookback)
- Adjust the MA Volume Range
- Automate with the Autoview Trading Bot
Strategy script may be tested by favoriting and adding to any chart.
Study script is available for automated trading at www.cryptoscores.org

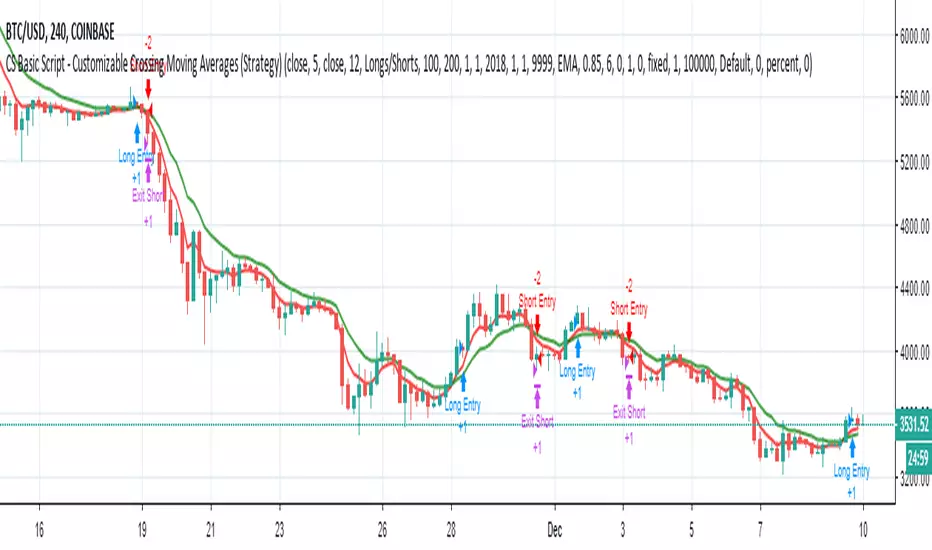
CS Basic Script - Customizable Crossing Moving AveragesThis Crossing MA Script features inputs for:
- Custom Date Range for Backtesting
- Optional Trailing Stop Loss
- Buy/Sell and Long/Short Selections
- Customizable MA Types and Ranges
- Includes EMA, SMA, WMA, ALMA, VMA, HMA, and LSMA Moving Average Types
- Ability to Enable Automated Trading with the Autoview Trading Bot Chrome Extension
For access to the Strategy Script for backtesting, simply favorite the script and add it to any TradingView chart.
For access to the Study Script for Custom Alerts and the Ability to Automize Trades through Autoview, please visit our website at www.cryptoscores.org .
Acceleration / deceleration strategy As promised, the updated acceleration / deceleration strategy.
Added switchable shorts (for exchanges with no margin) and more understandable settings.
The idea of the strategy is to look for the distance between the fast and slow SMA. When it decreases, there is a slowdown in price growth and a change in trend, and at the moment it predicts well the breakdowns of Bitcoin.
In the settings you can configure length of fast SMA, the length of the slow SMA is calculated as the length of the fast + diff. Usually, I pick up the fast SMA length, and then looking for the optimal diff. TrendChangeCandles indicates how many columns are needed in order to form a signal. 1 - the signal will be at each slow/acceleration event, we need to filter it, otherwise there will be a lot of unnecessary signals.
At the moment I have a bot that works on the default settings on the Bitmex exchange, and it gives good results. However, I think it is possible to find other settings for other pairs or timeframes (at least 15 minutes) that would give good results.

U&Dif price has moved up since 1 to 3 candles ago = buy
if price has moved down since 1 to 3 candles ago = sell
has internal SL & TP
tested on
BITFINEX:ETHUSD
BITFINEX:BTCUSD
BITFINEX:LTCUSD
BITFINEX:ETHBTC
4 hour charts

scMAD+ strategyPowerful trend follower. Works best on 1H timeframe.
Steady and constant profit.
To get this fully automated trading system, contact me here.

Working strategy for ANY market I'm really impressed with this strategy. It is extremely simple, uses only one indicator (accelerator decelerator oscillator) with the standard settings, and works in almost every market I tested it on.
Crypto-currencies - BTC, ETH, XRP - everywhere exceed buy & hodl. Works even in stock markets and FOREX markets (albeit not as efficiently). You really should try this, leave impressions in the comments.
I will improve this strategy with filters for increasing Percent Profitable rate, so stay tuned!

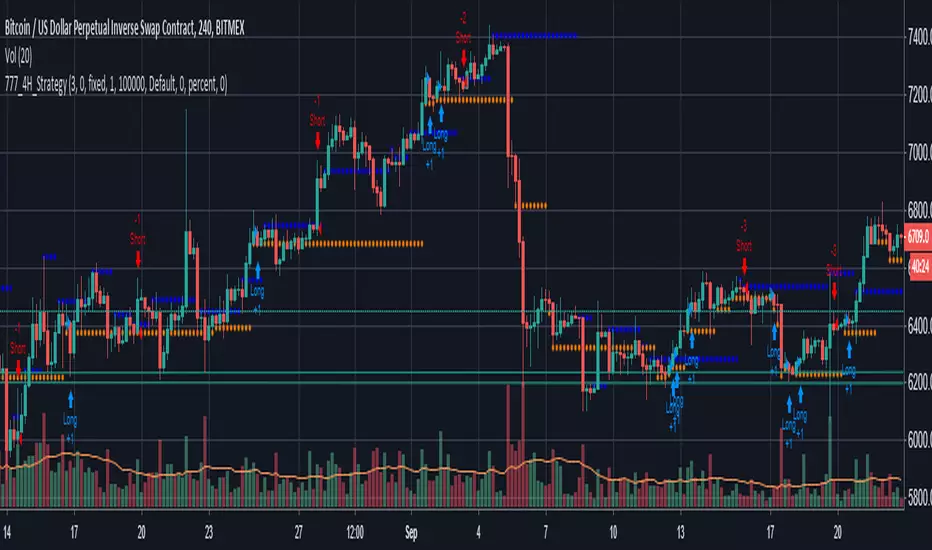
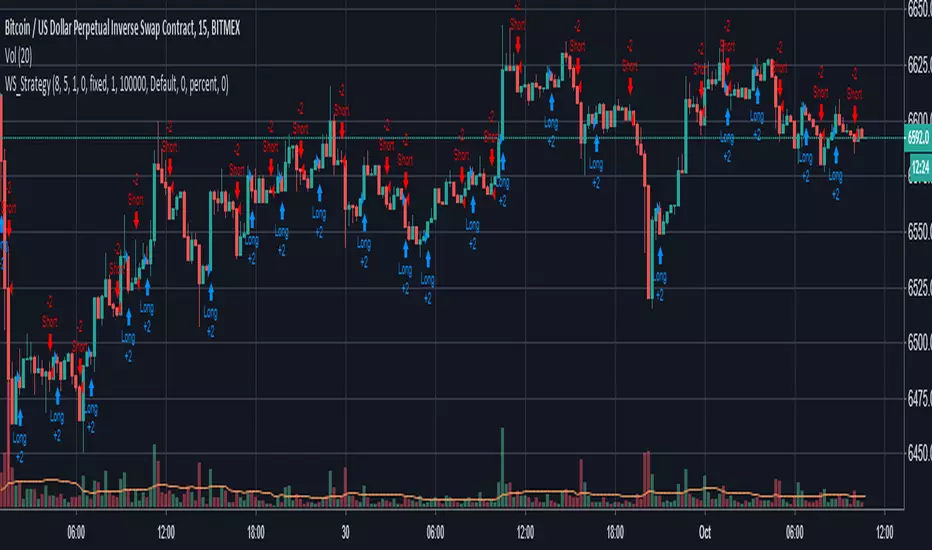
The Wild Storm Trading Strategy - Average of 6 Bars in TradesThis is my Wild Storm trading strategy. A wild storm set of positions taking place with a focus on small quick trades. The ideal strategy for a bot. The strategy is now set to work with the 15min timeframe.
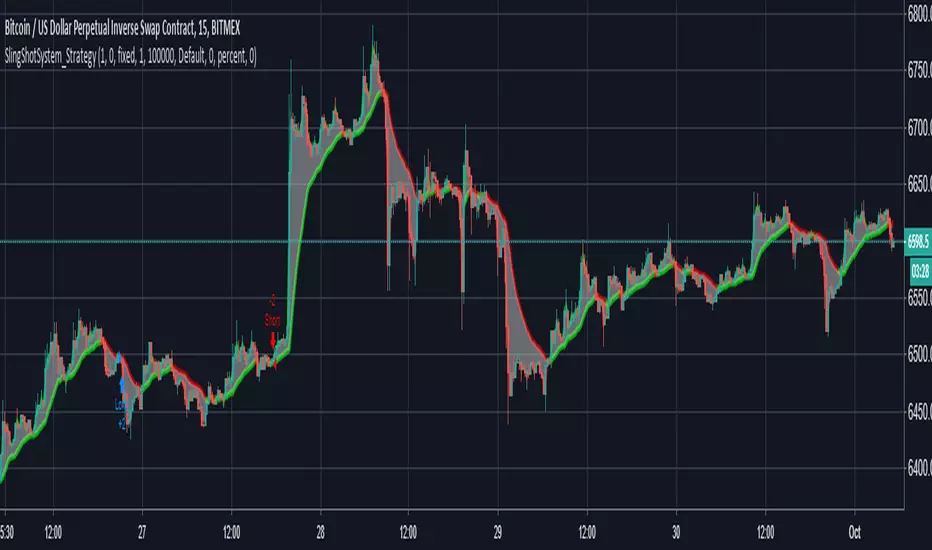
The 15 Minutes SlingShot System StrategyUse this strategy on the 15 Minutes timeframe for maximum profit. Even if the profitability is less than 60%, the profit factor is still above 5 for minimum losses which make it very profitable. The strategy is based on the SlingShot System Study.
The Ultimate TripleX Trading StrategyThe strategy is now set to wor with the 15 Minutes timeframe, but you can adjust it to work with any timeframe.

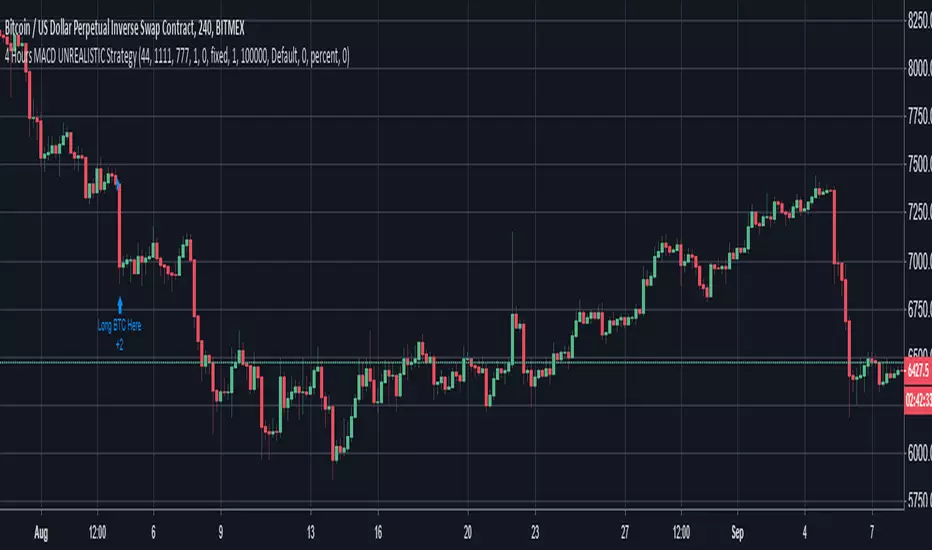

B LAODA bitcoin MACD aptimize Strategy B LAODA bitcoin MACD aptimize Strategy
1 MACD parameter optimization
2 while crossover macd 0 line buy
crossunder macd 0 line then sell
simple and effective,the bitcoin market ,suggest with 4H frame or more for reduce wing
stock market suggest with 1D frame

B LAODA TRENDThank for JayRogers
This is a strategy for bitcoin ,cryptocurrency , stock market
1 hardly any repaint ,suggest 2 hour frame for bitcoin or use hekin ashi K line with 90 minute frame, suggest 1 Day or more for stock exchange

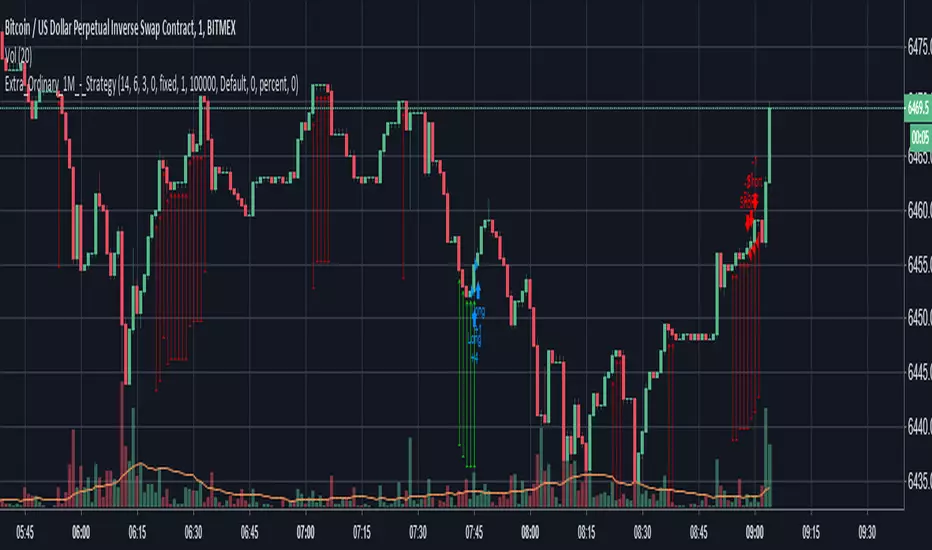
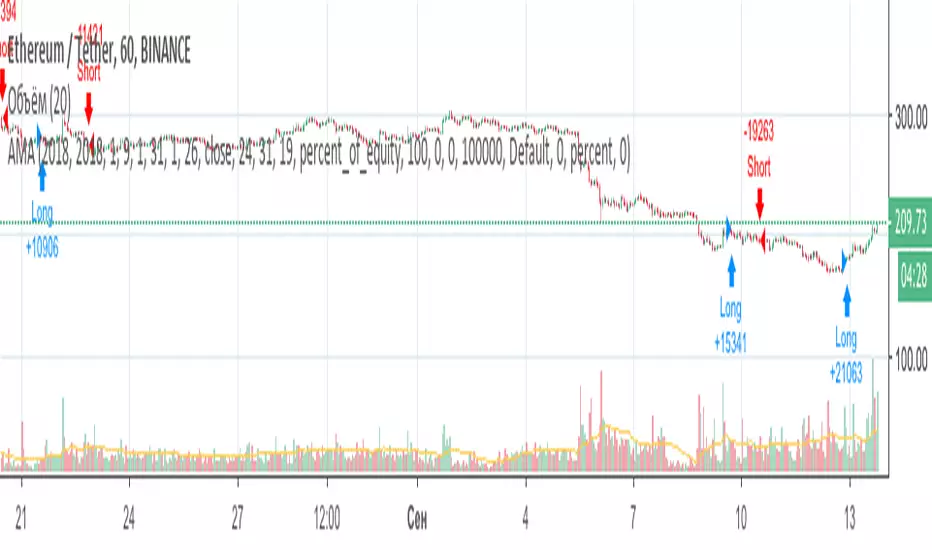
AMAAwesome oscillator plus MA make a greats result. Avg. position time is 48 hours. Only position reversal. Good trading on ETH and XBT Swap Bitmex. Also working with other params for CFD.
BTCUSDT 4H Entry Exit, 21% Gain BacktestBTCUSDT 4H Entry Exit, 21% Gain Backtest
Only tested on 4H chart.

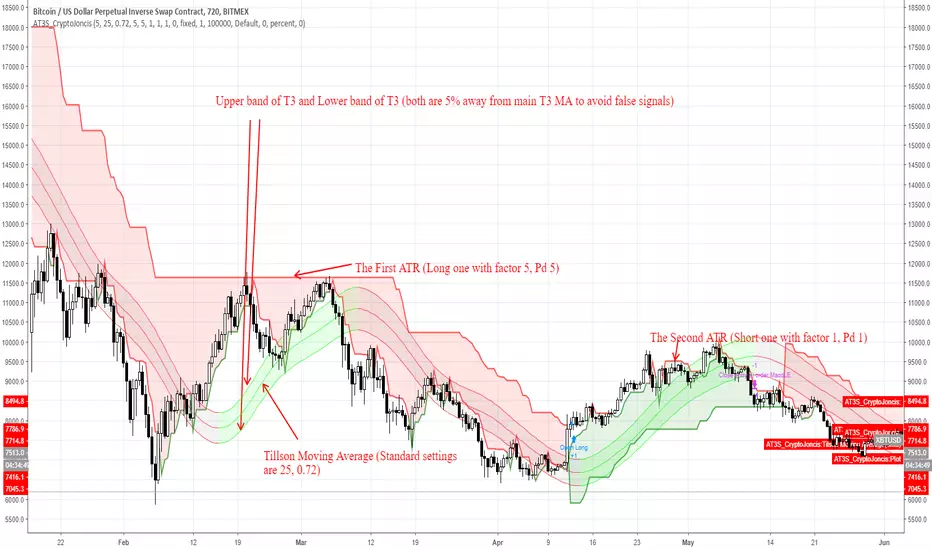
ATR and T3 strategyT3 Moving Average indicator was originally developed by Tim Tillson in 1998/99.
T3 Moving Average is considered as improved and better to traditional moving averages as it is smoother and performs better in trending market conditions.
It offers multiple opportunities when the price is in the state of retracement and therefore allows to minimize your exposed risk and allowing your profits run.
This strategy is for trend followers who are patient enough to have 6-10 trades per year.
What's included in strategy?
Two ATR (Code was taken from J.Dow and modified)
Tillson Moving average
Enter long signal:
When both ATR (Long and Short) are in uptrend and the bar closes above Upper Tillson's moving average band: Enter Long
Exit Long signal:
When hl2 is lower than Lower Tillson Moving Average band
Enter short signal:
When both ATR (Long and Short) are in downtrend and the bar closes below Lower Tillson's moving average band: Enter Short
Exit Shortsignal:
When hl2 is higher than Upper Tillson's Moving Average band
Best to use with Bitcoin on 12H TF
Can be used for different time frames as well but the settings must be adjusted accordingly
Remember, overtrading can be harmful to your trading account.
If this is helpful for you, consider a tip
BTC: 3FiBnveHo3YW6DSiPEmoCFCyCnsrWS3JBR
ETH: 0xac290B4A721f5ef75b0971F1102e01E1942A4578
Created by CryptoJoncis