Forex Visual Market ClockWhat it is
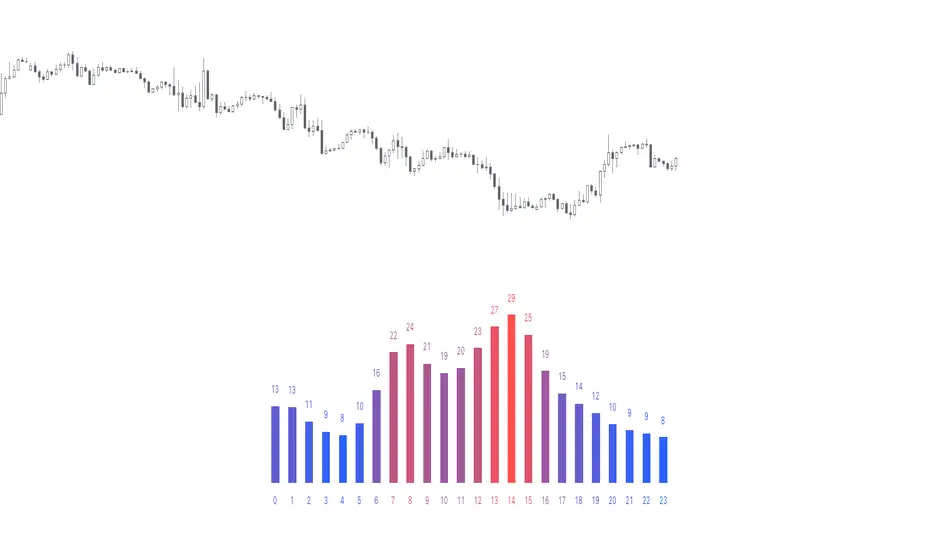
The Forex Visual Market Clock is a professional-grade session dashboard designed to help traders identify global liquidity cycles at a glance. Inspired by classic 24-hour market clocks, this indicator renders a persistent, high-contrast table on your chart that tracks market opens, closes, and the high-volume overlaps between the world's major financial hubs.
How it works
• Local Time Synchronization: The indicator translates global UTC market hours into your specific local timezone using IANA identifiers. This ensures that your "You Are Here" highlight (the white box) stays perfectly aligned with your actual wall clock.
• Automatic DST Management: The script natively handles Daylight Savings Time transitions for the selected local timezone, eliminating the need for manual GMT offset adjustments.
• Liquidity Visualization:
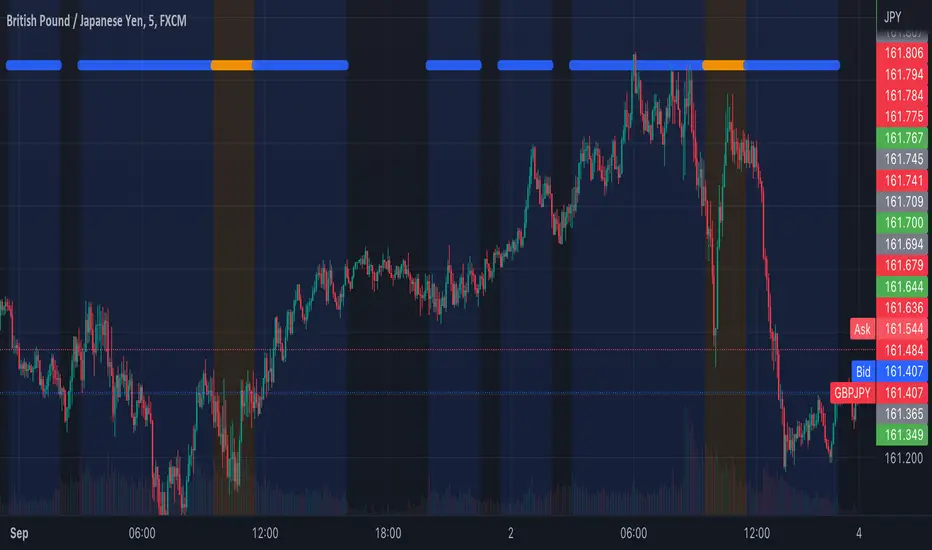
o Color-Coded Tracks: Each city is represented by a unique color-coded bar (Green for London, Orange for New York, Blue for Sydney, Yellow for Tokyo).
o Volume Peak Logic: A dedicated "VOLUME" row turns red during the London/New York overlap, signaling the period of highest historical volatility and liquidity.
• Engineered for Efficiency: Wrapped in barstate.islast logic, the script updates tick-by-tick without degrading chart performance, making it ideal for fast-paced M5 trading.
Inputs
• Local Timezone: A dropdown menu to select your region (e.g., America/Los_Angeles). This defines which hour the white "current time" box highlights.
• Display Corner: A layout setting to anchor the dashboard to any corner of your screen (Upper Left, Upper Right, Lower Left, or Lower Right).
• Visual Controls: Users can customize the opacity of the session bars and the thickness of the grey frame to suit their specific chart theme.
Pine Script® göstergesi