Scalping The Bull IndicatorName: Scalping The Bull Indicator
Category: Scalping, Trend Following, Mean Reversion.
Timeframe: 1M, 5M, 30M, 1D depending on the specific technique.
Technical Analysis: The indicator supports the operations of the trader named "Scalping The Bull" which uses price action and exponential moving averages.
Suggested usage: Altcoin showing strong trends for scalping and intra-day trades. Trigger points are used as entry and exit points and to be used to understand when a signal has more power.
It is possible to identify the following conformations:
Shimano: look at the price records of a consecutive series of closings between the EMA 60 and the EMA 223 when a certain threshold is reached. Use the trigger points as price structures to identify entry and exit zones (e.g. breakout of the yesterday high as for entry point) .
Bomb: look at the price registers a percentage variation in a single candle, greater than a threshold such as 2%, in particular on shorter timeframes and around the trigger points.
Viagra: look at there is a consecutive series of closes below the EMA 10.
Downward fake: look when, after a cross under (Death Cross), the price returns above the EMA 223 using the yesterday high as a trigger point.
Emergence: look at the EMA 60 is about to cross over the EMA 223.
Anti-crossing: look at, after an important price rise and a subsequent retracement, the EMA 60 is about to cross under the EMA 223 but a bullish impulse brings the price back above the EMAs.
For Sales: look at two types of situations: 1) when the price falls by more than 10% from the opening price and around the yesterday’s low or 2) when the price falls and then reaches, in the last 5 days, a bigger percentage and then breaks a trigger point.
Colour change: look at the opening price of the session - indicated as a trigger point.
Third touch of EMA 60: look for 3 touches below the EMA 60, and enter when there is a close above the EMA 60.
Third touch of EMA 223: look for 3 touches when there are 3 touches below the EMA 223, and enter when there is a close above the EMA 60.
Bud: look at price when it crosses upwards the average 10 and subsequently at least 2 "rest" candles are between the maximum and minimum of the breaking candle.
Fake on EMA 10: look for the open of a candle higher than the EMA 10, the minimum of the candle lower and the closing price returns above the EMA 10..
For Stop Loss and Profit Targets consider a proper R/R depending on Risk Management, using price structures such as the low of the entering candle and a quick Position Management moving quickly the Stop-Loss at Break-Even.
Configuration:
Market
EMA: The indicator automatically configure itself on market it knows (Binance, Piazza Affari and NASDAQ) otherwise it can be configured manually fo Crypto market (5/10/60/223) or Stock Market (5/10/50/200).
Additional Average: You can display an additional average, e.g. 20-period average.
Chart elements:
Session Separators: indicates the beginning of the current session (in blue)
Background: signals with the background in green an uptrend situation ( 60 > 223) and in red background a downtrend situation (60 < 223).
Trigger points:
Today's highs and lows: draw on the chart the opening price of the daily candle and the highs and lows of the day (high in purple, low in red and open in green)
Yesterday's highs and lows: draw on the chart the opening price of the daily candle, the highs and lows of the previous day (high in yellow, low in red).
Credits
Massimo : for refactoring and suggestions.
HIGH-LOW

HTF Liquidity Levels█ OVERVIEW
The indicator introduces a new representation of the previous days, weeks, and months highs & lows ( DWM HL ) with a focus on untapped levels.
█ CONCEPTS
Untapped Levels
It is popularly known that the liquidity is located behind swing points or beyond higher time frames highs/lows (in a sense, an intraday swing point is a day high/low). These key areas are said "liquid" because of the accumulation of resting orders, mainly in the form of stop-loss orders. And this more significantly on higher time frames which have more time for stacking orders. As the result, the indicator aims to keep track of untapped levels that have their liquidity states intact.
Liquidity Pools
Once a liquidity level identified, or better, a cluster of liquidity levels work as magnets for the market. The price is more likely to make its way towards heavier pockets of liquidity, by proximity (the closest liquidity pool), and by difficulty (path with less obstacles). This phenomenon is referred as liquidity run, raid, purge, grab, hunt, sweep, you name it. Consequently, the indicator can help you frame a directional bias during your trading session.
█ NOTES
Drawings
Once a level is tapped, it is highlighted. At the end of each day, all tapped levels are cleared.

4C Daily Levels Suite + Premarket High/LowThis '4C Daily Levels Suite + Premarket High/Low' indicator is a clean way to automatically plot important daily levels including:
Prior Day High
Prior Day Low
Prior Day Close
50% level between Prior High/Low
Today's Open
Today's Premarket Low+High
This Daily Levels indicator is unique in its ability to:
-Plot all of the daily level PLUS premarket high/low levels (extended hours must be turned ON)
-Can hide past days levels, only plotting levels on the current day, to keep chart cleaner
-Can extend line levels right or fullscreen
-Plots the level price at each level on the chart
-Can show/hide price levels labels
-Can add supplemental premarket levels plot to show levels being formed during the premarket time period
-Coded with line.new vs plot so dashed lines are available as a style
-Automatically hides the indicator if the timeframe selected is Daily or greater
SEE SCREENSHOT EXAMPLES BELOW
Default mode, with extended hours showing:
With supplemental premarket plot showing:
Default mode without extended hours showing:
Showing past day’s levels
Extend lines to fullscreen
Some parts of this code were adapted from 'pd Levels' by CryptoCurl

HLC True Strength Indicator (with Vix)HLC True Strength Indicator Volume Weighted with Vix Line by SpreadEagle71
This indicator is a True Strength Indicator with Close, High and Low used together, along with the TSI of the Vix.
The white line is the close. The red line is the lows and the blue is the highs. These are also volume-weighted.
How to Interpret:
1. zero line crosses. If SPY/SPX500 crosses the zero line, then its bullish. If the purple Vix line crosses up, watch out because this is bearish.
2. white/blue/red lines cross purple (Vix). If they cross upwards, this is bullish. If downward, this is bearish. Basically, SPX, ES1!, SPY or even DIA can be used. The security and the Vix should travel in opposite directions and cross the zero-line at the same time. But this is not always the case.
3. Black area infills. These are used between the close and the highs (blue) and the lows(red). Close should not be between these in order to have momentum.
4. Close (white line) leads. Close is the last price so it tends to show where the others (highs and lows) are going. If the close is sagging below a high where the blue lines are on top, this could mean that there is a reversal coming. Same holds true for a white line above a "valley" formed by the blue and red lines; it could mean a reversal to the upside soon.
5. The Black Infill areas as a squeeze or contraction/expansion area. The thinner the black infill areas, the more of a momentum "squeeze" could be present. Wide black infill areas mean increased volatility and what may come next is a reversion to the mean for volatility. See TTM Squeeze Indicator or the Squeeze Momentum Indicator (kudos LazyBear).
Lastly, just remember indicators indicate; they are not magic. :)
SpreadEagle71

Wurucututu's Daily/Weekly/Monthly HLOCThis script draws the High/Low range for a daily, weekly, or monthly periods. By default is set to weekly.
Also it draws the open and close for each period, painting it in red if open greater than close, and green otherwise.
You can forward shift ranges to see how current price action interacts with ranges from past periods. By default this is set to zero.
For instance, here is the interaction of current week with previous week range (i.e. a 1 week shift forward).
And here is a 7 month shift forward.

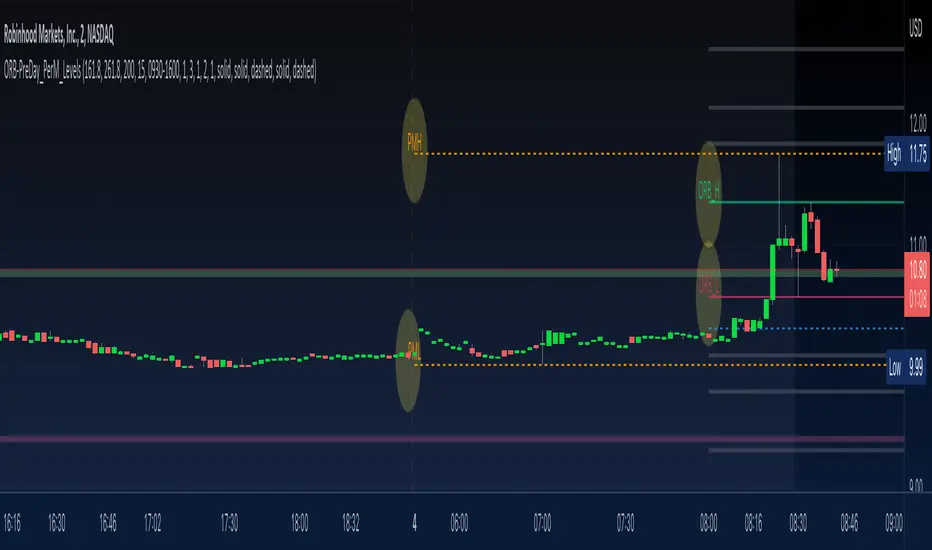
ORB-PreDay_PerM_LevelsThis script provides following levels:
1. ORB Level - You can adjust the timeframe of Opening Range (plots from 9am to 4pm)
2. ORB Fib Extension - 1.618 and 2.618 Fibonacci Extension of ORB High and Low (plots from 9am to 4pm)
3. Previous Day High/Low/Close - You can adjust color/thickness of the lines (plots from two days ago so that you can clearly see the levels)
4. Previous Two Days High/Low (plots from two days ago so that you can clearly see the levels)
5. Pre-Market High/Low (plots from 6:30am to 11am)
All in one indicator gives much better clarity of where current instrument is trading in relation to ORB, Previous Day Levels and Previous Two Days Levels along with Pre Market Levels.
You could combine these levels with your favorite EMA or EMA Cloud to create a trading system.
You could combine these levels with MA Cloud and ATR vs DTR script to gauge the move.
Look at the TWTR Chart today and see how these levels are respected.
[TTI] All-time-high (ATH), (ATL), 52 week high and low Dots––––History & Credit
I wanted to show our community the idea that stocks that make All Time High are likely to continue making ATHs for some time. It goes contrary to the idea "buy cheap sell high". Actually, in the real market leaders the stocks that make 100+% return are just getting started on returns to few THOUSAND percent. I have used code from QuantNovad scrip in this one too. So thanks to him as well, since it speeded writing it from scratch!
–––––What it does
The script paints dots and shows stats.
The dots are 4 types:
🟢 = Every time a new ATH is achieved, a green dot paints above the bar
🟣 = Every time a new 52week High is achieved, a purple dot paints above the bar
🟡 = Every time a new ATL is achieved, a yellow dot paints below the bar
🟠 = Every time a new 52week Low is achieved, a orange dot paints below the bar
Stats =
Show in a box in the bottom right corner of the screen. How many times has this stock achieved:
👉 ATHs
👉 52WK High
👉 ATLs
👉 52WK LOW
–––––How to use it
This is really an illustrative script to get the idea of the methodology "buy high sell higher', that we teach as momentum traders.
Some notable examples to check are:
HOOD
MSFT
TSLA
AAPL
See the stock dynamics and understand that bottom fishing doesn't result in stocks making massive moves.

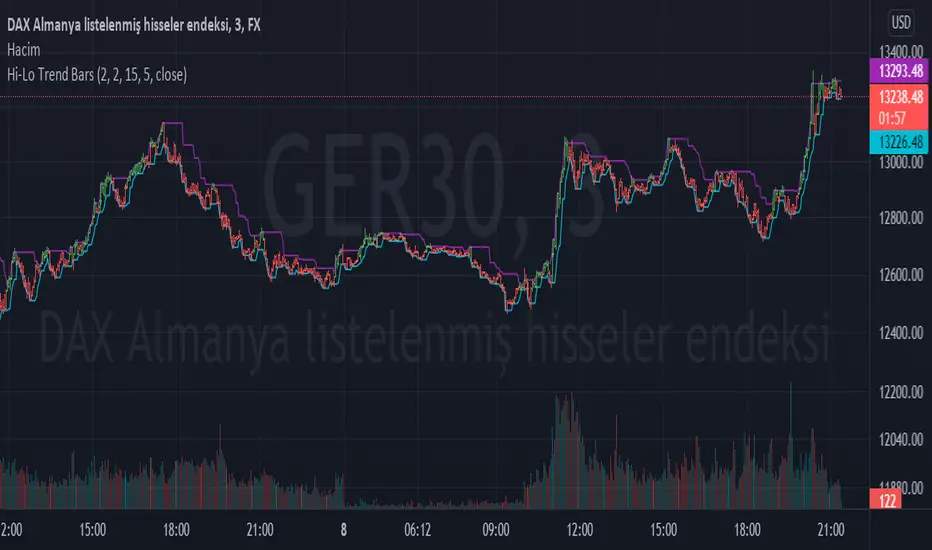
Hi-Lo Trend BarsI present to you a simple but useful indicator.
The basic logic is an indicator that tracks the high of the high bars in the specified range and the low of the low bars in the specified range.
I used two multipliers in order to go out of certain ranges and I tried to provide precision by subtracting this multiplier value from the lowest and highest values.
I set the steps of the multipliers to 0.01 so that it is easy to use on instruments that require finer tuning.
Because every instrument has its own dynamics. You should change the multiplier values according to the instrument dynamics.
For example, under Spot, these multiplier values work efficiently with a large multiplier such as 2.0. It is more efficient in the range of 0.1 - 0.2 in the stock market.
I hope your transactions will be of some use in directional evaluation.
Thanks.
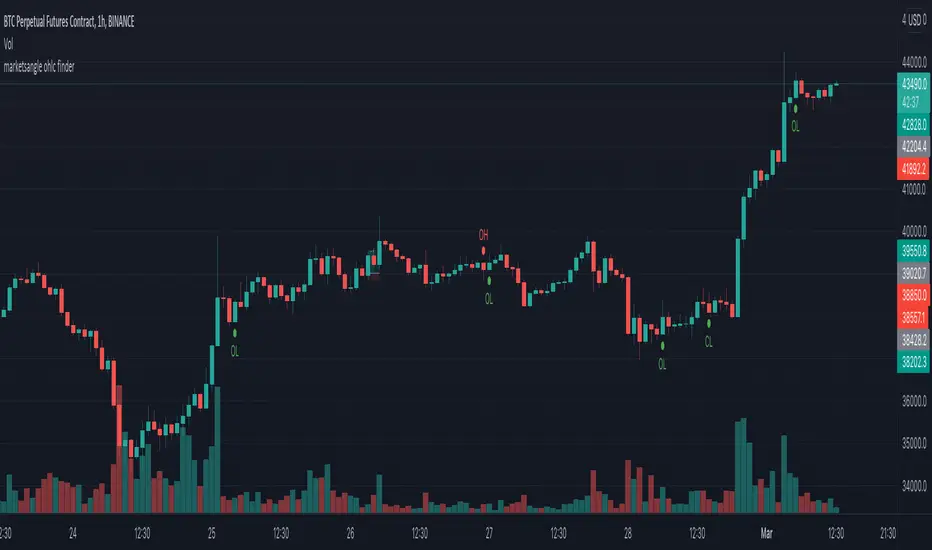
marketsangle ohlc finderThis Indicator helps you to identify open=low, open=high, close=low and close=high candles. You can use it anytime frame you want.
open=low => Shows Strong Buying Force
open=high => Shows Strong Selling Force
close=low => Shows Strong Selling Force
close=high => Shows Strong Buying Force
For best results use it with a combination of other indicators or oscillators.
Koalafied EdgesIndicator based on user selected periods 'edges' (highs/lows). Includes One-Time-Framing and sweeps of levels.
User selection of previous Session/Day/Week highs and lows. These will plot over the relevant period once it has completed. Intra-day there are three periods that can be plotted.
For now these are most relevant to crypto. It can be useful to think of previous levels being locations that are likely to contain liquidity that the market might sweep in the future,
as much like pivot points, traders stop orders can be found there. Session breaks are included to allow for clear delineation between user selected periods. Additionally the option
to colour the background of a specific period is given to the user, this can be useful as an aid for visual analysis of session behaviour over time.
Untapped Levels
Previous Levels (Highs/Lows) that price has not re-tested will remain on the chart. These are typically the levels that are swept for liquidity in future periods.
Sweeps
Sweeps are formed when a candle opens above/below a previous periods level, crosses it and closes back on the side of the open. Often can mark important
pivots in the market and potential reversals. Useful if you think of stop liquidity resting outside previous periods highs/lows. Market 'sweeps' the level,
taking liquidity and reverses. Alerts for these are included.
One-Time-Framing
Indicator shows One-Time-Framing (OTF) for user selection of Candle, Session, Day, and Weekly timeframes. The background between the periods highs and lows (or candle colour)
will display the OTF state. This is a Market Profile concept that isn't typically found in Tradingview Scripts.
OTF is a sequence of days or time period where you don’t get a break of the previous candles low (OTF Up) or high (OTF Down). Typically shows a market
that is trending in one direction. If it's an outside day then no OTF status, if it's an inside day then the previous period high or low hasn't been
breached so OTF status stays same.
Candle colouring. I've included the option to switch between OTF coloured candles or my Volume Extension candles. I find the Volume Extension Candles invaluable
in showing areas of high market participation and can be quite informative at significant levels often showing exhaustion at support/resistance or market strength on breakouts.
Candles not supported by rising volume are coloured black while those that are retain their colouring.
Important to note that this indicator plots prior levels only when the selected period has ended. So at the start of a new period, the high/low of the previous
period will be plotted, with untapped lines extended into the future. The indicator is designed to show you what 'has' happened and to provide areas
of interest where you may wish to initiate trades. The sweep signals are the only real-time plots.

HL Marker - CKThis Indicator will help to identify the high and low on the trend, which helps to draw the trendline perfectly.

Percentage Levels by TimeframePlots the positive and negative percentage levels from a selection of timeframes and sources for any ticker. You can use this within a pullback trading system. For example, if you historically look at the average pullback of large cap stocks and ETF's, you can use this indicator to plot the levels it could pullback to for an entry to go long. It can be used as potential targets when trading a ticker short. Another use for this is to backtest the set percentage targets using TradingView's bar replay feature to see how ETF's and large cap stocks have reacted at these levels. Note: This is intended to be used at timeframes equal to higher than the chart's as it may cause re-painting issues.
Currently percentage levels are statically set to 1, 3, 5, 10, 15, 20, 25, and 30% levels above and below the chosen source (open, high, low, close). You can also display the data based on timeframes from Daily (1D) all the way up to Yearly (12M)
*Not financial advice but in my opinion the current percentage levels set (see above) are best used for ETF's and Large Cap Stocks.
Jan 2
Release Notes: Added the ability to select the historical bars to look back when plotting levels
Jan 2
Release Notes: To get a better display or proper resolution on your charts, change the view settings to "Scale Price Chart Only"
Jan 2
Release Notes: To add % labels for this indicator on the price axis, change your chart settings to include "Indicator Name Label" & "Indicator Last Value". You can find this under the Label section after hitting the gear icon in the bottom right of your chart.
Jan 2
Release Notes: Added: Custom Line Plot Extension Settings. Ideally both values should be equal to display optimal extended lines. To return to a base setting: '1' = Historical Lookback & '0' = Offset Lines. Also note this is dependent on the timeframe you are viewing on the chart.
Jan 2
Release Notes: Removed indicator from example chart that was not needed.
Jan 2
Release Notes: Updated some comments in the Pine Script
Jan 2
Release Notes: Update: Added commentary and instructions in the indicator settings to address recommended line plot settings for Stocks/ETF's vs Futures
Jan 2
Release Notes: Changed title from "Calculation Method" to "Calculation Source"
Jan 4 2021
Normal use of security() dictates that it only be used at timeframes equal to or higher than the chart's as it may cause re-painting

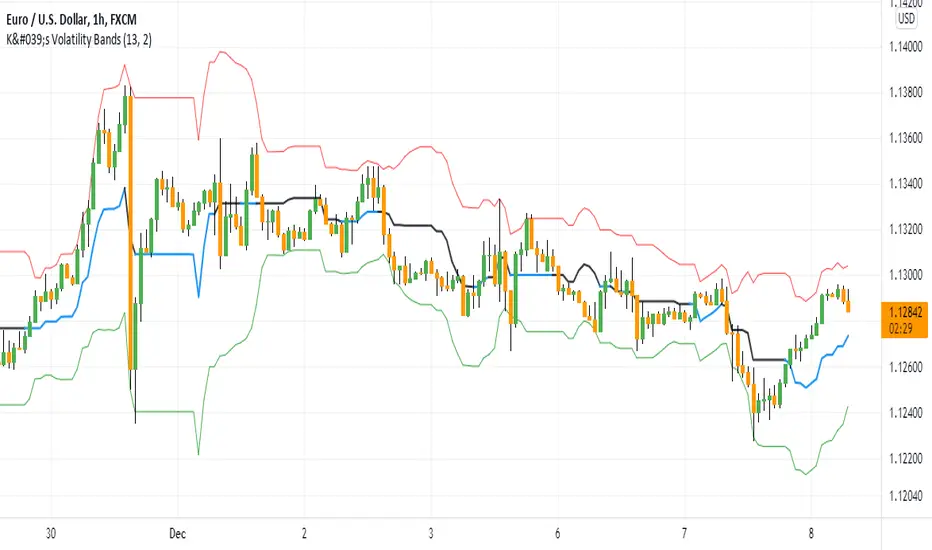
K's Volatility BandsVolatility bands come in all shapes and forms contrary to what is believed. Bollinger bands remain the principal indicator in the volatility bands family. K's Volatility bands is an attempt at optimizing the original bands. Below is the method of calculation:
* We must first start by calculating a rolling measure based on the average between the highest high and the lowest low in the last specified lookback window. This will give us a type of moving average that tracks the market price. The specificity here is that when the market does not make higher highs nor lower lows, the line will be flat. A flat line can also be thought of as a magnet of the price as the ranging property could hint to a further sideways movement.
* The K’s volatility bands assume the worst with volatility and thus will take the maximum volatility for a given lookback period. Unlike the Bollinger bands which will take the latest volatility calculation every single step of time, K’s volatility bands will suppose that we must be protected by the maximum of volatility for that period which will give us from time to time stable support and resistance levels.
Therefore, the difference between the Bollinger bands and K's volatility bands are as follows:
* Bollinger Bands' formula calculates a simple moving average on the closing prices while K's volatility bands' formula calculates the average of the highest highs and the lowest lows.
* Bollinger Bands' formula calculates a simple standard deviation on the closing prices while K's volatility bands' formula calculates the highest standard deviation for the lookback period.
Applying the bands is similar to applying any other volatility bands. We can list the typical strategies below:
* The range play strategy : This is the usual reversal strategy where we buy whenever the price hits the lower band and sell short whenever it hits the upper band.
* The band re-entry strategy : This strategy awaits the confirmation that the price has recognized the band and has shaped a reaction around it and has reintegrated the whole envelope. It may be slightly lagging in nature but it may filter out bad trades.
* Following the trend strategy : This is a controversial strategy that is the opposite of the first one. It assumes that whenever the upper band is surpassed, a buy signal is generated and whenever the lower band is broken, a sell signal is generated.
* Combination with other indicators : The bands can be combined with other technical indicators such as the RSI in order to have more confirmation. This is however no guarantee that the signals will improve in quality.
* Specific strategy on K’s volatility bands : This one is similar to the first range play strategy but it adds the extra filter where the trade has a higher conviction if the median line is flat. The reason for this is that a flat line means that no higher highs nor lower lows have been made and therefore, we may be in a sideways market which is a fertile ground for mean-reversion strategies.
Time-of-Day DeviationCreates a 'Time-of-Day' Deviation cone starting from the first bar of the session based upon data from previous days.

Daily DeviationShows you the normal deviation from the OPEN based upon historical data.
Levels measured:
Normal range (1 standard deviation) of the CLOSE (vs the OPEN).
Normal daily HIGH +1, +2, +3, and +4 standard deviations.
Normal daily LOW -1, -2, -3, and -4 standard deviations.
Configuration:
Always shows you the normal CLOSE vs OPEN range for the current session.
Can display previous day's ranges (extra days) based upon the calendar (not trading days).
Normally displays which levels have been exceeded (to reduce noise and keep auto-scale to a minimum), but can show all the ranges for the current session.
The default number of days to measure (50) will affect the accuracy but outliers are cleaned to avoid dramatic variance.
Note:
These are only statistical representations of what has occurred in the past. You can interpret the current price as oversold or overbought for the day (and only that day) relative to the OPEN. Gaps high or low are not considered in the equation.

High Low Open Mid Ranges & Levels (Multi-Timeframe)This indicator automatically plots the chosen timeframe's high, low, mid point and open. These levels on higher timeframes act as support and resistance levels on lower timeframes, helping find entries, stoploss and profit targets.
Most common timeframes to choose are Daily, 1W, 1M, and 3M. Other timeframes that are good include, 2D, 2W and 2M.
For example, you can see in the snapshot below, we are on the 4hr TF showing those levels from the 2W. This historical 2W zone (open and mid) was (and currently still is) resistance. You can see it also provided a good entry to go short.
This is also useful for intraday scalping. Below, we are on the 15min TF with levels set on the 2D timeframe. You can see how the Open and Mid levels acted as resistance, providing good entries on range trades, with take profit set at the previous 2D low.
There is also a table which tells you all the main TFs high, low, open, and mid levels. They are the most important ones to look out for.
This indicator should not be used in isolation; it is best to pair it up with other TA such as orderblocks, S/D zones, S&R or overlay indicators.

Pivot TrackerThis script finds swing lows and swing highs based on input criteria for lookback and lookforward periods, and plots letters accordingly.
Helps identify trend or lacktherof
HH = higher high
LH = lower high
HL = higher low
LL = lower low

Poor ReversalsPoor Reversals Indicator
This indicator finds Poor Reversals. Poor reversals are reversals in price with consecutive highs or lows that are close together. Look for the different types of highs and lows. Some say candle patterns don't matter, but they forget it's the orderflow that makes the pattern. Find poor, tweezer, and 1 tic rejections and study what happens next. We don't need to read the depth of market to see what the orderflow is saying. They are called poor because the auction didn't run its course. It didn't continue the direction until all activity in that direction was exhausted. Proper reversals create excess. Excess is a long tail/wick. A proper reversal leaves a long tailed excess unfilled.
The different highs and lows give clues to what kind of orderflow happened there. The difference between them is which high or low happened first. Price does often come back to these areas and clears them up with a proper reversal. We can see them on all timeframes. Knowing what they mean in the orderflow helps with reading charts.
The Poor Reversals are:
Poor
1 Tick Rejection
Tweezer
When looking at 2 bars that have very close high or lows, there are a few different types. They are each poor and can be further defined as each are price action clues.
If next low is higher, it's a poor low
If next low is lower, it's 1 tic rejection
If next low is equal, it's tweezer bottom
If next high is lower, it's a poor low
If next high is higher it's 1 tic rejection
If next high is equal it's tweezer bottom
Poor Highs and Lows:
The high or low comes first. The next bar does not go past it. Poor highs and lows are often created from price exhaustions. This means at poor highs buyers are trapped. At poor lows sellers are trapped. Price ran out of steam to continue in that direction. There wasn't enough activity and participation to continue the auction in that direction.
Poor lows are defined when 2 lows are very close, and the 1st bar is lower. The 2nd comes very close to a new low. It happens most when shorts, at the moment, "run out of steam". They were "too aggressive" and got themselves "short in the hole". When a poor low is made, price will bounce because shorts are buying to protect profits.
Poor highs are defined when 2 highs are very close. The 1st bar is higher. The 2nd comes very close to a new high. It happens most when longs, at the moment, "run out of steam". They were "too aggressive" and got themselves "long in the tooth". When a poor high is made, price will pullback because longs are selling to protect profits.
1 Tick Rejections:
The high or low comes last. The next bar goes just a little bit beyond it. A "1 tic rejection" happens when a new low is made and quickly rejects. The name is misleading. It doesn't have to be "1 tic". Different markets have different measurements. For ES, it's less than 8 tics. For NQ, it's about 5-20 points. It varies depending on relative market volatility.
1 Tick highs are defined when 2 highs are very close, and the 1st bar is lower. This happens when longs are aggressive and drive price up. Price makes a newer high and longs rapidly start taking profits. Their selling activity drives price lower. In the orderflow, longs likely closed at the same time new shorts sell. This competition to sell drives price lower. At the high, it says longs saw it wouldn't go higher and they took rapid exit.
1 Tick lows are defined when 2 lows are very close, and the 1st bar is lower. This happens when shorts are aggressive and drive price down. Price makes a newer low and shorts rapidly start taking profits. Their buying activity drives price higher. In the orderflow, shorts likely closed at the same time new longs buy. This competition to buy drives price higher. At the low, it says shorts saw it wouldn't go lower and they took rapid exit.
Tweezer Tops and Bottoms
The highs or lows of the bars are equal. Tweezers most often mean that an aggressive trader is influencing price. They drove price in one direction and then quickly reversed sentiment. Tweezers most often happens in stop hunts. An aggressive trader found where the stops were located and then entered an aggressive order to turn the market.
Tweezer Tops are defined when 2 highs are equal. The first bar sets the high. The second bar matches the high. This happens when there is an active seller entering. It could be simple profit taking from longs or new aggressive shorts. In bull trends, price will move up to find short stop. When the stops are found, the market reverses sharply lower.
Tweezer Bottoms are defined when 2 lows are equal. The first bar sets the low. The second bar matches the low. This happens when there is an active buyer entering. It could be simple profit taking from shorts or new aggressive longs. In bull trends, price will move up to find long stops. When the stops are found, the market reverses sharply higher.
Poor Reversals can be poor, 1 Tick Rejections, or Tweezers. They are all considered poor and upon further investigation we can see they are created from different conditions in the orderflow. They are not called Poor Reversals because they are weak. They are called poor because of the action that happened there. One side got caught in a bad position. Other sharks in the market smelled blood and ripped them apart.
This indicator is a work in process. While the concepts are great for real time trading, this indicator is not designed to be used in real time trading. It will repaint based on the bar close. The purpose of this indicator is to train our brains to see these nuances on candle charts. Some say candle patterns don't matter, but they forget it's the orderflow that makes the pattern. We must make split second decisions and knowing the context behind the orderflow reduces response time. These poor reversals don't have to retest, and the best ones won't come back. I use these concepts to find exits, where my trades might be wrong, confirmation I'm on the right side. It's amazing how these simple nuances can turn the markets. But sure enough, they do. Check them out in all time frames.
It's a fun indicator to play with. Some markets do require tweaks to the “Ticks” setting. Too big and charts will be noisy. Too low and not much will show up. A general rule of thumb is more volatile markets need higher tick values while less volatile need lower Tick values. Higher timeframes are also more reliable than lower time frames. I've included some customizable settings and I plan on adding more in the future. Enjoy!

Michigandolf's 30min Opening RangeThis script plots the 30min Opening Range as well as the previous day's high & low.
Description:
Blue Line = Top of the 30min Opening Range for the session
Pink Line = Bottom of the 30min Opening Range for the session
White Line = Mid-Point of the 30min Opening Range for the session
White Transparent Area = The full range of the 30min Opening Range
Green Line = Yesterday's High for the session
Red Line = Yesterday's Low for the session
Use:
The Opening Range will continue to expand until the first 30minutes of trading has passed, at which point the range will lock in place for the remainder of the trading session. Many traders use these important levels to gauge trade entries and exits (e.g. Mark Fisher's ACD strategy).
This script does not work currently work for futures (e.g. ES, NQ, RTY) due to the session start time. Will configure for futures trading in a future update.

Pivot Points High Low MTF [Anan]█ OVERVIEW
Pivot Points High Low with Multi Time Frames support and bull/bear signal depends on pivot average
█ FEATURES
- Fully control of pivot (Source / Length Left / Length Right)
- Show HH, LL, LH, HL price on candles
- Show Avg Pivot High Low.
- Show Bull/Bear Labels.
- Control of signal accuracy (default: 0.5%)
- Show Pivot High Low Levels as a Fractal Chaos Channel.
- Multi-timeframe Table with support of Pivot High Low and pivot Average.
- BreakOut and BreakDown Labels in the table.
- Full control of displaying any row or any column.
- Full control of Table position and Size and Colors.

Fib High Low PointsThis is a simple indicator which plot high and lows based on Fibonacci sequence.
Best part of this indicator is it don't rewrite itself once it got plotted on the chart, which make it unique from other High low indicators.

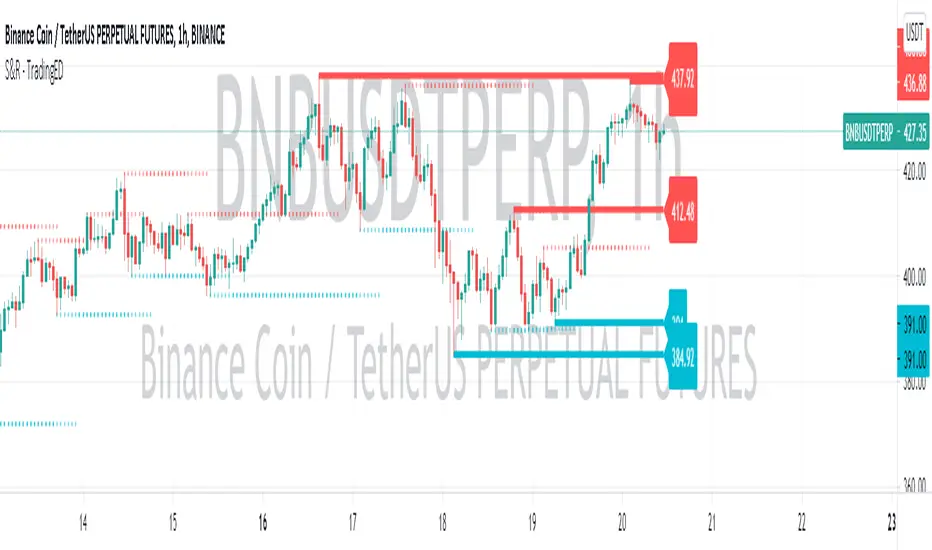
Support & Resistance - TradingEDThe use of this indicator is restricted to private use, and it can be used only by invitation. Different functionalities have been added, such as alerts and signals that seek to make trading much easier to interpret by any type of trading operator of any experience level, from beginner to intermediate and advanced.
This indicator will help you identify support and resistance levels over a previously determined range, whether from a count by candles , by minutes , hours or days . These support and resistance levels are calculated thanks to the highest and lowest points that will be painted along the chart, from the levels that you have previously selected .
You will even have a way to identify the most recent levels , thanks to the fact that they will be painted in a darker tone , as well as some price labels to quickly identify each of the levels on the chart . Identifying these levels sometimes seems like a pretty difficult task, but with this indicator you will discover that it will be much easier than you think to be able to master these levels.
As part of the analysis of chart patterns, traders use these price levels on charts that tend to act as barriers, preventing the price of an asset from being pushed in a certain direction. Support and resistance levels serve to identify the points where the price can favor certain probabilities for a stagnation or reversal of a prevailing trend.
Main functions of this indicator:
1) The MEASURE can be based on a CANDLES count if you are trading OHLC Charts from 1D onwards , or if your trading is intraday, you can also select counts by MINUTES , HOURS or DAYS , depending on your trading style.
2) LENGTH , by default it will be loaded as in the STRATEGY , but considering the previous point, you can modify it according to your convenience.
3) You have the option to hide or show the EXTENDED LEVELS the way to identify the most recent levels.
4) You have the option to hide or show a LABEL at the right of the chart, with respect to the price levels.
Main functions to customize the style of this indicator:
a) You can select the COLOR for Support and for Resistance, with the colors that best suit you.
b) In the case of the LABELS that appear at the right, the text, type of label and default color is not modifiable.
nonoiraq indicator it's very strong i edit this indicator to connect it with my bot to auto trading and he take the info from the volume, so when he is give me a single the bot take just 0.50% to 1% for 3 - 5 trade in day and this perfect, if u use a manual trading this indicator can reach to from 10% to 80% in some point .
the indicator have 3 line
(Red , Purple, Yellow)
1- The yellow line it's high sensitivity this mean it's when rich to the -3 or 3 you can open the order when the bar is close and the signal be sure
and u need to watch the your order because in some case he is reach to 0.30% to 2% and the price reflected to loss and when you wait the price reflected to but my advice you take profit and close the order directly.
2- The purple circles it's medium sensitivity this mean when the purple hit the 2.5 or 3 from down or up in indicator with yellow line you open the order when bar close and the signal is be sure , like example in the photo
3- The red circles it's low sensitivity and this one when reach to 3.0 with any line (yellow or purple) you open directly short or long , like the example in the photo
i am sorry for my english it's not very good
please support me to share other idea or script
