Ghost Ninja Moving Average by HassonyaThe Ghost Ninja Moving Average indicator contains three ema averages. These are ema 21, ema 55 and ema 233.
The values of the averages appearing on the screen are adjusted according to their own lengths. If you want, you can change the settings from the "Numbers of bars back" setting.
The 1st moving average (EMA-21) will follow the price and will disappear if the price is above it. It will only appear where needed.
The 2nd moving average (EMA-55) will be red if not orange when EMA-21 is greater than EMA-55.
The 3rd moving average (EMA-233) will appear if EMA-55 is greater than it, otherwise it will not.
The system will also display Golden and Death crosses.
I hope you will be satisfied using it. Yours sincerely. Happy Trading
TÜRKÇE AÇIKLAMA
Ghost Ninja Hareketli Ortalama indikatörü, üç adet ema ortalaması barındırıyor. Bunlar ema 21, ema 55 ve ema 233 tür.
Ortalamaların ekranda gözükme değerleri, kendi uzunluklarına göre ayarlanmıştır. İsterseniz ayarları "Numbers of bars back" ayarından değiştirebilirsiniz.
1nci hareketli ortalama olan (EMA-21), fiyatı izleyerek eğer fiyat onun üzerindeyse gözükecek değilse yok olacak. Sadece gerektiği yerlerde gözükecek.
2nci hareketli ortalama(EMA-55), EMA-21 EMA-55'ten büyük olduğunda turuncu değilse kırmızı olacak.
3ncü hareketli ortalama(EMA-233), Eğer EMA-55 ondan büyükse gözükecek yoksa gözükmeyecek.
Sistem aynı zamanda Golden ve Death crossları da gösterecek.
Güle güle kullanın. Bereket bulun. Sevgiler
Hassonya

EMA Index Cross by Hassonya
While the indicator is working on any stock chart, it shows the two ema average breakdown/breakup of the index or any other stock with an arrow. In this way, you will be able to follow the ema intersections of the index chart while working on a normal stock chart.
I will add other moving average options if you like it.
I hope you will be satisfied using it.
TURKISH
------------
Gösterge, herhangi bir hisse senedi grafiği üzerinde çalışırken, endeksin veya başka bir hisse senedinin iki ema ortalama dağılımını/dökülmesini bir okla gösterir.
Bu sayede normal bir hisse senedi grafiği üzerinde çalışırken endeks grafiğinin ema kesişimlerini takip edebileceksiniz.
Eğer beğenirseniz başka ortalama seçenekleri de ekleyeceğim.
Güle güle kullanın.

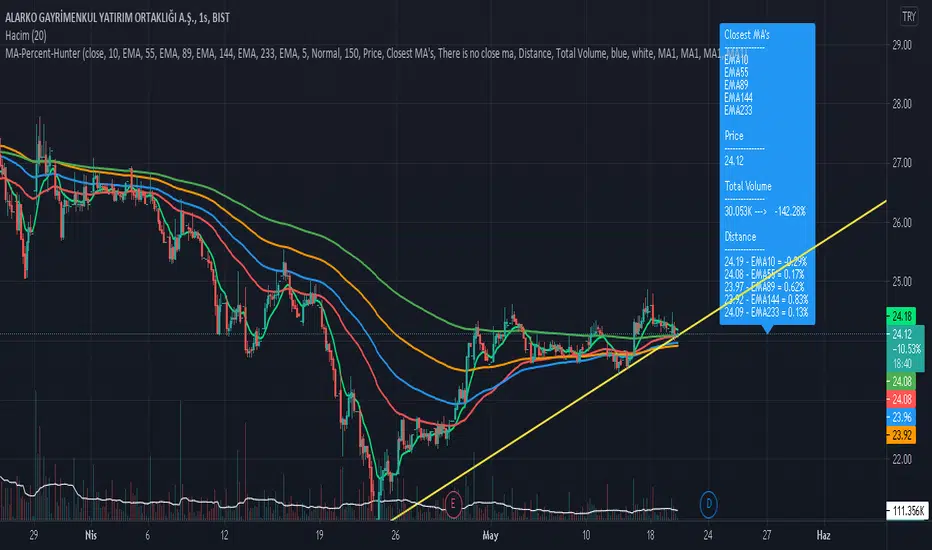
Moving Average Percentage Hunter by HassonyaIn this indicator study, we aim to capture the moving averages to which the bar close is closest. The indicator shows the moving averages, which are closest to the percentage value we selected, on the label. It indicates the names of the closest averages at the top of the label with a (near) note next to them. If none of the averages are close to the specified percentage value, there will be a no nearness warning. The indicator supports the heikin ashi candles. For this setting, check the I'm using heikin ashi candles box.
Thanks to this feature of the indicator, you will be able to see bar proximity to the moving averages you use continuously. You can make purchases and sales by using this feature to your advantage. This way you can easily catch reaction turns.
If you want, you can turn off moving averages in the settings section. You can open it whenever you need. You can do this in the show moving averages box. Appears if you check it, disappears if you uncheck it.
There are 5 moving average options. SMA, EMA, WMA, TMA and HullMA moving averages. Moving average names and values in the list are dynamically adjusted. When you change the settings, the moving average names and values in the list will change automatically. At the bottom of the settings, you can determine the lengths of the moving averages yourself. In the next update, each moving average will have a different average option.
You can enter percentage values, fractional figures. for example (3.5, 5.2 vb.) The indicator will show you the value you give and the proximity of the value below that value. You can adjust this setting in MA Percentage Nearness.
More detailed options will be available in the next update. Range of values, options below, above, and so on.
In the settings section, there is a Show distance option. If you check this option, you can continuously see the percentage values of the distance to the moving averages on the label. For this feature, you have to check the show distance box.
The alarm feature will come in the next update.
Thanks for support. Good Luck.
HEYC-Bands-Strategy by HassonyaHey guys, HEYC-Bands-Strategy indicator is moving average envelopes trend tracker system are pivot-based envelopes set above and below a moving average. Envelope is then set the high and low above or below the moving average. This creates parallel bands that follow price action. With a moving average as the base, Moving Average Envelopes can be used as a trend following indicator. However, this indicator is not limited to just trend following. You can also use it as support and resistance. The indicator aims to ensure that you follow the trend with maximum consistency and stay in the trend.
The indicator has 15 different options that form the basis of the moving average. What options are these?
- EMA - Exponential Moving Average
- WMA - Weighted Moving Average
- VWMA - Volume-Weighted Moving Average
- DEMA - Double Exponential Moving Average
- TEMA - Triple Exponential Moving Average
- LAGMA - Laguerre Moving Average
- HULLMA - Hull Moving Average
- EHMA - Exponential Hull Moving Average
- ETMA - Exponential Triangular Moving Average
- SSMA - Super-Smoother Moving Average
- ALMA - Arnaud Legoux Moving Average
- VIDYA - Variable Index Dynamic Average
- STMA - Triangular Moving Average
- ZEMA - Zero-Lag Exponential Moving Average
- SMA - Simple Moving Average
With the simplest logic, you can use it as buy when the price closes on the band, and sell when the price closes below the band.
Vertical lines and background guide you in the buying/selling trend changes in the indicator settings.
Thanks for support

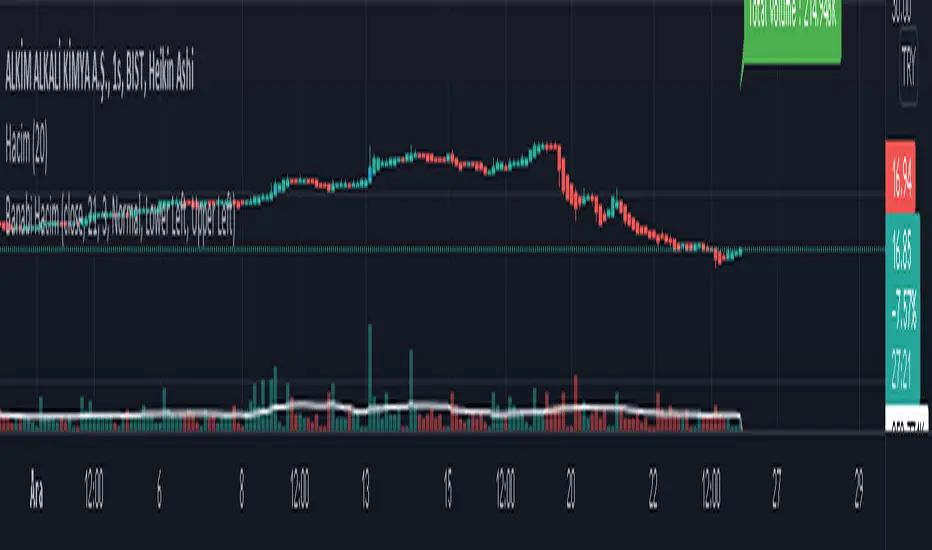
Banabi Hacim by HassonyaThe Banabi Hacim indicator shows you the movement of volume in the last bar in terms of percentage buying and selling directions. You can use it in any period you want. It is designed to help you and give you ideas for buying or selling. It will be your assistant in critical places where you are thinking of buying or selling.
Thanks for supports
TÜRKÇE AÇIKLAMA
Banabi Hacim indikatörü size son barda gerçekleşen işlem hacim hareketini yüzdesel olarak alış ve satış yönlü olarak gösterir. İstediğiniz periyotta kullanabilirsiniz. Alım yada satım yapmak için size yardımcı olmak ve fikir vermek için tasarlandı.
Destekleriniz için teşekkürler
Hayrını görün sevgiler