Converging Chart Patterns - Ultimate [Trendoscope®]🎲 Introducing the Converging Chart Patterns Ultimate Indicator
Derived from the comprehensive capabilities of our premium offering, the Auto Chart Patterns - Ultimate , this new indicator focuses exclusively on converging chart patterns. It marks the beginning of a series that, over time, will encompass the full spectrum of chart pattern analysis, ultimately enhancing and expanding beyond the scope of Auto Chart Patterns.
This strategic separation into more focused indicators is designed to cater to traders seeking precision in specific chart pattern categories.
🎲 Leveraging Research and Open-Source Foundations
Our journey to this indicator has been paved by extensive research and the insights gained from our prior works on Chart Patterns, including:
Algorithmic Identification of Chart Patterns
Flag and Pennant Chart Patterns
Trading Converging Chart Patterns
Drawing upon the foundation laid by our publicly shared indicators - Auto Chart Patterns and Flags and Pennants - this tool is the culmination of our efforts to provide traders with a refined method for strategizing around converging patterns. It not only facilitates the development of technical trading strategies but also aids in evaluating their effectiveness through historical performance analysis. The specific patterns addressed by this indicator include:
Rising Wedge (Converging Type)
Falling Wedge (Converging Type)
Converging Triangle
Rising Triangle (Converging Type)
Falling Triangle (Converging Type)
🎲 Chart Pattern Scanning Methodology
The process of identifying converging chart patterns involves several key steps:
Begin by examining each zigzag for the last 5 or 6 pivot points to identify potential trend line pairs.
Determine if these trend lines are converging by projecting them forwards and checking for an intersection within a specified number of bars ahead.
Upon confirming convergence, categorize each pattern based on the directional orientation of its trend lines, as detailed in our article - Algorithmic Identification of Chart Patterns
🎲 Methodology or Trading for Chart Patterns
While traditional views assign specific trading biases to converging patterns (e.g., Rising Wedges as bearish and Falling Wedges as bullish, with Triangles being more versatile), empirical support for these assumptions is limited. Our indicator is designed to empower users to explore and validate various trading hypotheses, including unconventional ones, thereby not confining trading strategies to past market behaviors.
We enable extensive customization for testing different strategies, with the initial setup allowing for both long and short trading scenarios for each identified pattern. Users have the liberty to adjust trading directions and other parameters within the indicator's settings to suit their analytical needs.
This open approach is rooted in the methodology outlined in - Trading Converging Chart Patterns , exemplified by the following process, which users can adapt and refine through our indicator.
🎲 Overview of Indicator Components
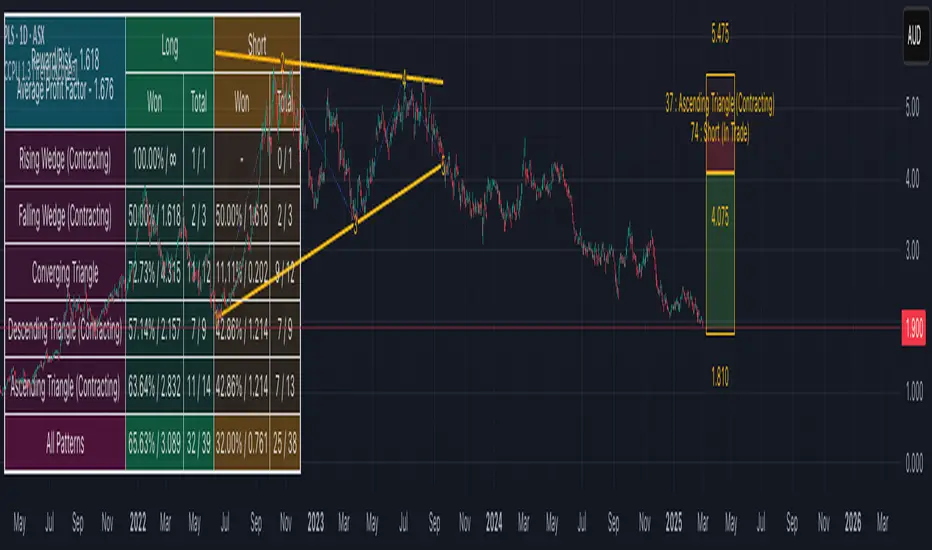
The components of our indicator are illustrated in the chart below
Pattern Visualization : This feature dynamically displays the patterns on the chart, focusing on currently active patterns. To maintain clarity and performance, historical patterns are not shown due to the constraints of drawing objects.
Trading Annotations : The indicator marks open trades directly on the chart, accommodating both long and short positions depending on the user's settings and the current status of trades associated with each pattern.
Performance Metrics Table : A comprehensive table presents the back testing results for individual patterns as well as aggregated outcomes. It includes crucial metrics such as win rates and the profit factor based on the set risk-reward ratio, offering users valuable insights into the potential profitability of their configurations and trade strategies.
🎲 Exploring the Indicator's Customization Options
This indicator is rich in settings, offering users the capability to tailor criteria and adapt their trading rules. Each setting is accompanied by detailed tooltips, providing insights into their use. Let's examine each category systematically.
🎯 Zigzag Configuration Options
These settings enable users to adjust the scope of their pattern analysis by varying the zigzag's length and depth.
Length Adjustment : Modifying this parameter changes the scale of detected patterns, with higher values spotting larger formations and lower ones focusing on more compact patterns.
Depth Enhancement : This alters the intricacy of the recursive zigzag analysis, potentially unveiling larger patterns across several levels. Caution is advised, as excessive depth may lead to the indicator exceeding its processing capacity.
🎯 Pattern Scanning Settings
This suite of settings fine-tunes the pattern scanning process, generally calibrated for precise geometric alignment of identified patterns. While most settings may remain as default for routine use, users are encouraged to tweak them, especially the "Last Pivot Direction," to explore various theoretical approaches to pattern trading.
🎯 Trade Configuration Settings
Arguably the most crucial for users, these settings offer complete autonomy in defining trading strategies around converging chart patterns. This includes the flexibility to set entry, stop, and target prices, adjust risk-reward ratios, select the historical depth for back testing, and incorporate filters to steer trade direction.
🎯 Pattern Specific Settings
Here, users can personalize settings for individual patterns or groups, enhancing the specificity of their strategy. Apart from enabling/disabling individual patterns and pattern groups, users can also select pattern specific Last Pivot Direction, Trade Direction Filter and external filters for each pattern.
🎯 Fully Customizable Alerts
Implemented through the alert() function, these alerts bypass the standard template in the alert widget. To counteract this, we've introduced placeholders within the settings to craft detailed alert templates.
Available Categories Include
New - Alerts when a new pattern is identified
Entry - Alerts when an entry condition for configured pattern based trade is met.
Stop - Alerts when a trade that has reached entry gets stopped out without reaching target
Target - Alerts when a trade reaches its target
Invalidation - Alerts when a trade reaches invalidation point before reaching the entry.
Each alert types can have its own template. Customizable templates are very important in using alerts for broker or exchange integration.
Here are some of the placeholders that are defined in the indicator.
{type} - Alert type - new/entry/stop/target/invalid
{pid} - Pattern ID of the pattern belonging to trade. Multiple trades can have same pattern id since a pattern can be traded in both long and short directions.
{tid} - Unique Trade ID for the given trade.
{ticker} - Ticker ID on which the indicator is run
{timeframe} - Chart timeframe on which the indicator is run
{basecurrency} - Base currency of the symbol
{quotecurrency} - Quote currency of the symbol
{pivots} - Pivot values of the pattern
{price} - Current price when the alert is triggered.
{pattern} - Name of the pattern on which the alert is triggered.
{direction} - Direction of the trade.
{entrydirection} - Direction of the entry signal. Used for specific bot integration.
{exitdirection} - Direction of the exit signal. Used for specific bot integration.
{entry} - Entry price of the trade
{stop} - Stop price of the trade
{target} - Target price of the trade
{invalidation} - Invalidation price of the trade
🎯 Display and Stats
These settings are used to control the display options on the chart. Closed trade stats is displayed in a table and printed in the bottom left corner of the chart. This can be customized by using display settings.
Ücretli komut dosyası