[RS]ZigZag Percent Reversal - Helper - Draw Patterns - Part 3Helper script to draw patterns on chart.
H-pattern
[RS]ZigZag Percent Reversal - Helper - Draw Patterns - Part 2Helper script to display patterns on chart.

[RS]ZigZag Percent Reversal - Helper - Draw Patterns - Part 1Helper script to display patterns on chart.
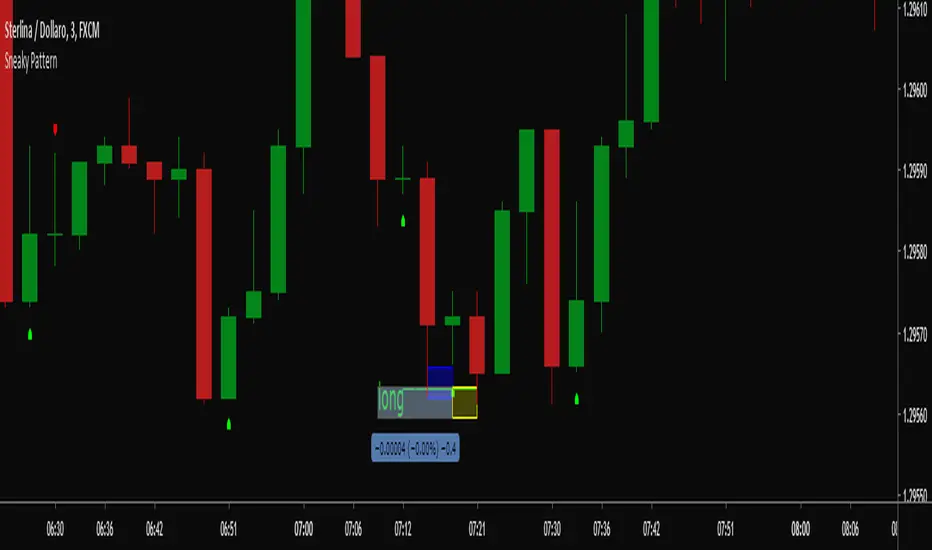
Sneaky PatternSneaky pattern to grab some point on low TF with minimum risk
USE ON LOW TF: 1M TO 10M
the way to use is described on picture below.
The blue are is the order area
Once you order is hit (in this case long position) you can locate you stop-loss sticky (in this case I used the blue area = yellow area price spread to set stop-loss)
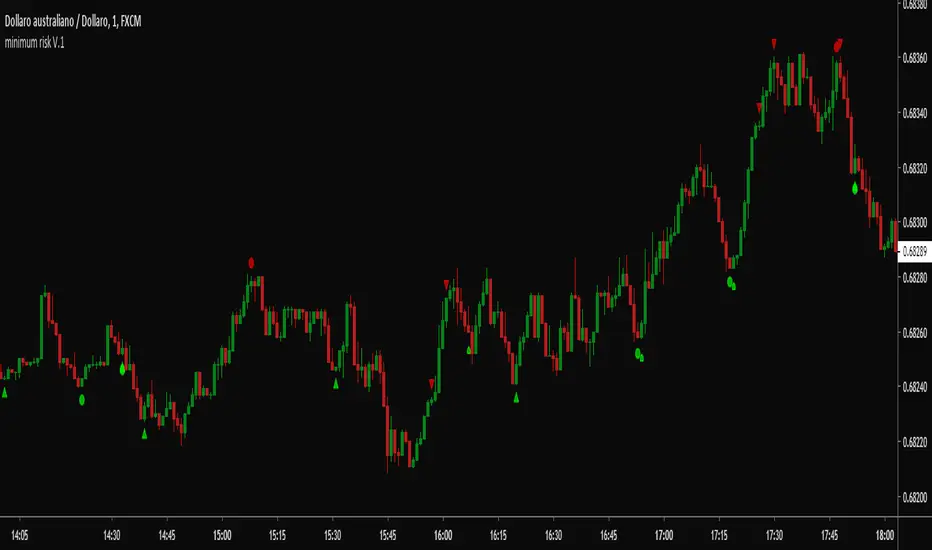
minimum risk V.1Was playing around and I've had this idea: most of day traders looking for catching price swings and sometimes they forgot about risk, so I was keeping focus not on price swings but on risk-momentum: the idea was to catch daily moments when the risk was minimum and this is the result.
There are some rules to use it correctly
1. Use it on lower timeframe (1M to 30M) best --> 1M to 5M
2. Do not open position on every signal !! keep focusing on the price
3. works better on Forex
upin and doin input: you can change it and you will see more signals but keep this inputs low as it is a filter I'm using for signals
I will update the indicator if I found new ideas
Enjoy!!

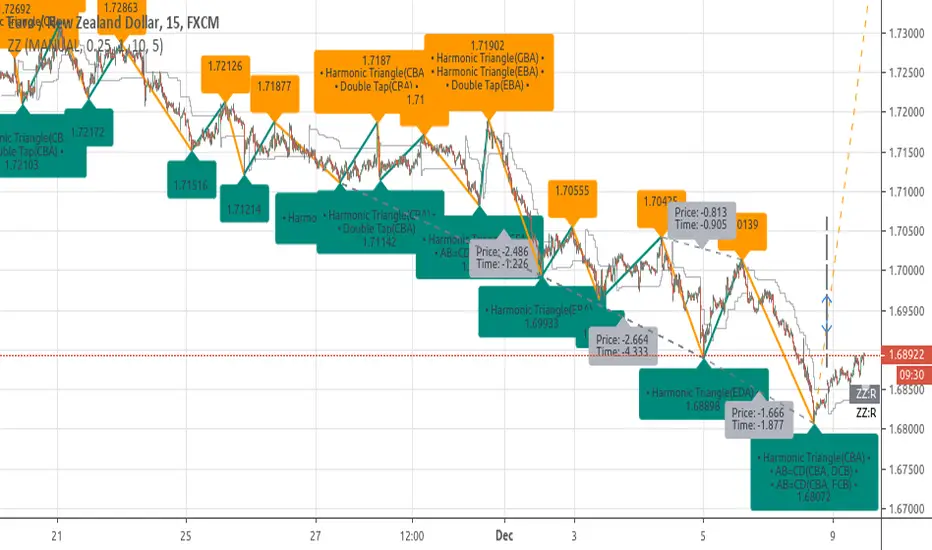
[RS]ZigZag Percent Reversal - Forecast - patterns - labels description:
• Zig Zag indicator plots points on the chart whenever prices reverse
by a percentage greater than a pre-chosen variable.
• Forecasts area based on zigzag statistics.
• Displays labels with detected patterns.
• Displays slope information rate of price, time diferentials and angle(experimental)

High Performance Candlestick Patterns//Candle Patterns Ranked by Performance THOMAS N. BULKOWSKI
//1. Bearish Three Line Strike +Up 67.38%
//2. Bullish Three Line Strike -Down 65.23%
//3. Bearish Three Black Crows -Down 59.83%
//4. Bearish Evening Star -Down 55.85%
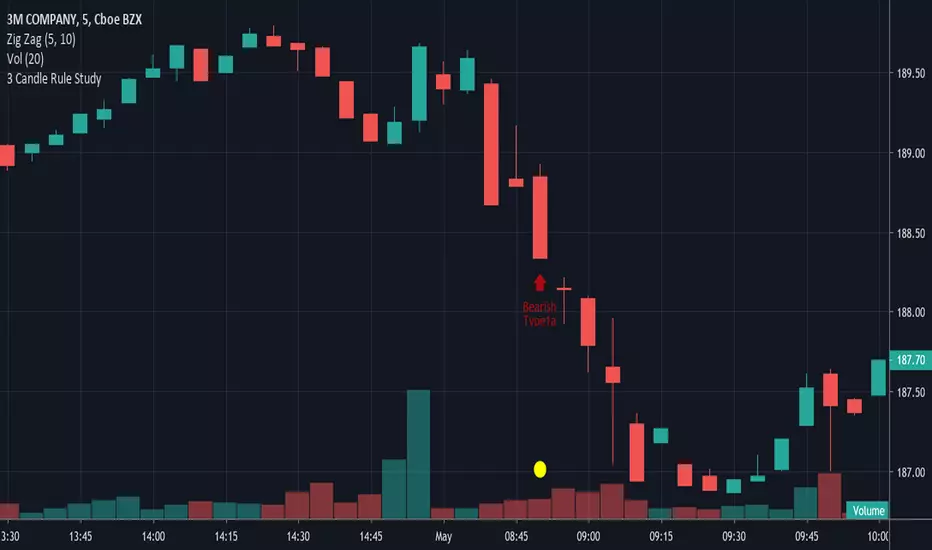
//5. Bullish Upside Tasuki Gap +Up 54.44%
//6. Bullish Inverted Hammer -Down 51.73%
//7. Bullish Matching Low -Down 50.00%
//8. Bullish Abandone Baby +Up 49.73%
//9. Bearish Two Black Gapping -Down 49.64%
//10. Brearish Breakaway -Down 49.24%
//11. Bullish Morning Star +Up 49.05%
//12. Bullish Piercing Line +Up 48.37%
//13. Bullish Stick Sandwich +Up 48.20%
//14. Bearish Thrusting Line During Dowtrend +Up 48.10%
//15. Bearish Meeting Line +Up 48.07%
//Down=Yellow Bar Color and Black Text
//Up=Blue Bar Color and Blue Text
//High Performance Candlestick Patterns Top 15

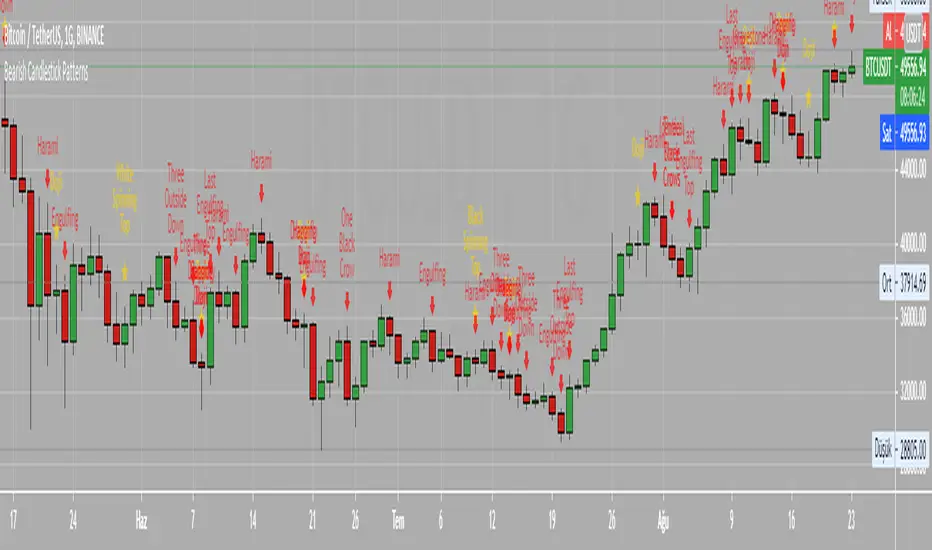
Bearish Candlestick PatternsDoji
Black Spinning Top
White Spinning Top
Bearish Abandoned Baby
Bearish Advance Block
Bearish Below The Stomach
Bearish Belt Hold
Bearish Breakaway
Bearish Counter Attack Lines
Bearish Dark Cloud Cover
Bearish Deliberation Blok
Bearish Descending Hawk
Bearish Doji Star
Bearish Downside Gap Three Methods
Bearish Downside Tasuki Gap
Bearish Dragonfly Doji
Bearish Engulfing
Bearish Evening Doji Star
Bearish Evening Star
Bearish Falling Three Methods
Bearish Falling Window
Bearish Gravestone Doji
Bearish Hanging Man
Bearish Harami
Bearish Harami Cross
Bearish Hook Reversal
Bearish Identical Three Crows
Bearish In Neck
Bearish Island Reversal
Bearish Kicking
Bearish Ladder Top
Bearish Last Engulfing Top
Bearish Low Price Gapping Play
Bearish Mat Hold
Bearish Matching High
Bearish Meeting Line
Bearish On Neck
Bearish One Black Crow
Bearish Separating Lines
Bearish Shooting Star
Bearish Side by side White Lines
Bearish Three Black Crows
Bearish Three Gap Up
Bearish Three Inside Down
Bearish Three Line Strike
Bearish Three Outside Down
Bearish Three Stars in the North
Bearish Thrusting Line During Dowtrend
Bearish Tower Top
Bearish Tristar
Bearish Tweezers Top
Bearish Two Black Gapping
Bearish Two Crows
Bearish Upside Gap Two Crows
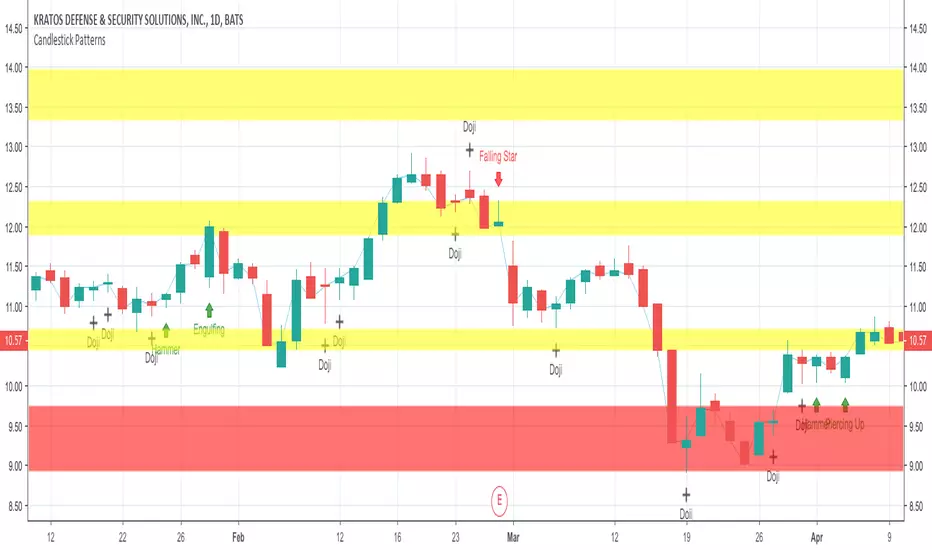
Advanced Candlestick Patterns [vitruvius]This is a very advanced indicator that detects most commonly used candlestick patterns. Please read this document carefully to understand how it works.
It is tailored to identify patterns that only have a great possibility of signaling a price movement. In other words, it can and will ignore some patterns, even though they satisfy the recognition conditions defined in the books. Candlestick patterns should also satisfy some other conditions in this indicator to be valid and you can modify those conditions.
This indicator is not only about identifying the candlestick patterns. By using the different choices, you can:
Avoid fake signals
Confirm patterns
Increase your possibility to win a trade
Reduce risk
Identify bullish/bearish movements better
Recommended Use
This indicator works best when you:
Use it in the daily time frame
Combine it with Support/Resistance areas
Note: For some candlestick patterns, you have the option of confirming the pattern with the next price action. In those cases, there will be obviously one bar delay (because it will wait for one more bar to close to confirm the pattern). However, it will mark the candlestick where it identifies the pattern and it will have ”Confirmed” in its text.
Important Note
This indicator does some serious calculations and checks for a lot of user inputs. Therefore, it might be a little slow. Please give it some time when it needs to do some computing.
MODULES
Trend Detection
Most of the patterns in this script are trend reversal patterns. So, recognition of the candlestick patterns depends heavily on the trend. In fact, even if you do not select a trend detection method, it will use the SMA method as default where it needs a certain trend in identifying a specific pattern.
It is possible to combine multiple trend detection methods. You can see how this affects the overall trend detection by enabling the background coloring.
Note: There might be some cases where a candle has a bullish/bearish confirmation of the same candlestick pattern . In those cases, the script is unable to identify the move and the user should decide if the identified pattern is bullish or bearish.
Below are the inputs of this module:
Color the background according to the trend?
If you select a trend detection method, it will color the background green for an uptrend and red for a downtrend .
Counter the trend when there is no obvious trend?
If you select multiple trend detection methods, there might be some cases where one of the methods indicates an uptrend and the other one indicates a downtrend . In that case, the script will continue with the previous trend (whatever the trend is one bar ago) by default . You can, however, reverse the trend in those cases by using this option. If you choose to reverse, you might catch the trend early .
Use MACD to detect the trend?
Use MACD to detect the trend. Whenever MACD delta is greater or equal to zero, it is an uptrend .
MACD Fast Length
Fast length of MACD.
MACD Slow Length
Slow length of MACD.
MACD Signal Smoothing
Signal smoothing value of MACD. Please note that it is set to 6 by default.
Use SMA to detect the trend?
Use SMA to detect the trend. If the price closes above the SMA line, it is an uptrend
SMA Length
Length of SMA.
Use the average price of previous candles to detect the trend?
If the average of open and close prices constantly go up for n bars that are determined by the next user input, it is an uptrend .
Number of candles to analyze
The number of bars ( n ) to analyze for the average price method.
Use the closing price of the previous candle to detect the trend?
If the difference between the current close and nth previous bar’s close is greater than the given threshold, it is an uptrend .
Position of the previous candle to analyze
Position of the bar (backward) to compare with the current close price.
Threshold for the closing price
The threshold value for closing price method.
Basic Candlestick Patterns
This module detects Doji, Spinning Top, Marubozu candlestick patterns. Also, you can set some specific options that are going to be used in all candlestick patterns.
Note: If you choose to manually enter the body height of a doji , you need to find the optimal value for different timeframes. Different timeframes have difference price action ranges.
Below are the inputs of this module:
Tolerate opening/closing price of the candle?
When a candlestick pattern needs to have a gap between two candles, you can tolerate the opening/closing prices of the one candle. This option is useful where the opening and closing prices are very close. This option is going to be used in all candlestick patterns.
Factor for tolerating opening/closing price
The more the factor is, the more the tolerance is.
Body/Height ratio for a candle to be considered as Bullish/Bearish
A bullish/bearish candle shouldn’t have too much shadow. You can use this option to determine the shadow length of a bullish/bearish bar. This option is going to be used in all candlestick patterns
Use basic candlestick pattern (Doji, Spinning Top, Marubozu)?
Detect doji, spinning top, marubozu candlestick patterns.
Manually set body of Doji?
You can manually set the body height of a doji. Otherwise, it will be calculated automatically. If you choose to use this option, then spinning top, and marubozu will also be calculated based on this.
Body of Doji
Body height of a bar to be considered as doji . Any bar with a body equal or less than the given value will be marked as doji. Only effective if you check the ”Manually set body of Doji?” option .
Verify a Doji by looking at the preceding candle?
If true, it will only mark dojis if the preceding candle is bullish or bearish.
Single Candlestick Patterns
This module detects Hammer, Hanging Man, Inverted Hammer, Shooting Star single candlestick patterns.
Below are the inputs of this module:
Confirm Single Candlestick Patterns with next closing price?
You can confirm a single candlestick pattern with the next closing price. That is, if the next candle closes above the previous one, it will confirm a bullish movement. If the next candle closes below the previous one, it will confirm a bearish movement.
Use Hammer and Hanging Man Single Candlestick Patterns?
Detect hammer and h anging man single candlestick patterns.
Use Inverted Hammer and Shooting Star Single Candlestick Patterns?
Detect inverted hammer and s hooting star single candlestick patterns.
Dual Candlestick Patterns
This module detects Engulfing, Tweezer Bottoms, Tweezer Tops, Harami, Inside Bar, Piercing Line, Dark Cloud Cover dual candlestick patterns.
Below are the inputs of this module:
Use Engulfing Dual Candlestick Pattern?
Detect engulfing dual candlestick pattern.
Validate Engulfing by comparing highs and lows?
If checked, the second bar must engulf the previous bar’s high/low also. If unchecked, the second bar should only engulf the real body of the first bar.
Use Tweezer Bottoms and Tops Dual Candlestick Patterns?
Detect tweezer bottoms and tweezer tops dual candlestick patterns.
Check the shadow equality of Tweezer Bottom and Tops?
Check if the shadows of the tweezer bars are about the same length.
Detect Harami Dual Candlestick Pattern?
Detect harami dual candlestick pattern.
Use High/Low of the second Harami candle instead of Open/Close price?
If checked, the body of the child must be within High and Low of the mother bar. Otherwise, only open/close prices will be checked.
Detect Inside Bar Dual Candlestick Pattern?
Detect inside bar dual candlestick pattern.
Treat Inside Bar as a reversal pattern?
If checked, inside bar will be treated as a bullish/bearish reversal pattern.
Check if the Inside bar formed in the upper/lower half of the Mother bar?
Check if the inside bar forms within the upper/lower body half of the mother. Then it will be treated as a bullish/bearish inside bar .
Detect the Inside Bar only if the previous candle closes outside of the Keltner channel?
This option effects identifying the inside bar . Such that, an inside bar will be detected only if the previous candle closes outside of Keltner Channel . Inside bars are effective when the market is extended and this is a nice way to check for that.
Confirm Inside Bar with the next close breaching the low/high of the inside bar?
Check if the next bar breaches inside bar’s high/low. Then it will be treated as a bullish/bearish inside bar .
Use Piercing Line and Dark Cloud Cover Dual Candlestick Patterns?
Detect Piercing Line and Dark Cloud Cover dual candlestick patterns.
Triple Candlestick Patterns
This module detects Morning Star , Evening Star, Three White Soldiers, Three Black Crows, Three Inside Up, Three Inside Down, Three Line Strike, Abandoned Baby, NR4, NR7 candlestick patterns.
Below are the inputs of this module:
Use Morning and Evening Star Triple Candlestick Pattern?
Detect morning and evening star triple candlestick patterns.
Don't allow the second candle's body to overlap with the first and third candle?
If checked, high and low of the second candle cannot overlap with the first and third candle for morning and evening star candlestick patterns.
The third candle must close beyond the midpoint of the first candle?
If checked, the third candle must close beyond the midpoint of the first candle for morning and evening star candlestick patterns.
Use Three White Soldiers and Three Black Crows Triple Candlestick Pattern?
Detect three white soldiers and three black crows triple candlestick pattern.
Compare bodies of Three White Soldiers and Three Black Crows candles?
You also have the possibility of comparing bodies of the candles in a way that every consecutive candle must have a bigger body than the previous candle.
Check if each candle (TWS&TBC) opens in the middle price range of the previous day?
You can check if each candle of three white soldiers and three black crows opens in the middle price range of the previous day.
Use Three Inside Up/Down Triple Candlestick Pattern?
Detect three inside up and three inside down triple candlestick pattern.
Check candles' bodies and closing prices for Three Inside Up/Down?
There are two different definitions for three inside up/down candlestick patterns. This option allows you to select one of those definitions. That is;
If unchecked , the second candle should make it up all the way to the midpoint of the first candle. Also, the third candle needs to close above the first candle’s high.
If checked , the second candle opens and closes within the real body of the first candle. Also, the third candle needs to close above the first candle's high.
Use Three Line Strike Candlestick Pattern?
Detect three line strike triple candlestick pattern.
Compare High/Lows instead of Open/Close for the Three Line Strike Pattern?
If checked, it will compare high/lows instead of open/close prices for the three line strike pattern.
Use Abandoned Baby Triple Candlestick Pattern?
Detect abandoned baby triple candlestick pattern. If you choose to tolerate opening and closing prices, high and low prices will also be tolerated for abandoned baby.
Use NR4 Candlestick Pattern?
Detect NR4 candlestick pattern.
Use NR7 Candlestick Pattern?
Detect NR7 candlestick pattern.
Confirm Narrow Range Candlestick Patterns with next closing price?
You can confirm NR4 and NR7 candlestick patterns with the next closing price. That way they will be identified as bullish or bearish patterns.
NOTES FROM THE AUTHOR
Please do not hesitate to contact me if you have any questions.
If you are not familiar with a specific candlestick pattern, try to google it. If you still need help, you can always contact me.
If you find a bug, or you think the indicator does not work as intended, please contact me with a screenshot of the chart. Also, please mention how you set up the user inputs.
If you have any ideas to further improve this indicator, please feel free to share it with me :)
LIKE , if you like it. SHARE if you think it would be useful for others too. FOLLOW for future updates and new indicators.

9 Seasons Rainbow Multiple Time Frames Pattern DEMO [9SRDEN]The indicator discovers profitable patterns by associating Price Season of multiple time frames.
Full Name: 9 Seasons Rainbow - Multiple Time Frames Associated Price Wave Pattern Indicator
This is redefined from “9 Seasons Rainbow Indicator DEMO”, with clearer definition of 9 Seasons and user manual.
Version: DEMO
Language: English
Copyright: 2019
---------- How to use the indicator ----------
Go through the manual and related ideas underneath or follow the tutorials list. Look through the profitable patterns and related cases, wait for or set alert for specific profitable pattern.
---------- Definition: 9 Seasons ----------
A life cycle of Price Wave is divided into 9 Seasons. Each time frame, from 5 minute to 1 month, has 9 seasons, Independent of each other:
Bull (Green)
Bull Pullback (Light Green): a pullback or retracement
Resistance / Overbought (Yellow): a resistance area, may become a Top, or be broken through.
Crazy Bought (Lime): Price is going up in a high volatility, could be a valid breakout, or a Bull Trap.
Neutral (White): a wandering season without direction, evolves into Bull or Bear
Bear (Red)
Bear Bounce (Light Red): Price bounces
Support / Oversold (Blue): a support area, may become a Bottom, or be broken through.
Crazy Sold (Fuchsia): Price is going down in a high volatility, could be a valid breakdown, or a Bear Trap.
---------- Some important evolution between seasons ----------
Resistance / Overbought (Yellow) -> Crazy Bought (Lime):
Bull is breaking through a resistance.
Crazy Bought (Lime) -> Resistance / Overbought (Yellow):
This normally indicates a failed breakout, Price goes back to the resistance.
Crazy Bought (Lime) -> Bull Pullback (Light Green):
This normally indicates Price has risen to a new level
Support / Oversold (Blue) -> Crazy Sold (Fuchsia):
Bear is breaking through a support.
Crazy Sold (Fuchsia) -> Support / Oversold (Blue):
This normally indicates a failed breakdown, Price recovers to the support.
Crazy Sold (Fuchsia) -> Bear Bounce (Light Red):
This normally indicates price has dropped to a new level
---------- Rainbow Ribbons for Multiple Time Frames ----------
Each ribbon of a rainbow represents a time frame.
The uppermost ribbon represents the shortest-term time frame - current time period of the chart, which is the time frame for trading.
The lowermost ribbon represent longest-term time frame, which work as environment, together with the other medium-term and long-term time frames.
The difference between two frames is 1.4142 fold (square root of 2), if level 1 is 15 minute, level 2 is 15 minute * (square root of 2) .
Examples of time frames in a rainbow:
For STANDARD in 15M: 15M - 21M - 30M - 42M - 60M(1H) - 85M - 120M(2H) - 170M
For PRO in 15M: 15M - 21M - 30M - 42M - 60M(1H) - 85M - 120M(2H) - 170M - 240M(4H) - 339M - 480M(8H) - 679M
---------- Trading Methods ----------
How to open a Long position?
When a profitable Long pattern appears, open small position first based on signal on shortest-term time frame; after retesting and confirming the support, open 2nd position; when it breaks through the resistance, pullbacks and confirms the breakout, open 3rd position.
How to exit a Long position?
Lift the Stop to a confirmed higher low, so that to take advantages of the bull run as possible.
How to open a Short position?
When a profitable Short pattern appears, open small position first based on signal on shortest-term time frame; after retesting and confirming the resistance, open 2nd position; when it breaks through the support, bounces and confirms the breakdown, add 3rd position.
How to exit a Short position?
Lower the Stop to a confirmed lower high, so that to take advantages of the bear run as possible.
---------- Versions Description ----------
The features may change later without advance notice.
PRO:
Invite-Only, with the following advanced features:
12 Ribbons Rainbow displays 9 Seasons of 12 time frames on a chart.
Advanced alert sets allows set alerts on short-term, medium-term, and long-term time frames.
Capability to input different trading instrument to compare with the current ticker.
Full time periods access allows apply it to broadest time periods, from 1 minute to 1 week (if history data is enough)
More new features in updates.
STANDARD:
Invite-Only, with the following advanced features:
8 Ribbons Rainbow displays 9 Seasons of 8 time frames on a chart.
Advanced alert sets allows set alerts on upper and lower frames.
Broad time periods access allows apply it to the most popular time periods, from 15 minute to 1 week (if history data is enough)
More new features in updates.
DEMO:
DEMO version is for trial purpose, having most of the features.
It is applicable to a list of trading instruments and specific time periods (1 hour to 1 day), which may change later without advance notice.
---------- Access to Indicators ----------
Please use DEMO version for Trial
Asking access to Invite-Only PRO and STANDARD versions:
9seasonsrainbowindicator.blogspot.com
Or contact the author.
---------- Install Invite Only: STANDARD & PRO Version----------
Ask access to STANDARD or PRO version
Open the chart -> Indicators (On the Top) -> Invite-Only Scripts (2nd button of the left bar)
Like/Favorite the indicator
Click to install on the chart
---------- About Loading Time ----------
It may take up to 2 minutes for your browser to load a new setting, depending on the your computer and network speed.
---------- List of the author's Indicators ----------
www.tradingview.com
---------- Disclaimer ----------
By using or requesting access to the indicator, you acknowledge that you have read and accepted that the indicator and any related content, including but not limited to: user manual, tutorials, ideas, videos, chats, emails, blog, are for the purpose of trading strategies studying and paper trading.
If a customer or user uses the indicator or related content mentioned above for live trading or investment, she/he should take all risks and be responsible for her/his own trading and investment activities.
---------- Updates ----------
The latest updates override the previous description.
To activate a update: Close the browser, Reopen the chart and apply the indicator.

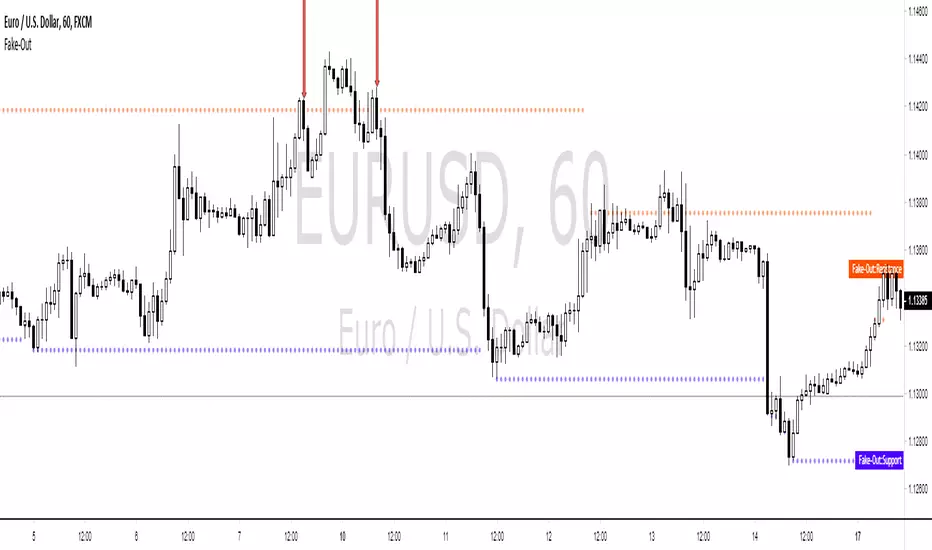
Fake-Out IndicatorThis indicator was built for a client. PM me for code access.
The signal comes from the "RailRoad" candlestick pattern breaking a support/resistance level, which typically indicates price will respect that level.
Double Top Pattern IdentifierHello friends,
This script is a powerful, non-repainting detector for the classic Double Top pattern — one of the most widely recognized bearish reversal setups. The indicator automatically identifies and tracks developing 'M'-shaped formations in real-time, confirming valid entries once the neckline is broken and providing complete trade management features. No manual configuration for detection is needed — it works out of the box.
🛠 How It Works
It uses advanced techniques that involve pivot points analysis and do not rely on other indicators, ensuring robustness and adaptability across different market conditions. When a potential Double Top is detected, the indicator marks the pattern points, draws the neckline, and waits for confirmation.
Once confirmed, it generates a 'Short' signal with calculated Take Profit (TP) and Stop Loss (SL) levels.
The script includes a statistics table summarizing performance metrics — such as number of patterns, trade results, bar distances, and top differences — all dynamically updated on your chart.
🔥 Key Features
Pine Script V6 — optimized logic and performance
Works out of the box — no manual configuration required
Non-repainting detection
Fully visualized structure — points, neckline, TP, and SL plotted automatically
Multiple TP/SL modes: R/R ratio, ATR-based, percent, points, pips, ticks, or top-to-neckline distance
Trailing Stop Loss support
Interactive statistics table with pattern count, trade outcomes, profit ratio, and structural measurements
Smart alert system
Customizable alert messages with placeholders (price, ticker, timeframe, etc.)
Clean, updated UI with improved layout and organization
If you'd like access or have any questions, feel free to reach out to me directly via DM.
👋 Good luck and happy trading!
Ücretli komut dosyası

Double Bottom Pattern IdentifierHello friends,
This script is a powerful, non-repainting detector for the classic Double Bottom pattern — one of the most widely recognized bullish reversal setups. The indicator automatically identifies and tracks developing 'W'-shaped formations in real time, confirming valid entries once the neckline is broken and providing complete trade management features. No manual configuration is needed — it works right out of the box.
🛠 How It Works
It uses advanced techniques involving pivot point analysis and does not rely on other indicators, ensuring robustness and adaptability across different market conditions. When a potential Double Bottom is detected, the indicator marks the pattern points, draws the neckline, and waits for confirmation.
Once confirmed, it generates a 'Long' signal with calculated Take Profit (TP) and Stop Loss (SL) levels.
The script also includes a statistics table summarizing performance metrics — such as the number of patterns, trade results, bar distances, and bottom differences — all dynamically updated on your chart.
🔥 Key Features
Pine Script V6 — optimized logic and performance
Works right out of the box — no setup required
Non-repainting detection
Fully visualized structure — points, neckline, TP, and SL plotted automatically
Multiple TP/SL modes: R/R ratio, ATR-based, percent, points, pips, ticks, or bottom-to-neckline distance
Trailing Stop Loss support
Interactive statistics table with pattern count, trade outcomes, profit ratio, and structural measurements
Smart alert system
Customizable alert messages with placeholders (price, ticker, timeframe, etc.)
Clean, updated UI with improved layout and organization
If you'd like access or have any questions, feel free to reach out to me directly via DM.
👋 Good luck and happy trading!
Ücretli komut dosyası

9 Seasons Rainbow Indicator DEMO [GO8686]Having good pattern recognition? Use this indicator to test and practice it.
Market is full of life, with seasons.
9 Seasons Rainbow Indicator displays 9 seasons of any trading instrument in multiple time frames, helping traders and investors understand the flow of price.
The combination of seasons in different time dimensions may give perfect trading signals, for instance: overbought in both small time frame and big time frame has high success probability of shorting trade.
Please install the indicator: Demo, PRO or STANDARD Version. Apply the indicator to your favorites trading instruments: indices, stocks, futures, forex or crypto currencies. Find your patterns that make money.
---------- 9 Seasons ----------
Bull(Green), evolves into BullRest, OverBought, Bear, or Neutral
Bull Rest(Light Green): a pullback or retracement, evolves into Bull or Bear
OverBought(Yellow): may have defined a top or resistance, can happen in range, evolves into CrazyBought or Bear
CrazyBought(Lime): going up in a high volatility, evolves into Bear, OverBought, or BullRest
Neutral(White): a wandering season without direction, evolves into Bull or Bear
Bear(Red), evolves into BearRest, OverSold, Bull or Neutral
Bear Rest(Light Red): a bounce, evolves into Bear or Bull
OverSold(Blue): may have defined a bottom or support, can happen in range, evolves into CrazySold or Bull
CrazySold(Fuchsia): going down in a high volatility, evolves into Bull, OverSold, or BearRest
---------- Some important evolutions of seasons ----------
OverBought -> CrazyBought: can happen with a breakout
CrazyBought -> OverBought or Bear: could mean fading of a breakout
CrazyBought -> BullRest: can happen after rising over a new level
OverSold -> CrazySold: can happen with a breakdown
CrazySold -> OverSold or Bear: could mean fading of a breakdown
CrazySold -> BearRest: can happen after dropping to a new level
---------- Rainbow Ribbons for multiple time frames ----------
Each ribbon of the rainbow represents a time frame,
The difference between two frames is 1.4142 fold (square root of 2), if level 1 is 15 M, level 2 is 15 * (square root of 2) M. level 3 is 15*2 M, level 4 is 30 * (square root of 2) M, level 5 is 30 * 2 m etc.
The uppermost ribbon represents the smallest time frame - current time period of the chart.
The lower ribbons represent bigger time frames, which work as context.
Examples for time frame rainbow:
For DEMO in 30M: 30M - 42M - 60M(1H) - 85M - 120M(2H) - 170M - 240M(4H) - 339M
For STANDARD in 15M: 15M - 21M - 30M - 42M - 60M(1H) - 85M - 120M(2H) - 170M
For PRO in 15M: 15M - 21M - 30M - 42M - 60M(1H) - 85M - 120M(2H) - 170M - 240M(4H) - 339M - 480M(8H) - 679M
---------- Versions Description ----------
The features may change later, please refer to latest update.
DEMO:
This is DEMO of Standard version for trial purpose, having most the functions except alert preset conditions.
It is applicable to a list of trading instruments and specific time periods(30m-1D), which may change later. please refer to latest updates.
---List of tickers applicable for Demo version.
Currency Index:AXY,BXY,CXY,DXY,EXY,JXY,SXY,ZXY,
Stock Index:SPX,TSX,DAX,NI225,KOSPI,399001,SHCOMP,HSI,XJO,TAIEX,SX5E,
Crypto:BTCUSD
Commodity:BCOUSD,GOLD
STANDARD:
STANDARD version of 9 Seasons Rainbow Indicator is invite-only, with the following advanced features:
8 Ribbon Rainbow lets you discover trading opportunities hidden in the 1.4142 fold time dimension while monitoring market conditions spanning 11 times.
Advanced alert sets allows you set alerts for Overbought, Crazybought, OverSold, CrazySold on upper and lower time frames.
Broad time periods access allows you to watch the market on popular time dimensions from 15M - 1D,2D,3D,4D,5D,6D,1W.
More new features in updates.
PRO:
PRO version of 9 Seasons Rainbow Indicator is invite-only, with the following advanced features:
12 Ribbon Rainbow lets you discover trading opportunities hidden in the 1.4142 fold time dimension while monitoring market conditions spanning 45 times.
Advanced alert sets allows you set alerts for Overbought, Crazybought, OverSold, CrazySold on low, medium, and high time frames.
Option to input different trading instrument to compare with the current ticker.
Full time periods access allows you to watch the market on broadest time dimensions.
More new features in updates.
---------- Access to Indicators ----------
Please contact the author for access to PRO or Standard versions.
---------- About Loading Time ----------
It may take up to 2 minutes for your browser to load a new setting, depending on the your computer and network speed.
---------- List of the author's Indicators ----------
www.tradingview.com
---------- Disclaim ----------
By using or requesting access to this indicator, you acknowledge that you have read and accepted that this indicator is for study purposes only and it does NOT guarantee you will make money.
I am not financial adviser and I am NOT responsible for any profits or losses you may incur by using this indicator!
Users should make their own decisions, carefully assess risks and be responsible for investment and trading activities.
The latest updates override the previous description. Please check the updates.
9季彩虹指标 演示版
具备优秀的模式识别能力吗? 9季彩虹指标检验,提升您的模式识别能力。
市场充满生机。
9季彩虹指标在多个时间维度上显示任何交易品种的9个季节交替,帮助交易者和投资者了解价格流动。
不同时间维度的季节组合可以给出完美的交易信号,例如:在小时间框架和大时间框架上同时出现超买具有很高的卖空交易成功概率。
请安装指标:Demo,STANDARD 或者 PRO 版本. 应用指标到您的交易品种:证券,期货,外汇或者加密货币。找到属于您的盈利模式。
---------- 季节的定义 ----------
牛(绿色),可以演变到牛市回调,超买,熊 或者 中性
牛市回调(淡绿色):可以演变到牛或者熊
超买(黄色),可能刚刚定义了一个头部或者阻力区,可以发生在盘整期,可以演变到狂买或者熊
狂买(亮绿色):高波动性上涨,可以演变到熊,超买或者牛市回调
中性(白色): 没有方向的徘徊期,可以演变到牛或者熊
熊(红色),可以演变到熊市反弹,超卖,牛 或者 中性
熊市反弹(淡红色),可以演变到熊或者牛
超卖(蓝色),可能刚刚定义了一个底部或者支撑,可以发生在盘整期,可以演变到狂卖或者牛
狂卖(紫红色),高波动性下跌,可以演变到牛,超卖 或者熊市反弹
一些重要的季节交替
超买 -> 狂买:可能发生在向上突破时
狂买 -> 熊 或者 超买:可能发生在突破失败时
狂买 -> 牛市回调: 可能发生在上平台后
超卖 -> 狂卖:可能发生在向下突破时
狂卖 -> 牛 或者 超卖:可能发生在突破失败时
狂卖 -> 熊市回调: 可能发生在下平台后
---------- 色带彩虹所代表的时间维度 ----------
每条色带代表一个时间维度。
色带间隔1.4142倍(2的开方),如果第一维度是15分钟,第二维度是15*1.4142=21分钟,第三维度是15*2=30分钟,以此类推。
最上面的色带代表最小的时间维度,也就是目前图表的时间维度
最下面的色带代表最大的时间维度。
例子:
演示版: 30m-42m-60m(1H)-85m-120m(2H)-170m-240m(4H)-339m
标准版: 15m-21m-30m-42m-60m(1H)-85m-120m(2H)-170m
专业版: 15m-21m-30m-42m-60m(1H)-85m-120m(2H)-170m-240m(4H)-339m-480m(8H)-679m
---------- 不同版本功能描述 ----------
这些特征及功能可能会发生变化,以更新为准。
--演示版DEMO
演示版用于标准版的演示和试用,适用于特定的资产列表和时间维度(30M-1D),后续可能调整.
适用的品种列表
AXY,BXY,CXY,DXY,EXY,JXY,SXY,ZXY,
SPX,TSX,DAX,NI225,KOSPI,399001,SHCOMP,HSI,XJO,TAIEX,SX5E,
BTCUSD,BCOUSD,GOLD
---标准版STANDARD特征
8色带彩虹让您发现隐藏在1.4142时间维度的交易机会,同时监控时间跨度达十一倍的市场状态
高级警报功能:允许您在低,高时间层级上设置超买,狂买,超卖,狂卖的警报。
宽时间维度(15分钟到日线级别)让您从更宽阔的视角观察市场
更新中的更多新功能。
---专业版PRO高级特征
12色带彩虹让您发现隐藏在1.4142时间维度的交易机会,同时监控时间跨度达四十五倍的市场状态
高级警报功能:允许您在低,中,高时间帧上设置超买,狂买,超卖,狂卖的警报。
可以输入不同的交易品种用于指标,便于与当前交易品种进行比较。
全时间维度(分钟到日线级别)给您全视角观察市场
更新中的更多新功能。
---------- 获得使用权 ----------
联系指标开发者以取得标准版和专业版的使用权
---------- 开发者的指标列表 ----------
www.tradingview.com
---------- 加载时间 ----------
可能需要2分钟,取决于网络和电脑配置。
---------- 免责声明 ----------
在要求获得本指标使用权之前以及在使用本指标之前,用户认可已经完全了解和接受:本指标仅供教育和研究目的, 它不提供任何赢利的可能性。
本指标的开发者并非专业投资顾问,因此不对用户的任何赢亏负责。
用户应独立判断,审慎评估并自负投资和交易风险!
最近的更新会覆盖之前的说明。 请参阅更新来查看指标的新特征和功能。

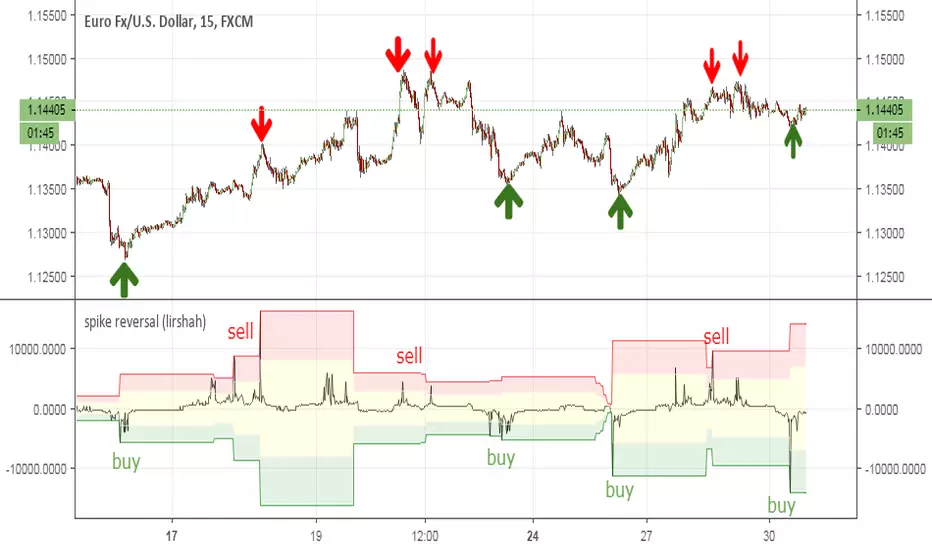
spike reversal (lirshah)spike reversal indicator is an innovation of lirshah programming team,
this indicator is combination of several indicators with candle sticks patterns.
good accuracy on reverse points and ease of interpretation are strong points of this indicator.
calculation of this indicator is based on opening price of each bar which means the value of indicator is constant on each candle and no repaints occur.
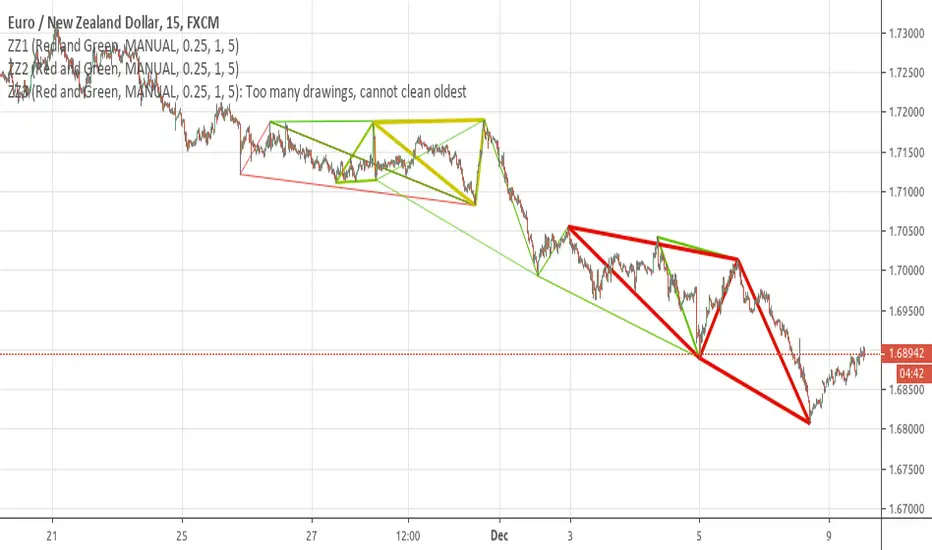
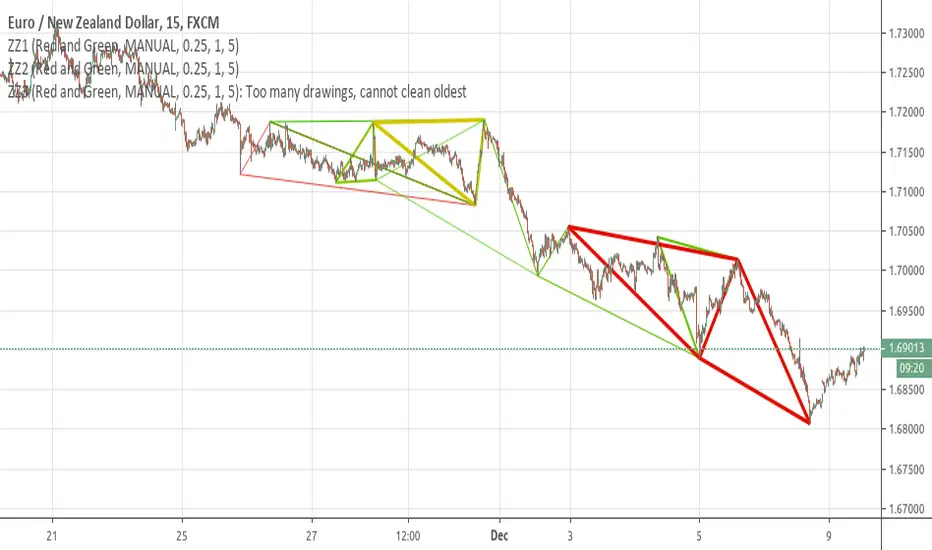
trend lines (lirshah)triangle pattern created for our subscribers for better indication of chart patterns.
i hope enjoy that.

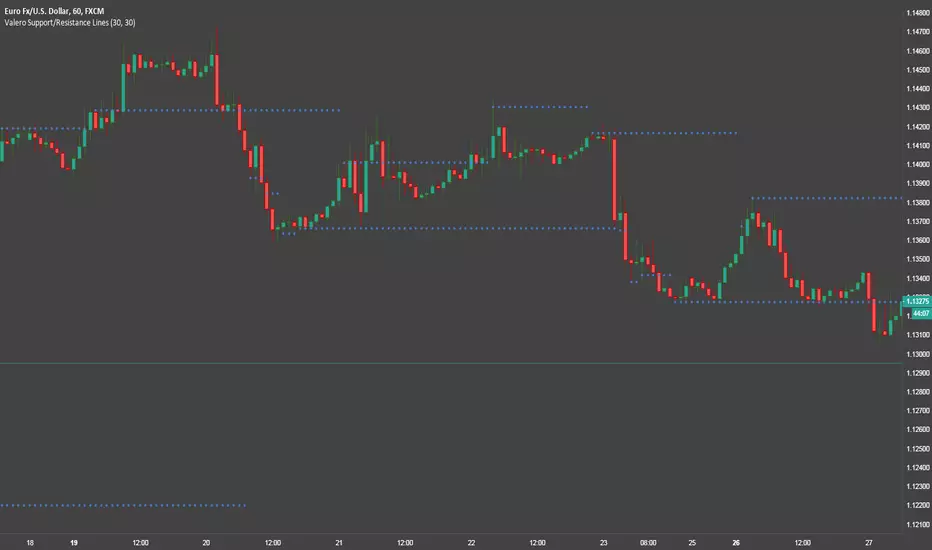
Valero Support/Resistance LinesThis is a pretty simple indicator that automatically draws Support and Resistance lines.