Hopiplaka Twin Tower Levels (Variable Multiplier) [NZA 333]Purpose
Instrument scope: This indicator is for exchange-traded futures only (e.g., CME/ICE). It assumes a regular session with a 16:00 daily fix; use on spot FX, equities/ETFs, CFDs, or crypto is not supported and may produce incorrect windows/levels.
This tool draws structured possible support/resistance price-level frameworks anchored to a daily “Fix” at 16:00 and lets you study intraday expansion/mean-reversion from that anchor. It overlays three families of levels:
CB - Circuit-Breaker style bands: symmetric bands at ±X% of the Fix (user-defined), plus intermediate percentages (14/26/40/50/60/74/86) and three highlighted “impulse” bands.
GB – “Goldbach-type” ratios: fixed ratios applied to a user-selected PO3 dealing range (e.g., 729, 2187, 6561 points). This produces low/eq/high rails and intermediate harmonics, including extended rails at −0.111 and 1.111.
STDV – “Stop-Run” ladders: equidistant steps (user step size) centered on the Fix and bounded by ±PO3/2.
All drawings are time-boxed windows that run from one 16:00 to the next 16:00 so you can compare today vs. prior sessions at a glance, including weekends/market closures.
How it works (high level)
Session windows (16:00→16:00)
For non-crypto symbols, each “day” is a window starting at 16:00 in the user-chosen timezone (default: America/New_York) and ending at the next day’s 15:59. When a new 16:00 occurs, the script immediately rolls the windows forward so Day-0, Day-1, Day-2, Day-3 always reference the latest four 16:00 anchors, even across weekends.
Fix source (per day)
Each day can use one of:
O/C: the open price of the 16:00 bar (acts as an official fix for that session).
VWAP: the VWAP value on the 15:59:30 (last 30 seconds bar before 16:00). You need Trading View Premium to use this source.
Manual: user-entered value. You can visit CME Group's website to see the published fix prices for your chart and enter it manually.
For a current session you want to use the previous session fix price until 4 pm (New York).
Market type handling
Crypto: by default the Fix is 16:00 Europe/London (configurable). Crypto session handling remains continuous; the script keeps the crypto branch behavior separate so nothing changes for 24/7 markets.
Non-crypto: uses the selected timezone (default NY). The script explicitly handles weekends/holidays so Day-0 can be Fri→Mon and Day-1 Thu→Fri, etc.
Ratios & math
Circuit Breakers bands: Fix ± (Fix * percent / 100), with extra mid-points (“CE levels”) and the intermediate percentages listed above.
Goldbach ratios: a fixed array of ratios mapped onto the PO3 distance; on Forex, PO3 is automatically converted to price units using syminfo.mintick.
STDV steps: Fix ± n * step, drawn only within ±PO3/2.
Rendering model
Lines are created with xloc = xloc.bar_time between the window’s start/end timestamps. A housekeeping buffer deletes/redraws on the last bar to keep charts responsive when you toggle features. A compact table shows, per day window, the session label, Fix (and its source), and the active options (CB%, PO3, STDV).
Update behavior
As soon as the 16:00 1-minute bar closes, the Fix for Day-0 updates and older windows roll forward. Historical windows (Day-1/2/3) also move forward afterward, since their Fix times are already stored. On higher timeframes, the script relies on the captured 1-minute Fix so Day-0 levels appear intrabar even if the higher-TF candle hasn’t closed yet.
How to use it
I - Choose the Fix source per day (Manual / VWAP / O/C).
II- Choose levels to show on each day, via toggles:
- Mode 1: Toggle "Show Goldbach Levels" and/or "NG Levels" / "CE Levels" (extra ratio sets) to show these levels for the day. Choose PO3 DR (Dealing Range), note the fix price acts as Equilibrium.
- Mode 2: Toggle "Show Stop Run Levels" to show PO3 distance in handles from Fix Price. Choose a PO3 number from the "STDV" option, this will be your max distance in handles (think Dealing Range).
- Mode 3: Toggle "Show Circuit Breaker Levels" to show ratios derived from the CME Group's official price limits percents from the fix price for a day (7%, 13% or 20%) * 2.
Each mode's toggles are in the same line, one line per mode. Usually you just need one of the 3 modes.
III - Use Day shift to scroll the four windows through past sessions (0 by default).
IV - Use Hour shift to visually nudge the drawings on the time axis without changing calculations.
Timezone: for non-crypto, select America/New_York, Europe/London or UTC for the 16:00 anchor. Crypto can auto-use London 16:00.
Notes & limitations
The tool does not generate buy/sell signals; it’s a visual framework for contextual levels.
O/C fixes (Default) are captured from the 1-minute series at exactly 16:00; if a symbol lacks 1-minute history at that time (rare), a day window may show as missing or could take the fix price incorrectly.
VWAP fixes are captured from the 30-seconds series at exactly 16:00; if a symbol lacks 30 seconds history at that time, a day window may show as missing.
Historical windows are fixed once their 16:00 bar has closed; Day-0 updates only at the moment a new 16:00 occurs.
Be mindful of symbol tick size/PO3 scale on Forex vs. indices/futures.
This indicator does not predict future values and does not access future data beyond the last completed 16:00 bar. See TradingView’s guidance on realistic claims and use of request.security.
(Educational use only. Trading involves risk; past behavior of levels relative to price does not guarantee future outcomes.)
Goldbach
Riz Goldbach FrameworkRiz Goldbach Framework maps a dynamic dealing range and a set of Goldbach-derived price levels to structure intraday decision-making. It blends range math (PO3), level clustering, session weighting, volume/volatility context, and an explainable scoring engine that can issue BUY/SELL signals with risk levels (SL/TP). It is designed for discretionary traders who want rules-based context rather than a black box.
Core concepts (how it works)
1) PO3 Dealing-Range Engine
⦁ The script builds a tri-based PO3 range around current price (Auto or Manual).
⦁ It shifts the range when price “accepts” outside (close/wick—user selectable) and adapts width with ATR so the range expands in high volatility and tightens in low volatility.
⦁ From this range it computes mid, premium/discount halves, and sub-mids.
2) Goldbach Levels (structure map)
Within the active PO3 range, fixed percentages anchor recurring behaviors:
⦁ Rejection edges: 3%, 97%
⦁ Order-block tendency: 11%, 89%
⦁ FVG tendency: 17%, 83%
⦁ Liquidity void / expansion: 29%, 71%
⦁ Breaker band: 41%, 59%
⦁ Mitigation band: 47%, 53%
⦁ Equilibrium: 50%
⦁ Touch/near logic is tolerance-based (body-only optional). The script also counts confluence clusters (2=moderate, 3+=strong) near price.
3) Market elements the script tracks
⦁ Order Blocks (OB): detected after BOS behavior when price is sitting on OB-biased GB levels (11/89).
⦁ FVG: 3-bar gaps at FVG-biased levels (17/83) with optional “% fill” confirmation.
⦁ LV bars: wide-range, high-range bars around 29/71 for displacement/voids.
⦁ Equal Highs/Lows (EQH/EQL): tolerance with labeling for sweep risk.
⦁ Circuit Breaker (CB): zone seeded at 41/59. States: intact → broken → retest → revalidated/failed. A shaded band shows the active breaker zone.
⦁ Twin Towers (TT): equal-high/equal-low doublet with spacing/volume/RSI checks, then sweep-and-return into the breaker zone for confirmation.
4) Context & filters
⦁ Trend vs Range: DMI/ADX + EMA stack infer TREND/RANGE/TRANSITION and scale the required score.
⦁ MTF alignment: compares current PO3 halves vs HTF PO3 halves (user timeframe), rewarding alignment and flagging divergence.
⦁ Fib–Goldbach confluence: checks 61.8/38.2/78.6/127.2/161.8 against key GB levels for added weight.
⦁ Session weighting: Asia/London/NY bias different GB levels; weights are higher for London/NY.
⦁ Volume-weighted liquidity: tracks volume at EQH/EQL to flag “high-commitment” sweeps.
⦁ AMD cycle (smart): accumulation/manipulation/distribution estimated from ATR regimes, sweeps, BOS continuation, divergence and PO3 shifts.
⦁ Optional filters: HTF bias, SMT divergence via a second symbol, VSA volume emphasis, news blackout session.
5) Signal engine
⦁ Modes: MMxM, Trending, or Hybrid (auto switches depending on CB acceptance + ATR expansion).
⦁ A score (0–100) aggregates weighted conditions (GB touch/confluence, AMD alignment, CB state, TT, FVG/OB interaction, HTF bias, SMT, high-volume, RSI momentum).
⦁ Adaptive threshold raises/lowers requirements in TREND vs RANGE.
⦁ Outputs: BUY/SELL label with strength (WEAK/NORMAL/STRONG), a reasons string (e.g., GB+AMD+Breaker+TT+FVG+HTF+RSI), and risk levels:
⦁ SL: rejection/structure anchored (e.g., GB3/GB97 or recent swing ± ATR).
⦁ TP1: opposite breaker (41/59).
⦁ TP2: opposite FVG tendency (17/83).
⦁ Live RR displayed on label and plotted as dashed lines.
⦁ Cooldown, session/time, weekend, and volatility gates suppress poor-quality or clustered signals.
What you see on the chart
⦁ PO3 bands: High/Low/Mid lines plus background shading for Premium (bear tint), Discount (bull tint), Equilibrium (neutral).
⦁ Goldbach lines: Major structure (0/50/100) plus the functional GB set (11/17/29/41/47/53/59/71/83/89/3/97).
⦁ Blocks & gaps: OB lines, FVG boxes (extend right, fill progress), LV box, breaker zone band, and TT logic states.
⦁ CE/MT: Central equilibrium (~3.5%/96.5%) and mid-towers (25%/75%) trigger optional alerts.
⦁ Session overlays: Asia/London/NY (optional).
⦁ Opens: Daily/Weekly (optional).
⦁ Dashboard: PO3 value, Zone (Premium/Discount/Equilibrium), AMD phase, Session, Mode (MMxM/Trending/Hybrid), CB state, nearest GB tag, Market context (TREND/RANGE/TRANS), recent Events, and rolling win-rate tallies (signals/CB/TT) from the current chart session.
How to use it (workflow)
1. Pick a preset
⦁ Minimal: only core structure.
⦁ Standard: levels + dashboard.
⦁ Full: adds sessions + GBT window overlays.
2. Choose range logic
⦁ PO3 Auto is reactive and scales with ATR.
⦁ Manual PO3 is for precise range control.
3. Scope your bias
⦁ Confirm Zone (Premium/Discount), CB state, and AMD phase; check MTF row if enabled.
⦁ Strong setups usually appear when session-weighted GB levels + confluence ≥ 2 + CB revalidated + AMD = manipulation → distribution (short) or accumulation → manipulation (long).
4. Act on signals (optional)
⦁ When a label prints, read the factors string and score.
⦁ Use plotted SL/TP1/TP2 lines and RR.
⦁ Respect cooldown, news blackout, and volatility filter.
Inputs you might tweak
⦁ PO3: Auto/Manual, acceptance by Close vs Wick, adaptive widening/tightening.
⦁ Levels: Major-only vs All; tolerance %; wick vs body touches.
⦁ Signals: Mode, score threshold, cooldown, confirm on close.
⦁ CB/TT: breaker width %, spacing window & tolerance, suppress bars after TT.
⦁ Filters: HTF timeframe, SMT symbol, VSA on/off, news blackout session.
⦁ Visuals: colors, line opacity, label sizes, dashboard position/size.
⦁ FVG/LV/CE/MT: fill %, and per-event alerts.
Alerts available
⦁ BUY/SELL signal, PO3 shift, GB touch (with tag), CB broken/retest pass/fail, TT setup/confirmed, OB tagged, FVG formed/filled, LV expansion, CE/MT touches.
Limitations & notes
⦁ Signals are contextual—they depend on the active PO3, tolerance, filters, session weighting, and volatility regime.
⦁ HTF requests depend on broker/exchange data and the timeframe you assign; if HTF is empty or illiquid, features degrade gracefully but may be less informative.
⦁ Win-rate tallies are session-local (not a historical performance guarantee).
⦁ Parameter choices (e.g., tolerance, breaker width, thresholds) materially change behavior.
Disclaimer
This tool is for educational/informational purposes only. It does not constitute financial advice, an invitation to trade, or performance assurance. Markets involve risk—always test on replay/paper and manage risk independently.

Hopiplaka Goldbach System with SignalsThis tool builds a dynamic price framework around the current market using a PO3 range and a set of mathematically derived Goldbach levels. It then scores nearby levels for quality (reliability) and produces Buy/Sell signals only when multiple, independent factors line up (price level quality, trend/“Tesla Vortex” state, ICT AMD phase, time confluence, volume bias, and momentum). The goal is to identify high-confluence inflection points rather than constant signals.
Core Concepts & Why They’re Combined
1. PO3 Range Framework
Price is segmented into a primary range (lower → upper) determined by a configurable size (3× ladder: 3, 9, 27, …, 2187).
⦁ If price sits near a boundary (configurable sensitivity), the range can auto-expand to the next 3× size to better fit current volatility.
⦁ This gives a stable “map” of the active trading area and its boundaries.
2. Goldbach Levels (Pure Hopiplaka implementation)
For each even number ≤ your precision limit, the script evaluates all prime-sum partitions (Goldbach partitions) and converts their prime ratios into price levels inside the PO3 range.
⦁ Levels are classified as Premium / Standard / Discount based on properties of the prime pair and a mathematical weighting.
⦁ Strict minimum spacing rules (exact %, OB %, liquidity-void %) prevent clutter and keep only the most meaningful levels.
3. Tesla Vortex (trend/phase strength)
A volatility/trend-aware state machine estimates whether market is in MMxM (accumulation/mean-revert like) or TREND conditions and maps price interaction with high-quality levels to phases (e.g., Order Block Formation, Distribution).
⦁ This helps filter signals: buys favored in MMxM near supportive levels; sells favored in TREND near premium/liquidity levels, etc.
4. ICT Integration (AMD, IPDA bias hooks)
A lightweight AMD phase detector classifies the recent window into Accumulation / Manipulation / Distribution and marks market structure bias. This is used as confluence with level quality and trend state.
5. Time Confluence (Goldbach time)
Swing highs/lows are checked against Goldbach-valid timestamps (based on hour+minute sums decomposable into prime pairs). Repeated alignment adds time-bias confidence. When price and time align, level reliability is boosted.
6. Volume & Liquidity Context
A rolling volume baseline marks High/Low Volume Bias; levels can be volume-weighted (raising or lowering their reliability). Proximity to PO3 extremes flags pending liquidity sweeps.
Why this mashup?
The system blends price geometry (PO3 + Goldbach), state/trend (Tesla Vortex), market-microstructure (ICT AMD), time confluence, and volume/liquidity into one numerically scored signal. Each component answers a different question; together they reduce false positives and favor high-quality trades near meaningful levels.
What You’ll See on the Chart
⦁ PO3 Range Boundaries: two dashed lines (“lower” and “upper”). Auto-expand darkens the boundary style slightly.
⦁ Goldbach Levels: horizontal lines colored by classification and context:
⦁ Premium (strong premium band), Standard, Discount
⦁ OB (Order-Block candidate), LV (Liquidity Void)
⦁ TESLA node (trend/phase aligned)
⦁ Heavier width = higher reliability; dashed/dotted styles encode class differences.
⦁ PO3 Liquidity Boxes: narrow yellow shaded bands above/below each level (configurable pip distance).
⦁ Markers
⦁ ▲ Buy arrow below bar when a Buy signal triggers
⦁ ▼ Sell arrow above bar when a Sell signal triggers
⦁ ● Small dot when price touches a Goldbach level
⦁ Data-window plots:
⦁ Tesla Vortex Strength (numeric)
⦁ Time Bias (positive = bullish, negative = bearish)
⦁ Volume Bias (+1 high / −1 low)
⦁ Signal Strength (+ for buy / − for sell, zero when no signal)
⦁ Label Legend (on level tags)
⦁ TESLA – Tesla-aligned level node
⦁ OB – Order-block-quality zone
⦁ LV – Liquidity-void zone
⦁ Premium / Standard / Discount – Level class
⦁ Gxx – Even number used to build the level (Goldbach reference)
⦁ Reliability – Final score after time/volume/tesla weighting
⦁ Optional extras: Vol (relative volume weight), Time (time-confluence strength)
How Signals Are Generated
A signal is proposed when price comes within a minimum distance of a high-reliability level. It is then accepted only if enough of these independent checks pass (you control the required count):
1. Tesla Vortex state matches direction (e.g., MMxM with buy; TREND with sell).
2. ICT AMD phase aligns (Accumulation → buy bias; Distribution → sell bias).
3. Goldbach time bias supports the direction.
4. Volume bias supportive (high-volume context boosts conviction).
5. Level quality (TESLA node or Premium class) is high.
6. Momentum alignment (recent 2–3 bars in the same direction).
Only when confluence ≥ your threshold and confidence ≥ 0.5 (scaled by sensitivity) will a Buy/Sell arrow print. Cooldown prevents rapid repeats.
Inputs (key ones)
⦁ PO3 Settings: range size, auto-expansion toggle, expansion sensitivity, liquidity band distance.
⦁ Goldbach Mathematics: precision limit, exact spacing rules, spacing for OB/LV classes.
⦁ Trading Signals: master toggle, sensitivity, min reliability, confluence required, cooldown, min distance to level, markers on/off.
⦁ Tesla Vortex / ICT: enable Vortex, sensitivity; enable AMD/IPDA analysis and lookback.
⦁ Time & Volume: enable Goldbach time and weighting; volume lookback; liquidity-pool detection.
⦁ Display: show historical/future projections, number of future bars, labels, path/phase overlays.
⦁ Colors: full palette per class/context (premium/discount/OB/LV/Tesla/time/volume, buy/sell/goldbach hit).
Alerts Included
⦁ Signals: “BUY Signal Generated”, “SELL Signal Generated”
⦁ Level Interactions: “Goldbach Level Hit”; “Near Goldbach Level”; “Tesla Vortex Node”; “Premium Level Alert”
⦁ PO3: “PO3 Upper Break”, “PO3 Lower Break”, “PO3 Range Expansion”
⦁ State Changes: “Tesla Vortex Phase Change”
⦁ Context: “Liquidity Sweep Imminent”, “Strong Time Confluence”
You can wire these to webhooks or notifications.
Suggested Workflow
1. Choose PO3 size that matches your instrument’s volatility; keep Auto-Expansion ON initially.
2. Set confluence threshold (start at 3–4) and cooldown (e.g., 10 bars).
3. Keep Time and Volume modules ON for additional reliability weighting.
4. Use arrows as filters, not blind entries—confirm with your execution plan and risk rules.
5. Prefer signals near Premium/Discount TESLA nodes that also show time confluence and supportive volume.
Practical Notes & Limitations
⦁ The mathematical framework is deterministic, but market execution is not—always manage risk.
⦁ Future projections and heavy labeling can be resource-intensive; tune visibility if performance drops.
⦁ If a market is extremely illiquid or gap-prone, spacing/filters may hide many levels (by design).
Disclaimer
This script is for educational and research purposes only and is not financial advice. Trading involves risk. You are responsible for your own decisions.

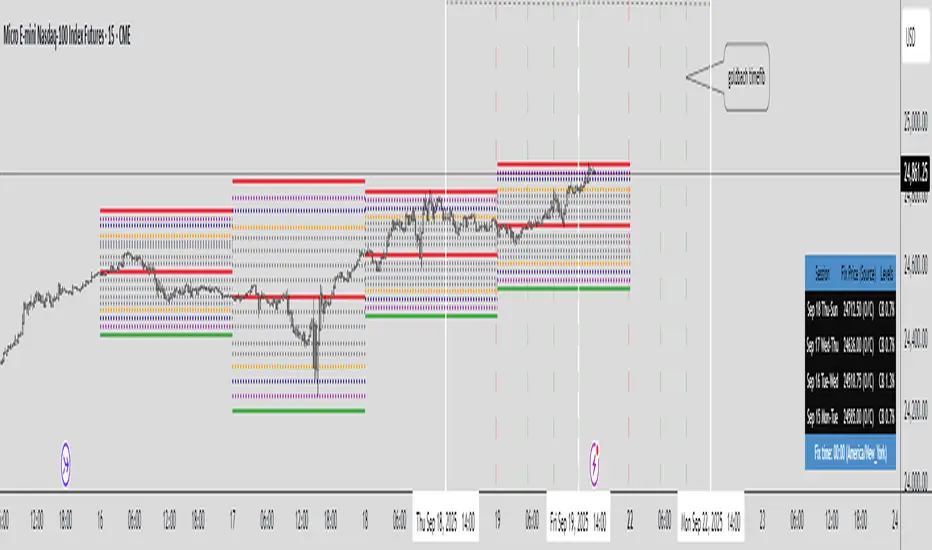
The Quasar Strategy Magic LevelsThis indicator plots key market levels that remain valid from 4:00pm New York close until the next day’s 4:00pm close.
The core logic combines:
A custom Goldbach-inspired range,
Circuit breaker percentages,
And hidden PO3 overlays.
These levels often act as magnets, targets, and later as support or resistance zones.
The central line of the whole range is what I call “the restaurant” — a strong attraction point where prices tend to gravitate, especially after the 9:30 a.m. opening.
Since these levels are based on a certain fixed price in a %, they will change over time. Then I will updated the indicator.
Use these levels as a confluence with your own trading strategy for entries and exits.

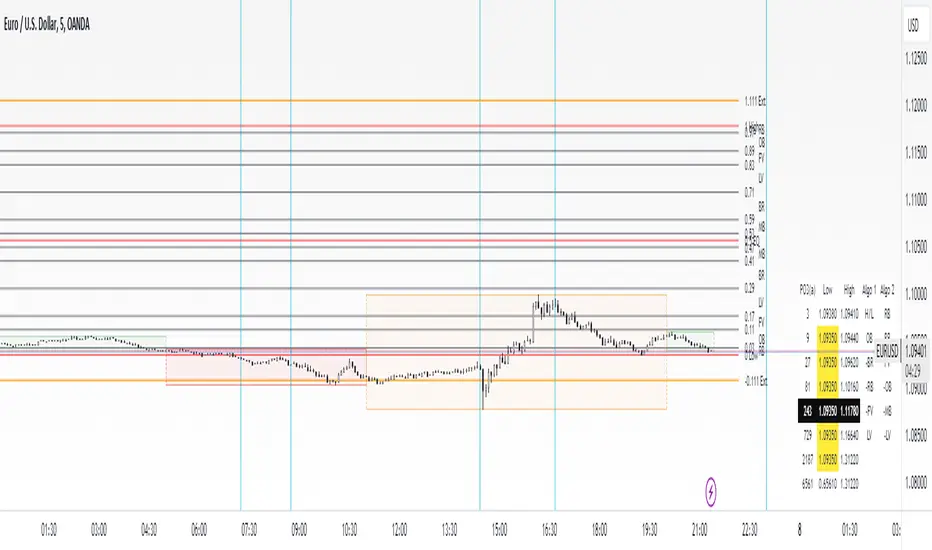
Perfect Price-Anchored % Fib Grid This indicator generates support and resistance levels anchored to a fixed price of your choice.
You can also specify a percentage for the indicator to calculate potential highs and lows.
Commonly used values are 3.5% or 7%, as well as smaller decimal versions like 0.35% or 0.7%, depending on the volatility you expect.
In addition, the indicator can highlight potential stop-run levels in multiples of 27 — ranging from 0 up to 243. This automatically places the 243 GB range directly onto your chart.
The tool is versatile and can be applied not only to equities, but also to ES futures and Forex markets.

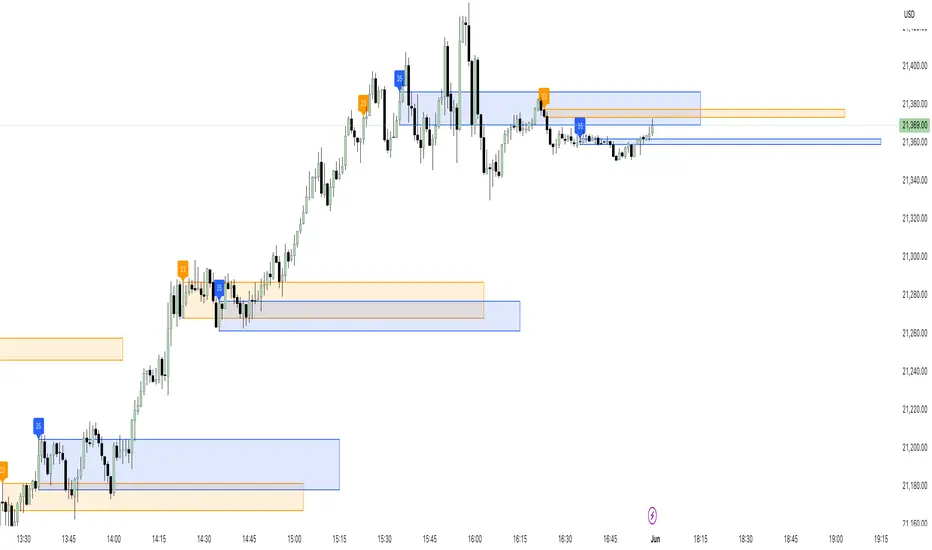
23/35 SR Channels (Hitchhikers Guide To Goldbach)This indicator highlights potential short-term support and resistance zones based on the 23rd and 35th minute of each hour. At each of these time points, it draws a zone from the high to the low of the candle, extending it forward for a fixed number of bars.
Key features:
🔸 Orange zones mark the 23-minute candle
🔹 Blue zones mark the 35-minute candle
📏 Zones extend for a customizable number of bars (channelLength)
🔄 Existing zones are removed if they overlap significantly with a new one
🏷️ Optional labels show when a 23 or 35 zone is created
This tool is ideal for traders looking to identify time-based micro-structures and intraday reaction zones.
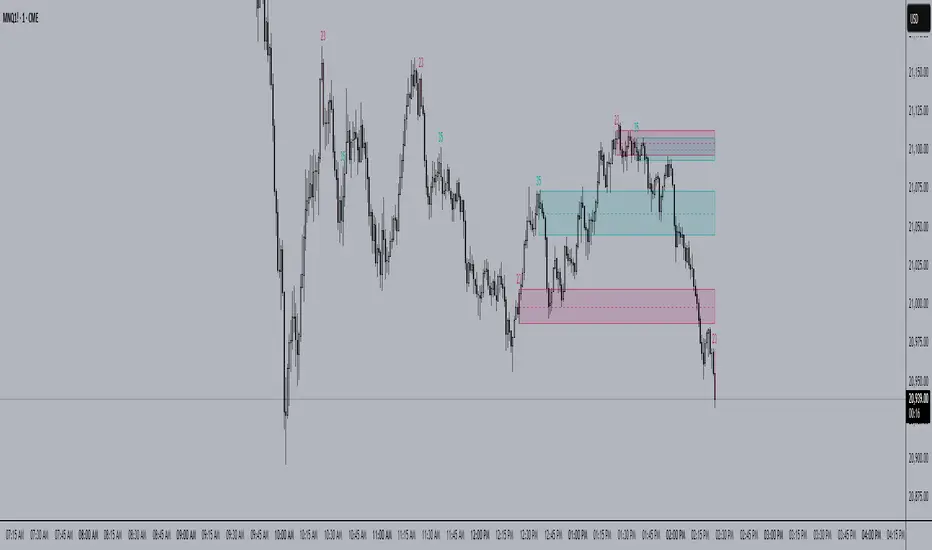
23/35 SR Channels23/35 SR Channels Indicator
The 23/35 SR Channels Indicator is designed to automatically identify key algorithmic support and resistance zones during intraday trading by focusing on specific candle patterns at the 23rd and 35th minutes of each hour.
How It Works:
Key Candle Detection:
The indicator monitors the 23rd and 35th minute candles of every hour. At these moments, it uses the candle’s high and low (or a three‑candle range centered on those minutes) to define the boundaries of a support/resistance channel.
Channel Construction and Mitigation:
Once a channel is formed from a key candle, a rectangular box is drawn to represent the channel. If a new channel (from a later 23 or 35 minute candle) overlaps an existing channel of the same type, the older channel is automatically considered "mitigated" and is removed from the chart, ensuring that only the most recent (and typically more relevant) level is displayed.
Visual Enhancement:
The indicator can also color the 23 and 35 minute candles, making them easier to identify. The channels themselves extend to the right for a fixed number of bars, providing a visual area where price might interact with these important levels, or can be extended to the current bar/until mitigated.
Benefits for Traders:
Automated Level Detection:
By focusing on the 23rd and 35th minute candles, the indicator automatically captures key support/resistance zones without manual intervention.
Dynamic Channel Updates:
As new candles form, overlapping channels are replaced with newer ones, helping to keep the chart clear and focused on the most relevant levels.
Intraday Focus:
The targeted timing helps intraday traders quickly spot potential reversal or breakout areas, enhancing decision-making during fast-moving markets.
dmn's ICT AMD-Goldbach█ OVERVIEW
This script is built on ICT time & price theory and the theory of algorithmic market maker models, and visualizes the intraday divided using powers of three into accumulation, manipulation and distribution cycles.
It also includes an automatically calculated and plotted Goldbach level (a.k.a. IPDA level or Huddleston level) overlay, to help visualize where in the current market maker profile price is in relation to the AMD cycles, and where it might trade to.
█ CONCEPTS
Accumulation, Manipulation, Distribution Cycles
A 24 hour day, with the default set to start at 20:00 CET (the start of the Forex CLS Settlement operational timeline) is split in three parts - 9, 6 and 9 hours for the three cycles (roughly corresponding with Asia, London Open and New York + London Close sessions).
Since charts are fractals, there's also intra-cycle time fibs available in the script, to highlight the smaller fractal equivalents in each cycle.
These cycles are used to visualize the three phases (AMD) for easier identification of the current daily profile by analyzing during what cycle highs and lows of the day are made.
An example of a bullish day could be price rallying before making a low during the accumulation cycle, being manipulated higher and retracing to form an optimal trade entry during the manipulation cycle, expanding and creating the high of the day before selling off during the distribution cycle, with a potential reversal before it ends.
Goldbach levels
The Goldbach levels are based on the size of a price range (or price swing, if you will) expressed as a factor of power of three (3^n).
To decide what number to tell the script to use for the calculation, we look at what 3^n number best fits an average swing on the preferred timeframe we're trading.
For example; PO3 27 (3^3)might be fit for scalping, while PO3 243 (3^5) may correspond to the daily or weekly range, depending on the asset.
The script then calculates a range high and a range low using a power of three formula based on the current price and divides it into levels using Goldbach numbers.
At these levels one might expect to see price form various "blocks" as defined in concept by Michael J. Huddleston.
The blocks that correspond to the Goldbach levels are labeled with abbreviations as follows:
Ext = External range
Low = Range low
High = Range high
FVG = Fair value gap
RB = Rejection block
OB = Order block
LV = Liquidity void
BR = Breaker
MB = Mitigation block
Using these levels and said blocks we identify where in the current running market maker profile price is offered, and trade the preferred timeframe in line with the AMD cycles accordingly.
█ FEATURES
Custom AMD time cycles session times.
Custom time fib for fractal cycles.
Color and style customization.
Show only current or also historical cycles.
Equilibrium mode for Goldbach levels (show only high/low and midpoint)
Autodetection of asset type, with manual override.
█ NOTE
The default timings for the AMD cycles are set up for Forex pairs. For other asset types, such as indices, other timings are nessecary for optimal results.
Goldbach levels requires the correct symbol type setting for the calculation to work properly. Disable the script's autodetection and enable/disable the Forex option according to the type of chart if it fails.