TLADe GEX Dashboard - ES/SPX/SPY Gamma Exposure LevelsA professional framework for Gamma Exposure analysis on S&P 500 instruments.
━━━━━━━━━━━━━━━━━━━━━━━━━━━━
WHAT THIS INDICATOR DOES
This indicator visualizes key strategic levels derived from Gamma Exposure (GEX) analysis — the zones where dealer hedging flows create measurable support and resistance.
What you see:
- Call Walls — resistance zones where dealers hedge against upside
- Put Walls — support zones where dealers hedge against downside
- Zero Gamma — the structural pivot between mean-reversion and trend
- Expected Move bands — statistical range boundaries
- GEX Histogram — gamma distribution profile directly on chart
━━━━━━━━━━━━━━━━━━━━━━━━━━━━
KEY FEATURES
▸ Ticker Switcher
Select ES, SPX, or SPY directly in settings.
Data converts automatically. One script, three instruments.
▸ GEX Profile Histogram
See gamma distribution as horizontal bars on your chart.
Instantly spot where positioning clusters.
▸ Color Themes
Choose between Boreal, Classic, or Lady Trader palettes.
▸ Level Toggles
Show/hide level groups independently:
GEX Levels | System Levels | Structure Levels
▸ Rich Tooltips
Hover for details: GEX values, Call/Put ratio, Hold/Break probabilities.
▸ Flip Detection
When price crosses a level, it automatically updates role and style (solid → dashed).
━━━━━━━━━━━━━━━━━━━━━━━━━━━━
HOW TO READ THE LEVELS
Each line represents a zone where price reaction is statistically probable:
- Thick solid lines = level not yet crossed
- Dashed lines = level flipped (price crossed through)
- Cyan/Teal or Green = potential support (Put Walls)
- Pink/Red = potential resistance (Call Walls)
- Gray = structural levels (Zero Gamma, Vol Bands, PDH/PDL)
The indicator shows structure, not predictions.
Use it to identify where the market is likely to react — not which direction it will go.
━━━━━━━━━━━━━━━━━━━━━━━━━━━━
PRO TIP: CONFLUENCE
This tool is most powerful when combined with your own analysis.
Highest-probability setups occur when GEX levels align with:
Price action zones (support/resistance, order blocks)
Volume Profile (HVN/LVN, VWAP)
Technical structure (prior highs/lows, trend lines)
One level alone is information. Confluence is edge.
━━━━━━━━━━━━━━━━━━━━━━━━━━━━
ABOUT THE DATA
The levels shown use a static snapshot for demonstration.
For current session data, export fresh scripts from the TLADe terminal at tradelikeadealer.com
━━━━━━━━━━━━━━━━━━━━━━━━━━━━
DISCLAIMER
This tool is for informational and educational purposes only.
It does not constitute financial advice. Trading involves significant risk.
Past structure does not guarantee future behavior.
GEX

Options Gamma Flip Zones [BackQuant]Options Gamma Flip Zones
A market-structure style “gamma flip” mapper that builds adaptive strike-like zones, scores how price interacts with them, then promotes the strongest candidates into confirmed flip zones. Designed to highlight pinning, failed breaks, and rotational behavior without needing live options chain data.
What this indicator does
This script identifies price levels that behave like “strike magnets” during conditions that resemble options pinning, then draws dynamic zones around those levels.
Instead of assuming every round number matters, it:
Creates a strike ladder (auto or manual step).
Applies a regime filter that looks for “pin-friendly” market conditions.
Tracks and scores repeated interactions with the level.
Upgrades a zone from candidate to confirmed when enough evidence accumulates.
Invalidates zones when price achieves sustained acceptance away from them.
The output is a set of shaded boxes (zones) centered on strike-like levels, with text readouts that show the current state of each zone.
Key concept: “Gamma proxy”
A true gamma flip requires options positioning data. This indicator does not use options chain gamma.
Instead, it uses a proxy approach:
When markets have elevated volatility relative to their recent baseline AND trend strength is weak, price often behaves “sticky” around key levels.
In those conditions, repeated touches and failed escapes around a level behave similarly to pinning around strikes.
So this tool is best read as:
“Where would a strike-like magnet likely exist right now, based on price behavior and regime conditions?”
How zones are created
Zones only start forming when the script detects a pin-friendly regime.
1) Strike Ladder (level selection)
Auto Strike Step selects a step size based on current price magnitude (bigger price, bigger step).
Manual Strike Step lets you force a fixed increment.
The current “active level” is the nearest rounded level to price.
Major Level Every optionally marks major ladder levels (multiples of step).
2) Band construction (zone thickness)
Each zone is a symmetric band around the level, using one of two modes:
ATR mode scales thickness with volatility.
Percent mode scales thickness as a fraction of price.
This matters because “pin behavior” is not a single tick. It’s a region where price repeatedly probes and rejects.
Regime filter (when the script is allowed to believe in pinning)
A zone is only eligible to form and strengthen when Pin Regime is active. Pin Regime is a conjunction of:
1) IV proxy (ATR z-score)
Uses ATR as a volatility proxy.
Converts ATR% into a z-score relative to a long lookback.
IV Proxy Threshold controls how elevated volatility must be before the script considers pinning likely.
2) Weak trend requirement
The script also requires price action to be non-trending:
EMA spread must be small (fast vs slow EMA not diverging strongly).
ADX must be below a ceiling, confirming weak directional trend strength.
Interpretation:
High “IV proxy” + weak trend is where pin-like behavior is most common.
If trend is strong, zones are less meaningful because price is more likely to accept away from levels.
Flip confirmation logic (what upgrades a zone)
A zone is not “confirmed” just because price is near it once. The script builds conviction via evidence accumulation.
Evidence types:
Touches : price comes close to the level within tolerance.
Failed escapes : price pushes outside the band but closes back inside (rejection).
Acceptance run : consecutive closes outside the band, suggesting price is accepting away from the zone.
Protections:
Touch Cooldown prevents counting the same micro-chop as multiple touches.
Acceptance Bars defines what “real acceptance” means, so the zone does not get invalidated by one noisy bar.
A zone becomes confirmed when:
Touches meet the “evidence” requirement.
Failed escapes meet the “rejection” requirement.
The regime filter still says the market is pin-friendly.
That is important, it avoids promoting levels that only worked briefly in a trending tape.
Zone scoring and lifecycle
Each zone maintains a score that evolves over time. Think of score as “how much this level has recently behaved like a magnet.”
Score dynamics:
Decay per bar : score fades over time if price stops respecting the zone.
+ per touch : repeated proximity increases score.
+ per failed escape : rejections add stronger reinforcement.
- per acceptance bar : sustained trading outside reduces score.
Min score to draw : prevents clutter from weak, low-confidence zones.
Invalidation:
If the score becomes very weak AND price achieves sustained acceptance away from the zone, the zone is deleted.
This keeps the chart clean and ensures zones represent current market behavior, not ancient levels.
How to read the plot on chart
1) Zone fill and border
Each zone is drawn as a box extended to the right.
Fill opacity adapts to zone strength, strong zones are visually more prominent.
Border color encodes the current directional context and special events.
2) Bullish vs bearish coloring
A zone is colored bullish when price is currently trading above the zone’s mid-level.
A zone is colored bearish when price is currently trading below it.
This is not a trade signal by itself, it is a state cue for “which side is in control around the level.”
3) Failed escape highlighting
If price attempts to break above the band and fails, the border temporarily highlights as a failed up escape.
If price attempts to break below the band and fails, the border temporarily highlights as a failed down escape.
These are the moments where pin behavior is most visible:
Break attempt.
Immediate rejection.
Return to the band.
4) Midline (optional)
The zone midline is the strike-like level itself.
It is dotted to distinguish it from price structure lines.
5) Optional strike ladder overlay
When enabled, the script draws major and minor ladder lines near current price.
Major levels are thicker and less transparent.
This is a visualization aid for “where the algorithm is rounding,” not a prediction tool.
On-chart text readout (what the box text means)
Each box prints a compact state summary, designed for fast scanning:
Γ CANDIDATE means the zone is being tracked but not yet validated.
Γ FLIP (PROXY) means the zone has met confirmation requirements.
BULL/BEAR indicates which side price is on relative to the mid-level.
L prints the level value.
T is touch count, repeated proximity events.
F is fail count, rejected escape attempts.
IVz is the volatility proxy z-score at the moment.
ADX is the trend strength context.
Practical use cases
1) Pinning and range trading context
Confirmed zones often act like gravity wells in sideways or rotational regimes.
When price repeatedly fails to escape, fading outer edges can be reasonable context for mean reversion workflows.
2) Breakout validation
If price achieves acceptance outside the band for multiple bars, that is stronger breakout context than a single wick.
Zones that invalidate cleanly can mark transitions from pinning to directional move.
3) Time your “do nothing” periods
When Pin Regime is active and a zone is confirmed, the tape often becomes sticky and inefficient for trend chasing.
This helps avoid taking trend entries into a pin environment.
Alerts
Standalone alertconditions are included:
Zone Confirmed : a candidate becomes confirmed.
Zone Touch : price touches an active zone within tolerance.
Zone Invalidated : the zone loses relevance and is removed.
Tuning guidelines
Sensitivity vs quality
Lower Touches Needed and Failed Escapes Needed creates more zones faster, but with lower quality.
Higher values create fewer zones, but the ones that remain are more behaviorally “proven.”
Band width
ATR mode adapts to volatility and is typically safer across assets.
Percent mode is consistent visually but can feel too tight in high vol or too wide in low vol if not tuned.
Regime thresholds
If you want fewer zones, raise IV proxy threshold and tighten weak-trend filters.
If you want more zones, lower IV proxy threshold and loosen weak-trend filters.
Limitations
This is a proxy model, not live options gamma.
In strong trends, pinning assumptions can break, the regime filter is there to reduce that risk, but not eliminate it.
Auto strike step is designed for typical market ranges, manual step is recommended for niche tick sizes or custom markets.
Disclaimer
Educational and informational only, not financial advice.
Not a complete trading system.
Always validate settings per asset and timeframe.

GEX / Gamma - SPX Indicator Description – GEX / Gamma (SPX)
This indicator allows you to manually plot your daily +GEX, TRANS-GEX, and –GEX levels on SPX and visualize how price reacts around key gamma zones.
You enter the three levels each morning, and the script automatically draws:
+GEX / TRANS / –GEX zones with an adjustable buffer
Clean labels (e.g., “+GEX: 6850”) pinned to the right side of the chart
Today-only candle coloring (green above TRANS-GEX, red below)
Zones extend from yesterday’s session through the current session, helping highlight areas where dealer hedging flows may influence volatility, compression, or acceleration.
How to Use
Add the indicator to any intraday SPX chart.
Open settings and enter your +GEX, TRANS-GEX, and –GEX levels for the day.
Adjust the buffer, colors, and label style as needed.
Watch how price behaves as it moves above or below TRANS-GEX and interacts with +/- GEX zones.
Best For
Intraday SPX / ES / SPY
Options traders
Volatility and gamma-aware strategies
Strategy Behind It (Tight Version)
GEX levels help identify where dealer hedging flows can influence SPX price behavior.
+GEX (Positive Gamma)
Market tends to stabilize here. Dealers hedge against price moves, creating mean-reversion and lower volatility.
TRANS-GEX (Transition Level)
Key pivot where gamma flips. Price crossing this level often signals a shift in volatility or intraday direction.
–GEX (Negative Gamma)
Market becomes more reactive. Dealers hedge with price, increasing volatility, momentum, and trend potential.
How traders use it:
Expect resistance or slowdown into +GEX
Watch for potential bottoming or increased volatility –GEX
Use TRANS-GEX as a bias line or trigger for intraday shifts
A move outside of either the +GEX or -GEX will likely result in some type of high volume move.

Gamma Exposure Levels by OMG (Oh My Gamma)OMG (Oh My Gamma) - Daily GEX Levels
An operational framework for Gamma analysis with daily data.
Indicator's Purpose & Demo Data
This indicator plots key strategic levels derived from Gamma Exposure (GEX) analysis. It showcases the operational logic of OhMyGamma analytical engine.
IMPORTANT: The levels plotted by this public script are based on a past date's snapshot for demonstration purposes. They are not valid for live trading and will not update automatically.
The real edge comes from using the fresh data structure provided daily.
How to Read the Levels
This indicator is designed to provide actionable intelligence, not just data. Here's how to read it:
The Levels: Each line represents a key strategic zone (Zero Gamma, Call/Put Walls, etc.) where a market reaction is statistically probable due to dealer hedging flows.
Line Thickness = Strategic Importance: The thickness of each line directly corresponds to its strategic rating. Thicker, solid lines represent higher-conviction zones.
Labels & Tooltips: Hover over a level's label on your chart to see its full description, confluences, and strategic rating.
Pro Tip: The Power of Confluence
This indicator is not a standalone "system". It's an institutional-grade intelligence layer. Its predictive power increases exponentially when used to find confluence with your own analysis.
The highest-probability trades occur when a key Gamma level aligns with:
Price Action: Key support/resistance zones, order blocks, or liquidity pools.
Volumetric Indicators: High/Low Volume Nodes (HVN/LVN) from Volume Profile, VWAP, and Anchored VWAP.
Use these levels to confirm your setups and gain the conviction to act.
How to Get the Daily Updated Script
This indicator requires a new Pine Script code each day to load the current session's data.
To get the daily updated code feel free to visit www.ohmygamma.com
Feedback & Suggestions
This tool is built for the community. Suggestions for improvements and new features are highly welcome and help the project evolve. Feel free to get in touch via the contact form on the website.
Disclaimer: This tool is for informational and educational purposes only. Trading involves significant risk. The authors assume no responsibility for any trading decisions.

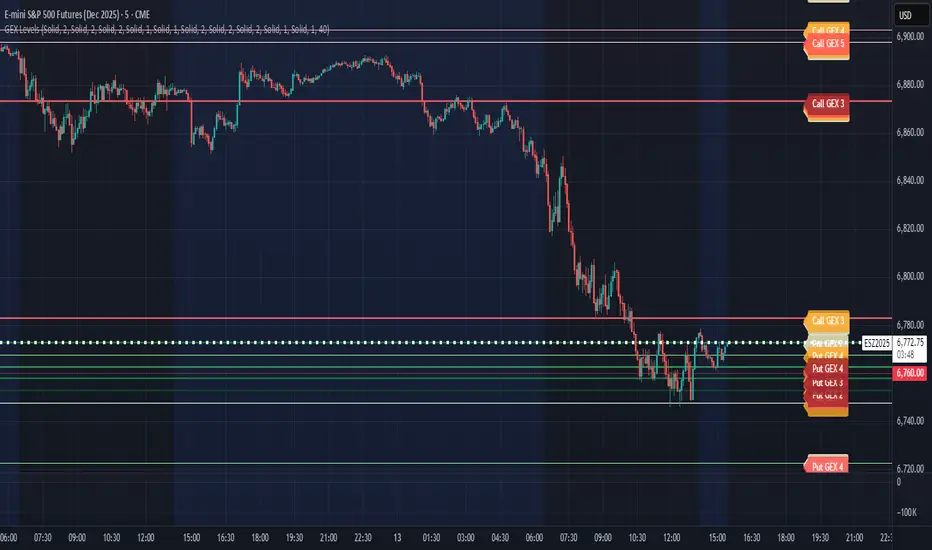
CB Charts - GEX MESZ2025/ESZ2025Last Updated: 09/22/2025 6:41 a.m. PST
*DISCLAIMER: Only intended for ESZ2025/MESZ2025 charts.
This indicator plots horizontal levels based on batched GEX levels for ESZ2025/MESZ2025. The batched data is derived from contracts expiring: 0DTE, 1DTE, EoW, EoM, Next Week, Next Month and 3-months out. Labels are available for a high-level view of which levels are which. Hovering (or long-pressing on mobile TV) over the labels will display the nominal values and Rank. This script is manually updated and may not be always updated.
When and what to use:
- Most respected levels come from 1DTE, EoW and EoM.
- 0DTE is included for when this script becomes intraday updated. (CURRENTLY NOT UPDATED INTRADAY)
- Next Week setting is best used only for Friday and Sunday trading
- Next Month setting is best for weeks close to the end of the current month
Powered by the Camels of Wallstreet
SPY to ES or QQQ to NQThis indicator is used to automatically map SPY VWAP and 10 levels of your choice to ES / MES or map QQQ VWAP and 10 levels of your choice to NQ / MNQ . Since SPY and QQQ have the same price action as their futures iteration, there seems to a direct correlation between their levels and VWAP. This indicator is made to easily map the key levels of your choice to the appropriate futures instrument.
