PT FVG ImbalancesVersion 1.0 of the PT FVG Gaps & Flat Opens was developed to visually identify any imbalances in price. This indicator can be used on all timeframes.
Fair Value Gaps are a key component when trading price action. They are derived from zones in liquidity where price moved quickly in a certain direction leaving gaps behind. These areas tend to act as magnets to price throughout the trading session of that timeframe.
PT FVG Features:
-Gaps that have been partially filled will shade darker to show price has already attempted to fill that gap before (Toggle Highlight Gap Fill).
-Gaps that have been partially filled will remove a portion of the background zone to indicate how much gap is left to fill in the full zone (Toggle Highlight Remaining Gap).
Flat Open Candles are derived from candles that open without a wick (wickless candles). Price more often than not tends to gravitate towards these areas in the near future to fill the wickless candle before continuing on with the trend. Can be used on all timeframes, but the higher the timeframe holds more weight.
PT Flat Open Features:
-Flat open sensitivity would recommend keeping it around 30-50. If scalping keep it sub 30. This feature determines how many flat opens you want on your chat at one time.
-Delete flat open line allows us to delete the line once price has filled the wickless candle.
Video with strategy will be uploaded shortly! It is included as part of the library. Just message us for access!
Gaps

Oxy CandlestickOxymoronic (oxy) candlesticks often appear at significant levels in a chart and can indicate increased probabilities of directional moves.
Typically, green candles are hollow and red candles are filled. An oxymoronic candle is colored bullishly but filled bearishly (solid green) or vice versa (hollow red).
Oxy flags occur when:
1) Price gaps up and closes lower than the open but above the last close. A solid green (or black) candle is bearish.
2) Price gaps down and closes higher than the open but below the last close. A hollow red candle is bullish.
An oxy candle indicates one of three things:
1) Price is going up (bullish oxy)
2) Price is going down (bearish oxy)
3) Price will return to this level (either)
#1 and #2 are the default meaning. If those don't play out then look for #3.
As is the case with most indicators, it is best not to use this indicator in isolation, but to combine it with other forms of analysis to increase your probabilities and to identify significant levels.

Fractal Break Imbalance / Fair Value Gap (FVG) / Liquidity VoidFractal Break Imbalance / Fair Value Gap (FVG) / Liquidity Void
Order imbalances in either direction, either excess buy or sell orders, reduce liquidity. The market will seek to fill gaps sooner or later. The script marks an imbalance / FVG after a fractal break. It also marks any other imbalance.
Default Colours:
Green - Imbalance after fractal break to the upside
Red - Imbalance after fractal break to the downside
Yellow - Other imbalances
How To Use:
Gaps can be used to determine possible entries and targets. Those familiar with liquidity raids, supply and demand, and ICT concepts may realise it's potential.
Indicator in use:

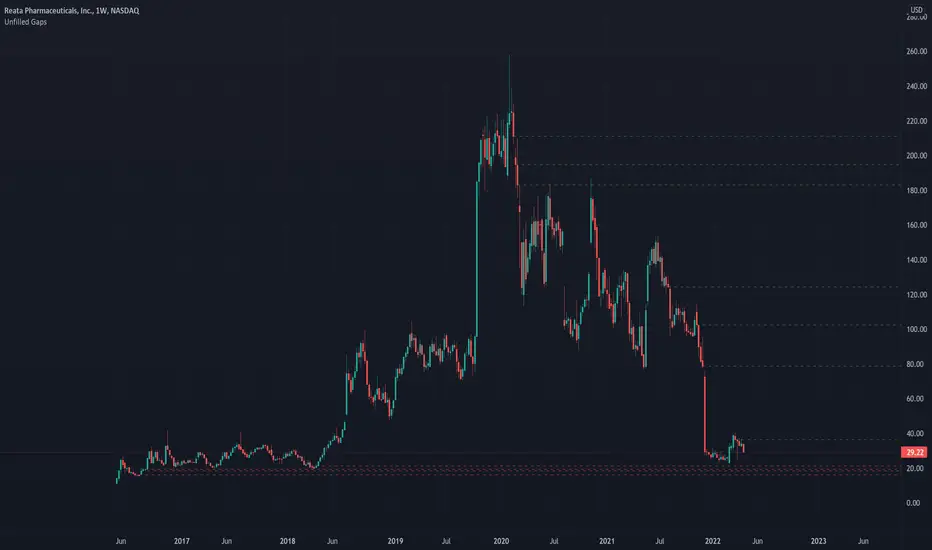
Unfilled GapsThis indicator displays gaps which have not been filled.
Notes:
- It shows only the unfilled gaps.
- You can edit the style and color of the gap lines.
- It will not work on charts with huge number of candles or gaps.
- It's based on someone else script which is mentioned in the code comments.
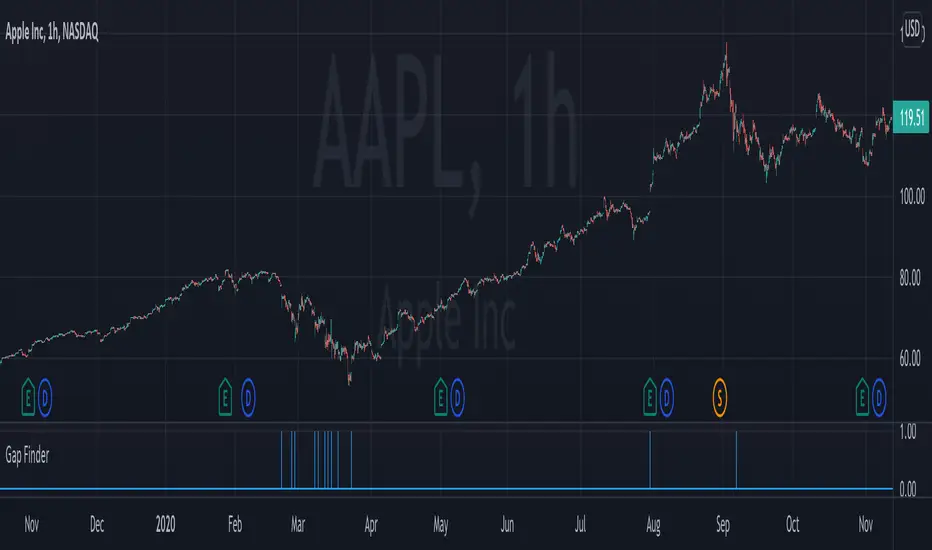
Gap FinderThis indicator finds gaps based on User specified input % threshold in the indicator settings. Histogram plot shows gaps as vertical lines for easy detection. Enjoy!
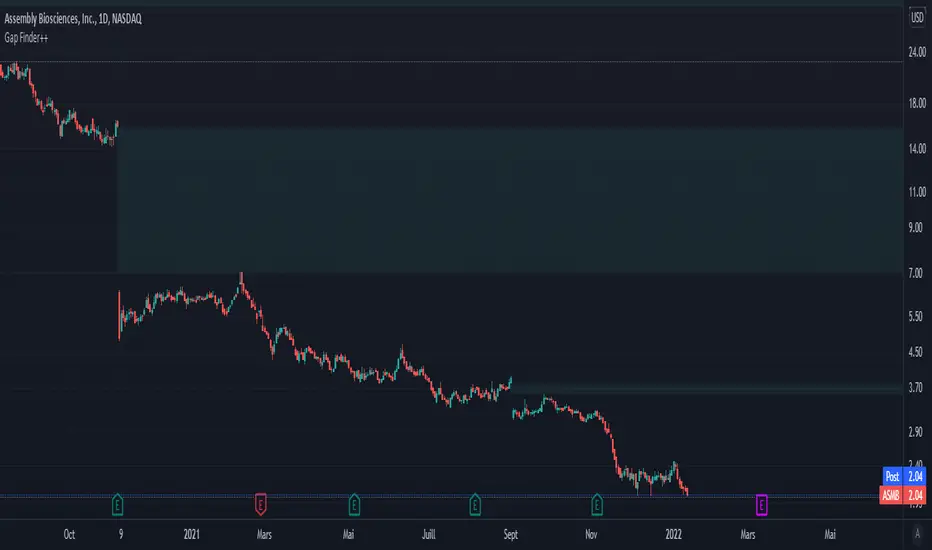
Customizable Gap Finder++█ OVERVIEW
Customizable Gap Finder by ProfessorZoom with a partial close of a gap
█ CONCEPTS
1 — Gaps bullish or bearish
2 — Gaps can be filled
3 — Gaps can be partially close
4 — Some display options
█ OTHER SECTIONS
Thanks to The rational investor for teaching me this and ProfessorZoom because he writes 99% of the script.
Did you know the percentage of gaps filled ? If not, I recommand you to follow his courses, and I have no conflicts of interest.
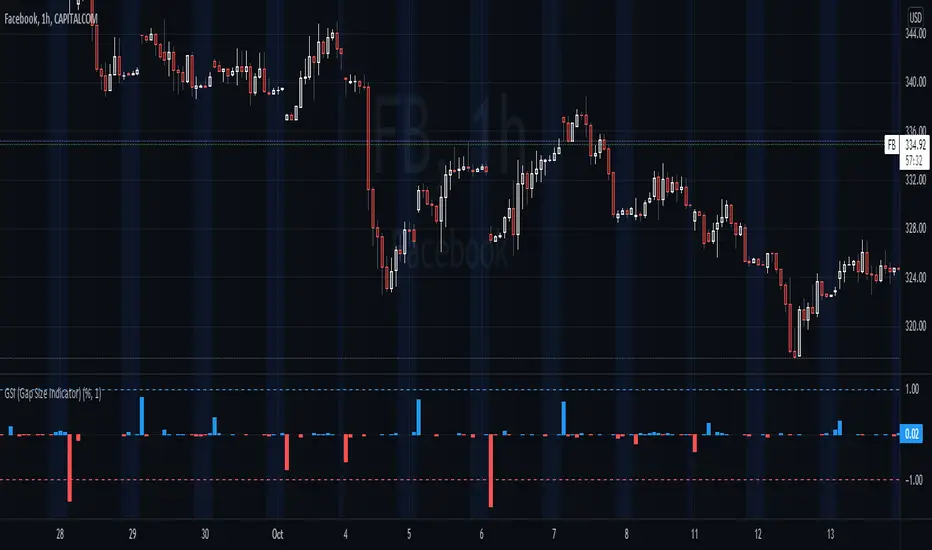
GSI (Gap Size Indicator)The purpose of this indicator is to give a quick view of a gap size between two candles, and to detect any gap bigger than the trigger setting.
Options
Mode: Select the display mode (% or Value)
Variation Trigger: Defines the minimum gap size to give a signal, for both positive and negative sides. This option depends on the Mode setting
Show trigger lines: Enable/Disable the display of the Variation Trigger setting lines
Color signals only: When enabled, bars crossing the trigger value are still colored, but other are gray
Show signals only: When enabled, will only show bars corresponding to gaps crossing the trigger value
Notes
Basic alerts on Bullish , Bearish and All gaps are available.
Feel free to suggest any improvement.
Customizable Gap FinderThis is a fully customizable gap finder. You can change the color of just about anything, on top of hiding filled/old gaps. This is so you can spot those tiny gaps on something such as futures. Be sure to play around with the settings.

No gaps candlesThis indicator repaints the candles so that every candle's open price is the previous candle's close price. This helps visualize stocks and ETFs that have big gaps, usually between trading days.
You should hide visibility of the ticker for this to be displayed properly.

Imbalance FinderImbalance Finder
I struggled to always see it visually this marks whether there is or isn't imbalance
Very quick way of finding imbalance between bars

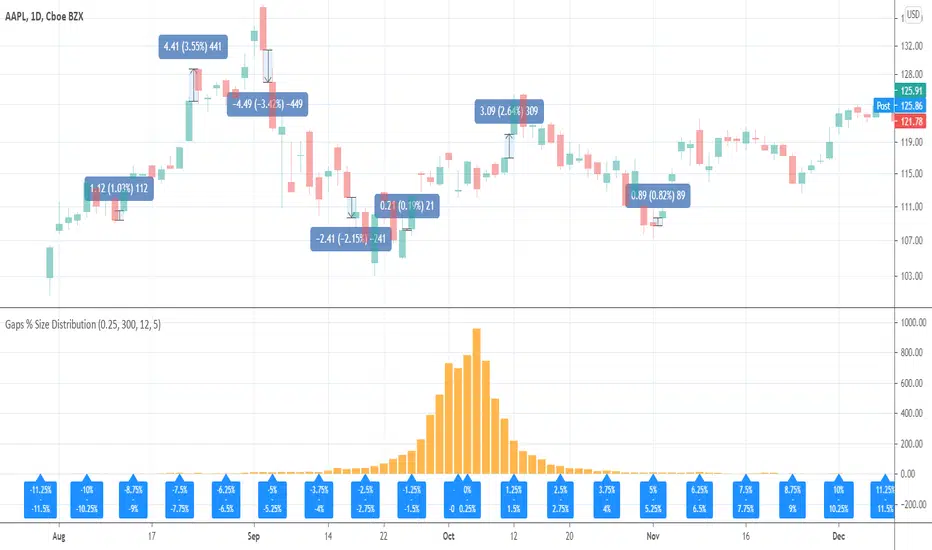
Gaps % Size DistributionThis tool is to visualize the distribution of gap % sizes, i.e. those things that I marked on the main chart. The tool uses the entire history of an instrument.
The detalization depends on the Binning Step parameter. The lower chart timeframe the lower that step should be.
Good luck.
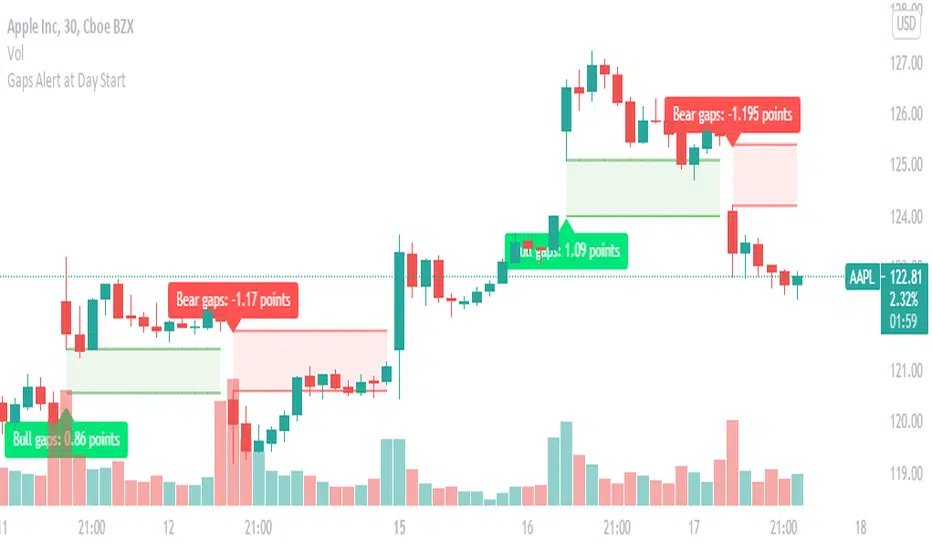
Gaps : set Alert to get Alert at Day StartGaps are areas on a chart where the price of a stock (or another financial instrument) moves sharply up or down,
with little or no trading in between. As a result, the asset's chart shows a gap in the normal price pattern.
The trader can interpret and exploit these gaps for profit.
What do i look for in these gaps, Will these gaps will fill or not fill?
When someone says a gap has been filled, that means the price has moved back to the original pre-gap level.
how you can benefit with this indicator?
this indicator instantly picks up the gap at the start of the day and also helps in identifying weather it is a bullish gap or a bearish gap
in this you can easily set up alerts, you will be instantly alerted if any gap occurs.
What does the visual on chart indicates ?
Green color gaps are bullish gaps or gap up ,label indicates the type of gap and the width of the gap
Red color gaps are bearish gaps or gap down ,label indicates the type of gap and the width of the gap
once you set alert you will Receive alert in the below format
Price (current price) 'Bear gap width: ' (gap Width in points)
Price (current price) 'Bull gap width: ' (gap Width in points)
This will work on all time frame equal to or less than "D".
FairValueGap FVGWhat is a Fair Value Gap or a Gap?
There may be different explanation or reasons of gaps In Forex, my knowledge says that gaps are not very common and they are filled when ever market gets an opportunity to fill. I am trying to figure out the fair Value gap through this indicator.
Gaps are sharp breaks in price with no trading occurring in between. Gaps can happen moving up or moving down. In the forex
market, gaps primarily occur over the weekend because it is the only time the forex market closes. Gaps may also occur on very
short timeframes such as a one-minute chart or immediately following a major news announcement.
How I calculated the gaps Value?
Calculation Method of Gap used is when (low_bar(current bar)-high_bar(two bars back))>0 and (low_bar(two bars back)-high_bar(current bar))>0
The gaps are represented by the Orange and Lime color Bar height.
Do the gaps need to be filtered?
This is the most important part according to me.
Yes, the gaps need to be filtered, Since there are may gaps one after another ,In This Indicator i have used a logic to filter out unnecessary Gaps.
you will be seeing only major Important gaps which you need to focus on.
How gaps Helps?
Gaps sometimes result in corrective price action. In other words, after the gap occurs prices have a tendency to reverse and “fill” the gap.
This is what is look for.
How to use the setting of the indicator and what do they represent?
This indicator setting has 4 options
1.plot major Filtered FVG of Bullish Candles
When you check this option all major FGV will be filtered based on my logic of filtering the gaps
2.plot major Filtered FVG of Bearish Candles
When you check this option all major FGV will be filtered based on my logic of filtering the gaps
3.Plot Bar size representing the GAPS
The bars(lime and orange color) in front of candle bars are the size of the gap.
4.Plot Lines representing the GAPS
You can also visualize the recent gaps through lines , you will be able to see only 3 to 5 recent gaps through line.(not able to plot
all gaps through line because of the limit, so gaps are represented by the orange and lime color bars)
You can also change the resolution in setting of the indicator to get different time frame FGV.
Thanks to mickey1984 for guiding and helping for this concept idea.
Have any question Feel free to ask?

Ether (Ethereum) CME Gaps [NeoButane]Detects gaps in trading for CME's "Ether" cash-settled futures. This will show gaps as they happen on the 24/7 charts that crypto exchanges use. It is not usable on CME's tickers themselves, as gaps in trading are not displayed.
This indicator will only display if viewing an ETH chart.
More information on the CME ETH futures here:
www.cmegroup.com
Based on:
What's different: CME's BTC and ETH markets trade the same hours, but one may hit a limit breaker while there may be a case where the other does not.

BITCOIN CME FUTURES GAPSDisplays information about Bitcoin CME Futures Gaps over BTCUSD (or XBTUSD) charts.
You can configure a threshold percentage to only display gaps whose size is greater than that percentage. The gap precentage is calculated based on the current close price.
Gaps up are displayed in Orange, gaps down in Green

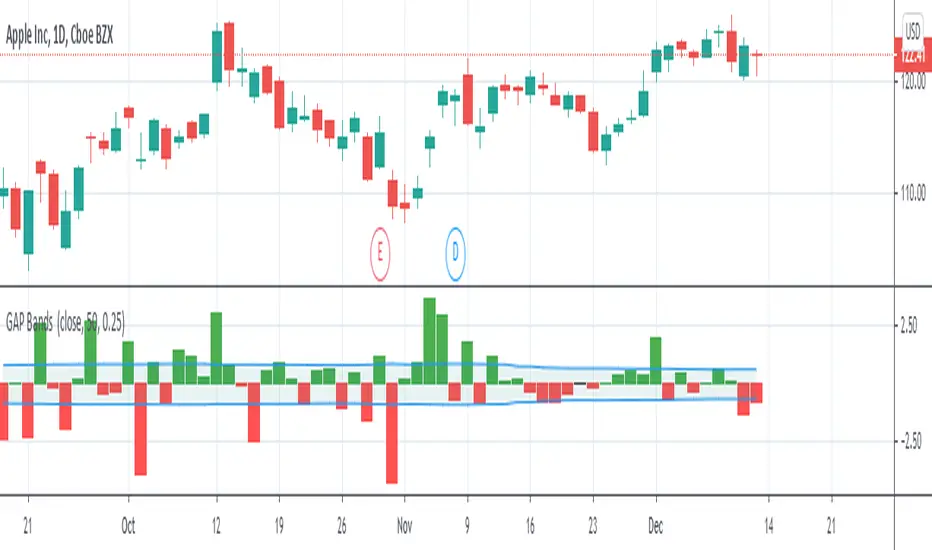
GAP Bands""
Introduction
Gap trading is a simple and disciplined approach to buying and shorting stocks. Essentially, one finds stocks that have a price gap from the previous close, then watches the first hour of trading to identify the trading range. Rising above that range signals a buy, while falling below it signals a short.
What is a Gap?
A gap is a change in price levels between the close and open of two consecutive days. Although most technical analysis manuals define the four types of gap patterns as Common, Breakaway, Continuation and Exhaustion, those labels are applied after the chart pattern is established. That is, the difference between any one type of gap from another is only distinguishable after the stock continues up or down in some fashion. Although those classifications are useful for a longer-term understanding of how a particular stock or sector reacts, they offer little guidance for trading.""" (Definition from StockCharts)
I plot gaps and add a band to them with volatility to make a decision about how important the current gap in terms of our price movement.
Daily GAP StatsI did not write the script from scratch but rather started editing code of an existing one. The original code came from a script called GAP DETECTOR by @Asch-
First up: I am a trader, not a programmer and therefore my code most likely is inefficient. If someone with more expertise would like to help and optimize it - feel free to get in touch, I am always happy to learn some new tricks. :)
This script does 2 things:
- It shows daily gaps stats based on user inputs
- It shows color coded labels on gap days with additional information in tooltips ( important: make sure to read 'known issues/limitations' at the end )
User Inputs
==========
Although the input dialog is pretty straight forward, I do a quick rundown:
- Length: max lookback time
- Gap Direction: self explanatory
- Show All Gaps | Cont Only | Reversal Only | Off:
This refers to the way labels are displayed on gap days (again: make sure to read known issues/limitations!)
- Show All Gaps: does what it says
- Cont Only: only shows gaps where price continued in the gap direction. If you filter for gap ups and chose 'Cont only' you will only see labels on gap days where price closed above the open (and vice versa if you scan for gap downs).
- Reversal Only: you will only see labels for closes below the open on gap up days (and the opposite on gap down days)
- Off: self explanatory
- Gap Measure in ATR/PCT: self explanatory, ATR is calculated over a 10d period
- Gap Size (Abs Values): no negative values allowed here. If you filter for gap downs and enter 3 it means it will show gaps where the stock fell more than 3 ATR/PCT on the open.
- RVOL Factor: along with significant gaps should come significant volume. RVOL = volume of the gap day / 20d average volume
- Viewing Options: Placing the stats label in the window is a bit tricky (see knonw issues/limitations) and I was not sure which way I liked better. See for yourself what works best for you.
Known Isusses/Limitations:
=======================
- Positioning of the stats table:
As to my knowledge, Tradingview only allows label positioning relative to price and not relative to the chart window. I tried to always display the gap stats table in the upper right corner, using 52wk high as y-coordinate. This works ok most of the time, but is not pretty. If anybody has some fancy way to tag the label in a fixed position, please get in touch.
- Max number of labels per script:
TradingView has a limitation that allows a maxium of ~50 labels per script. If there are more labels, TradingView will automatically cut the oldest ones, without any notification. I have found this behaviour to be rather inconsistent - sometimes it'll dump labels even if there are a lot fewer than 50. Hopefully TradingView will drop this limitation at one point in the future.
Important: The inconsistent display of the gap day labels has NO INFLUENCE on the calculations in the gap stats table - the count and the calculations are complete and correct!

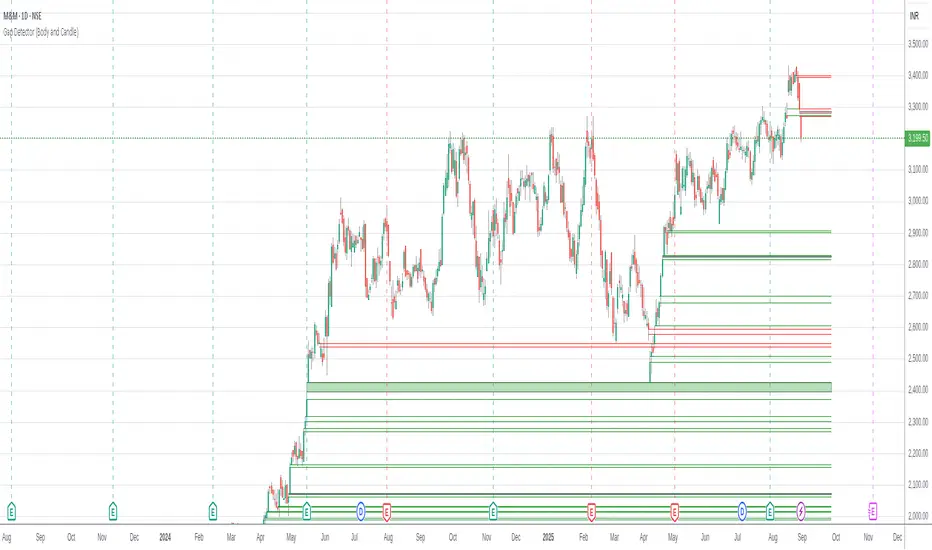
Body Gap Detector
This script was inherited from "GAP DETECTOR" by Asch- and the modified version is being published with consent of the author.
This script identifies gap up or gap down between candle bodies (for the selected time frame). The original script has been reworked to consider Open/Close instead of the High/Low. It identifies "Gap" up/down and indicates them with markers drawn from "Open/Close" of one candle to the "Close/Open" of another.
The default setting is to consider the last 1500 candles. "Gap Up" is indicated by Green bars and "Gap Down" is indicated with Red bars.
[AKM] Daily Opening Gap IndicatorThis indicator will mark yesterday daily closing price with today daily opening price.
Do not use this indicator with timeframe higher than Daily timeframe.
Gap up will be indicate with green color.
Gap down will be indicate with red color.
Send us private message on TV to gain access to the indicator.

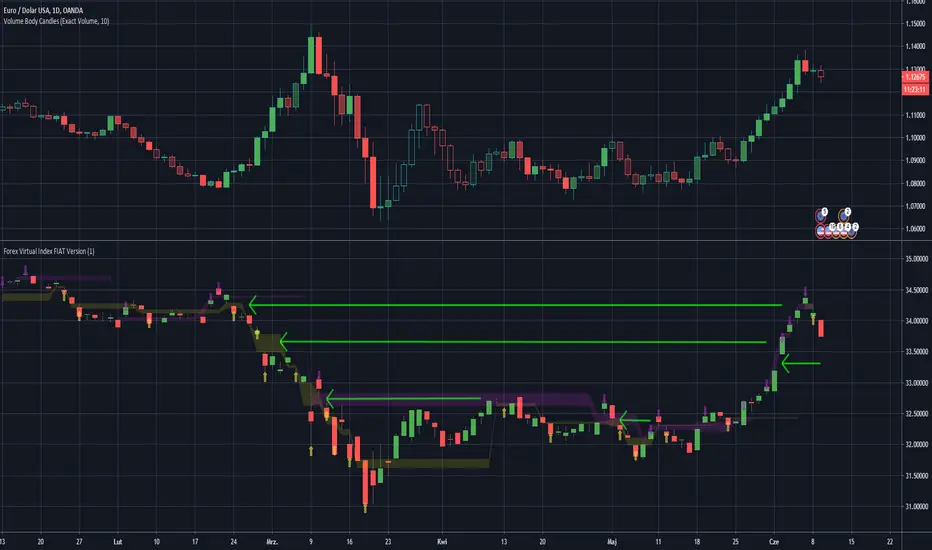
Forex Virtual Index FIAT VersionThis is virtually created FX Fiat pairs index based on OANDAs data.
Pairs are: EUR/USD , AUD/USD , GBP/USD , NZD/USD , AUD/JPY , EUR/JPY , GBP/JPY , USD/JPY , USD/CAD , USD/PLN
Be awared that some pairs like USD/CAD , have reversed correlation to the index.
You may look at the gaps as on standard S/R levels.
ps. Take look inside the scirpt's settings.
ps2. This script is invite-only for the members of our trading group (info in signature, group is free of charge).
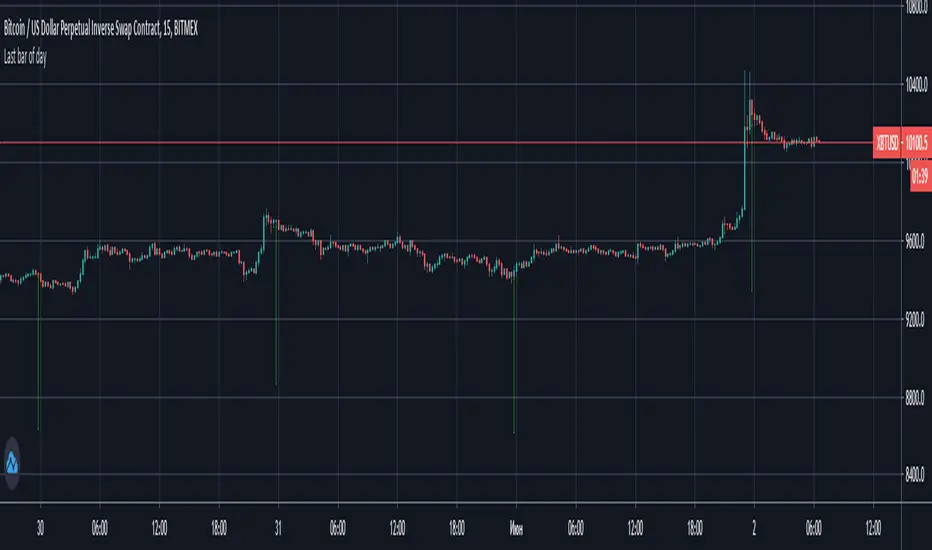
How to detect last bar of day Simple way how to detect last bar of day and close all positions
UPD: day end can be different for yours because stocks market use another timezone
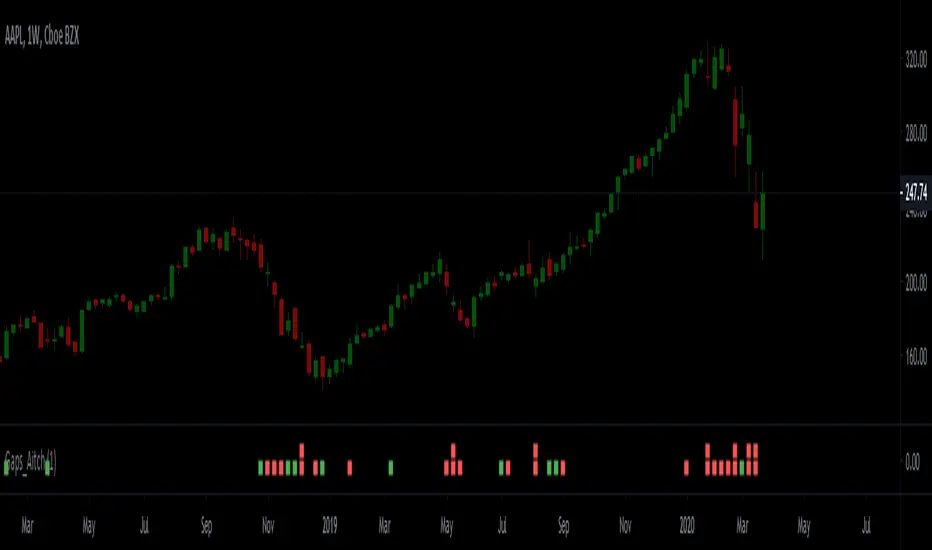
Gap Finder - Aitch-TGap finder finds the following types of gaps:
- Full Gap Up (open price is higher than the previous day's high)
- Partial Gap Up (open price is higher than the previous day's close)
- Full Gap Down (open price is lower than the previous day's low)
- Partial Gap Down (open price is lower that the previous day's close)
The script is fully customizable and can be applied to Forex, futures, stocks and crypto.
How to use it:
Once you have added the script to your chart, go to the script's settings and type in the size of the gap, then move to the style tab and check the types of gaps that you want the script to find. If you wish, you can also edit the rest of the settings to your liking.
Hit the Ok button when your done.
Green and red squares will appear on top and bottom of the indicator pointing out the location of the sharp move.
By default, full gap signals appear on top of the indicator while partial gap signals appear on the bottom of the indicator.
Defaul gap size is 1%.
My VWAP Reversal + Pivot Points StandardThis indicator, with the addition of a standard VWAP indicator to the 5m chart, helps the operator when using a closing candle Price to initiate a VWAP Reversal strategy.
The strategy involves Price gapping up, look for a Close below the 1st 5m candle Low; else look for a Close above the 1st 5m candle High. On a break of VWAP, take the trade in the opposite direction of the gap, hence the VWAP Reversal. Not my own strat, credit to T3 Newsbeat, publicly posted on YouTube.
The Pivot Points Standard in the Pine 4 user manual, was the base source code, and leaving it here will allow me to remove the PP indicator I was using.
