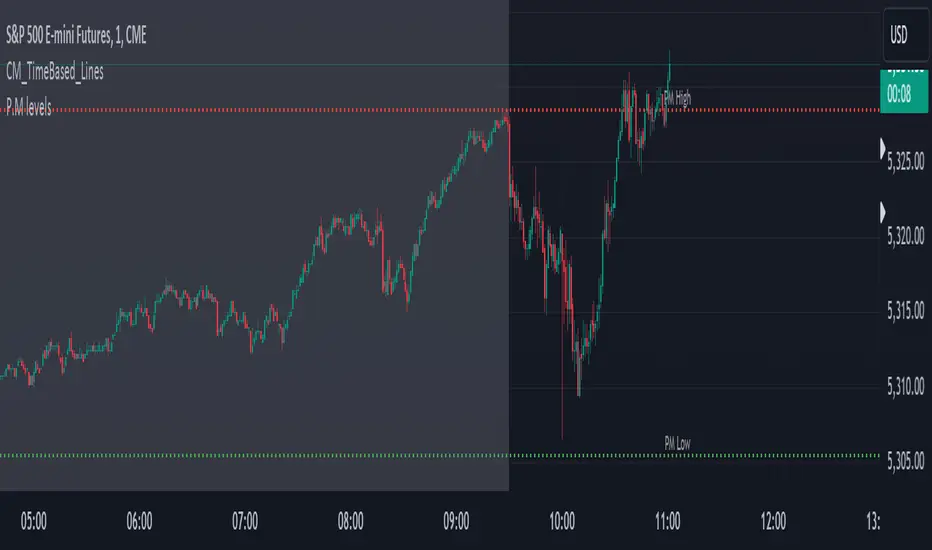
Pre-Market levels for Futures This indicator draws the Pre-Market Low and High for futures. Futures do not really have "P.M" because they are almost always open, but I chart /ES and trade $SPY options, so this has been useful in finding P.M levels.
Futures
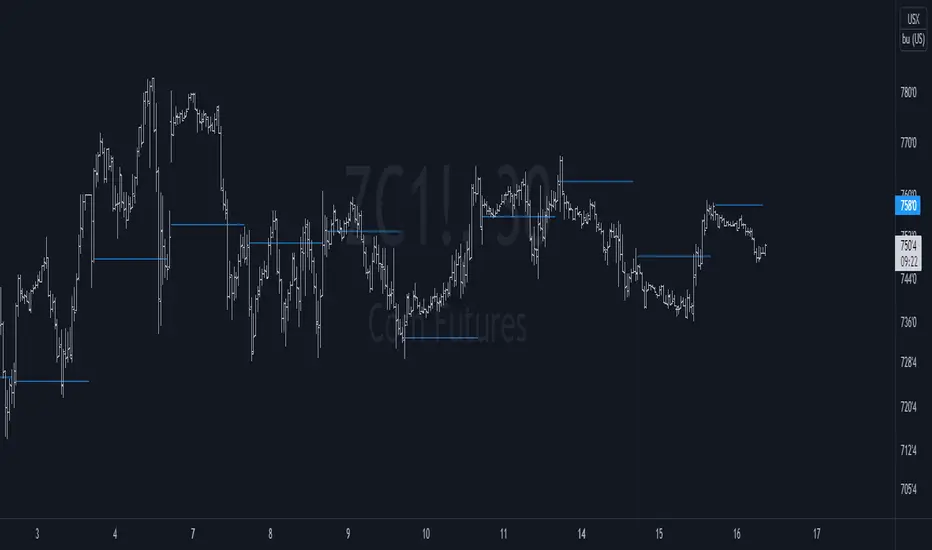
FCPO IntradayThis script is specially developed for the reference of Crude Palm Oil Futures ( CPO ) market traders.
Before using this script, traders need to know a few important things, namely:
1. Use of this script is limited to the Crude Palm Oil Futures ( CPO ) market only;
2. The appropriate time-frame for the purpose of using this script is 30 minutes.
Procedures for using indicators.
1. The line on the trading day will only be known after the first candle is completed, i.e. at 10:59:59 am;
2. Then, key in order.
Entry.
The recommended max Entry is once Long and once Short only on the same day.
Long.
1. Traders can only make a purchase when the market price hits the green line;
2. If traders hold a long position, traders can make a sale to close the long position when the price hits the blue line.
Short.
1. Traders can only make a sale when the market price hits the red line;
2. If traders hold a short position, traders can make a purchase to close the short position when the price hits the orange line.

ICT Index Futures Session LinesICT Index Futures Session Lines
Description:
The script is based on one of ICT's concepts on trading Index Futures. The script lays out the daily range from an intraday basis.
Range:
00:00 - New York Midnight
08:30 – New York Open (News events come out)
12:00/13:00 - New York Lunch (No trade time period)
13:30 - (Algorithm)
16:30 - Close
* The open, high and low lines are plotted from 00:00 to 08:30
How To Use:
You will need to check the daily bias. Prior to 8:30 you are to look for previous swing points where liquidity may exist. During the open you want to see if a high or low is taken out, and then wait for an energetic break/displacement for a potential FVG/imbalance retracement entry.
Strategy is for LTF (1 to 15m)
Default time zone is set to America/New_York (UTC New York), so lines will be plotted correctly regardless of user’s local UTC chart setting.

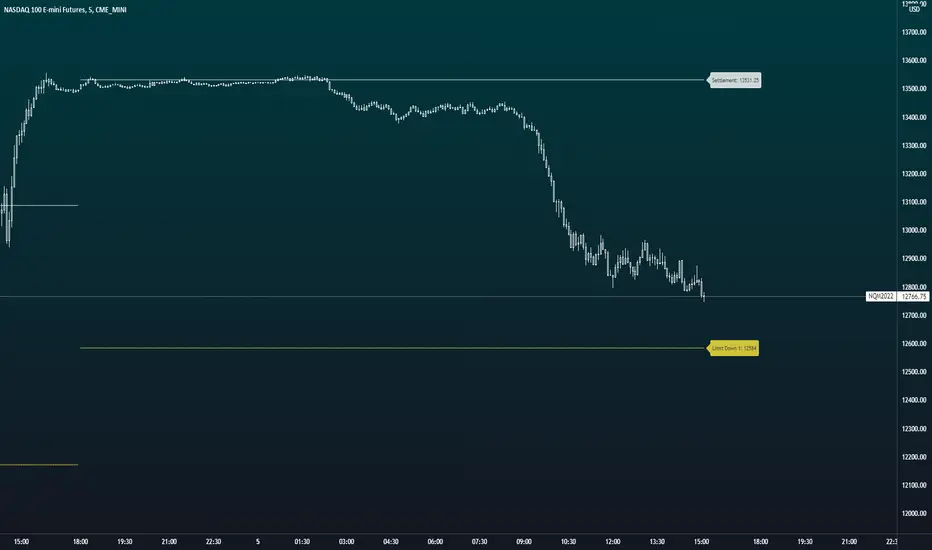
U.S. Futures Price LimitsThis scripts plots settlement and the circuit breaker limits for U.S. Equity Indexes. The current limits for the equity index futures are + and - 7%, 13%, and 20% from the previous day's settlement price. If price reaches these levels trading is either paused briefly or for the remainder of the day. The full resource (CME Website) is below.
There are plans to add the remainder of the most actively traded U.S. Futures Markets.
To find out more about the price limits it is best to use the CME's website as a reference.
www.cmegroup.com
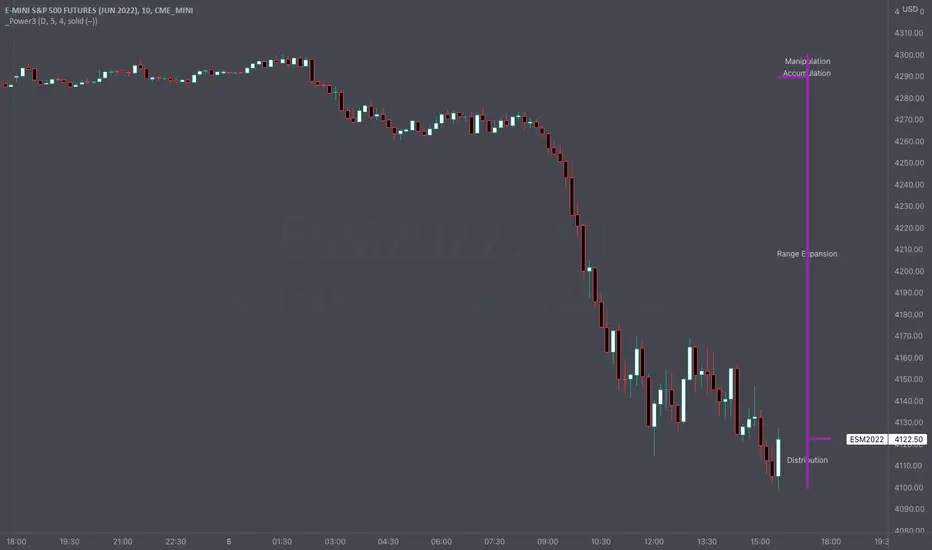
Intraday Power 3 VisualDescription
This indicator draws a dynamic "Open High Low Close" type visual on intraday charts so the trader can easily keep track of the daily/weekly movement. This indicator was inspired by the Inner Circle Trader’s (ICT) “Power 3” concept, which is Accumulation, Manipulation, and Distribution of price on a daily timeframe.
Visual
This indicator plots the chosen timeframes opening price along with a live line for the current price. This makes it very easy to identify the daily/weekly range along it’s open. And the user can combine this indicator with my other indicator “Futures Exchange Sessions” to plot the midnight EST & 8:30 AM EST lines to get a great summation of over night price action.
Inputs and Style
In the Input section the user can dynamically switch between Daily and Weekly timeframes. Built in ability to move the entire Visual to the right makes preventing indicator overlap a breeze. All of the lines can be configured: color, style, and width. Independently toggle ON/OFF the Power 3 labels (Accumulation, Manipulation, Range Extension, Distribution) and can change labels color. The labels dynamically move and switch positions based upon bear or bull daily/weekly range.
Special Notes
The Futures market is open 23/5. It is closed everyday for 1-hour at 5pm EST and closed over the weekends. Because this Intraday Power 3 Visual is drawing in the 'future' on the users TradingView chart, when the visual is close or in a time when the market is closed, the visual doesn't behave properly. This is because TradingView doesn't display times when the Market is closed, thus the drawings cannot be displayed during those times. There is nothing wrong with the script. Please wait until the Market is open and the visual will be drawn normally.
This indicator is intended for use in the Futures Market
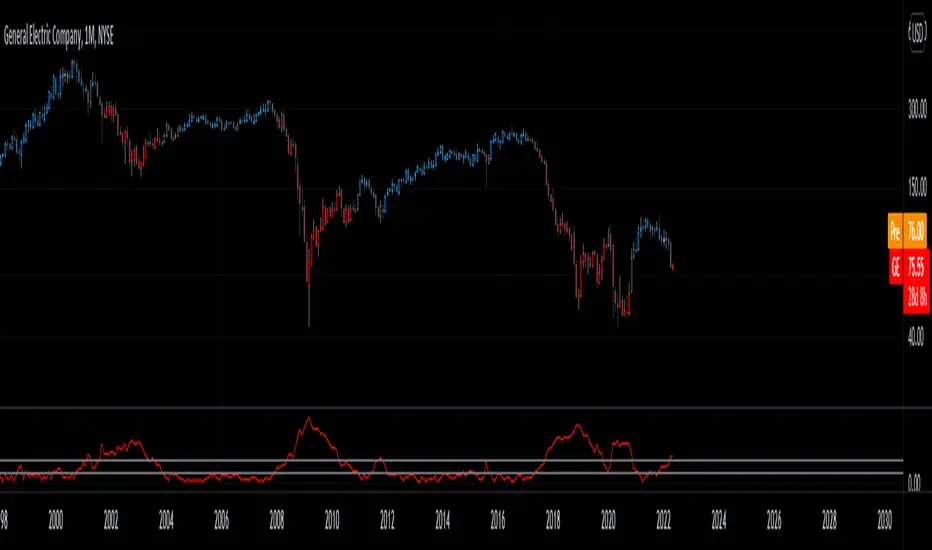
VIX FixSistema de trading hecho por Larry Williams, basado en VIX, optimizado para cualquier activo.
Formula:
(Highest (Close, 20) - Low) / (Highest (Close, 20)) * 100
Donde “Highest (Close, 20)” representa el cierre mas alto de los ultimos 20 periodos
Larry Williams Mechanical Trading System based on VIX.
The VIX Fix applies the same general formula that is used to calculate the stochastic indicator, so can be used for any asset:
(Highest (Close, 20) - Low) / (Highest (Close, 20)) * 100
Where “Highest (Close, 20)” means the highest closing value in the past 20 periods and the low refers
to the current period’s low. The formula can be applied to any timeframe.
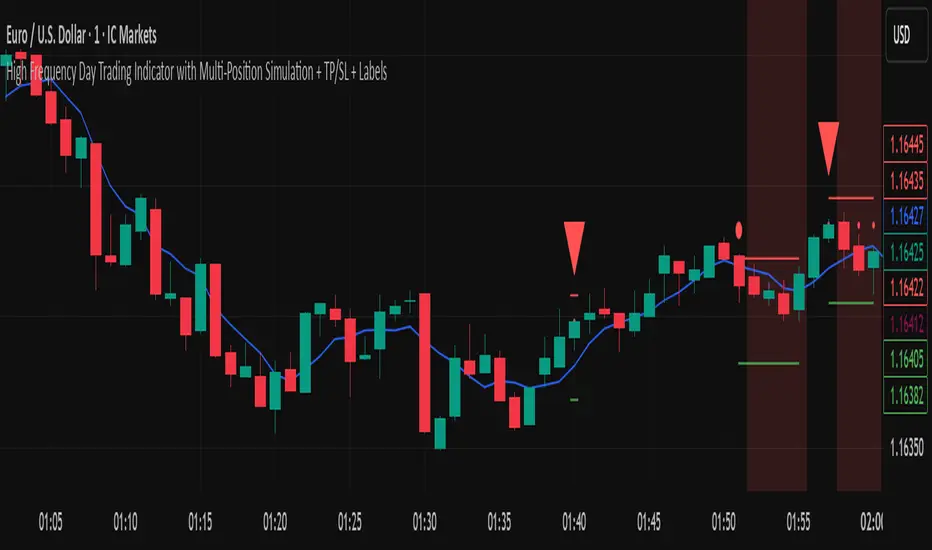
High Frequency Day Trading IndicatorMentioned Indicator uses RSI, Stoch RSI, SMA, EMA, SMMA, Double EMA to check for quick buying and selling areas for Day Trading.
For utilizing the tool, you'll need to wait for a Possible Trend Reversal (Represented by Triangle) and a confirmation to go Long by using a combination of Moving Averages which are then represented by circular dots on chart upon Bar Closure.
For Stop Loss once can simply place a Stop below/above the last Low/High respectively.
This trading Indicator is only recommended for high frequency trading on smaller time frames if you're using a highly volatile Coin/Asset Class.
Disclaimer: Please use this indicator in Test Environment to get a hold of concepts of this indicator. We do not advise using 100% capital for each order, as a matter of fact, we only recommend a risk of upto 1% on each position so Risk to Reward is maintained in proper sense. Please use Stops with all indicators and do not ever use an indicator without stop losses to save your capital.
NOTE: Indicator can be developed further to be used Trading Bots such as 3commas, Autoview, Wunderbit Bot, and Trailing Crypto Bots. For configuration of Automation Bots, you can contact us here on tradingview itself! :)
Futures Exchange SessionsIn the 24-hour trading of the futures market, this indicator provides the user with full customization concerning the most important factor: time. This indicator is centered around three main visualizations: labels, backgrounds, and lines that minimalistically allows the user to keep track of the many time intervals that occur during a futures market 24-hour trading cycle. It also artfully displays the previous days highs and lows. And everything can be individually toggled and configured so the user can get exactly what they want.
Labels
There are three main futures market sessions in a 24-hour period: the London, New York, and Asian Sessions. Each session is given an independent label for the open and close times. The six labels (LO, LC, NYO, NYC, AO, AC) can be individually toggled on or off, the label background color changed, the text switched between black or white, and the height can be lowered or raised. These customizations are intended to give the user full control of the session they are interested in at the moment.
Backgrounds
Backgrounds are the heart of this indicator. There are different colored transparent backgrounds for each of the futures sessions. So the user can clearly see the session they want to highlight without cluttering their chart and getting in the way of analyzing the candles.
If you are familiar with the London and New York killzones, these backgrounds are each individually configured.
If you are familiar with the Inner Circle Trader’s (ICT) NY Morning and Afternoon sessions, these are available. Also, most times weird price action occurs during the lunch hour of these sessions. The London and New York have a background for their respective lunch hours so the user is never caught of guard during these periods.
Lines
The markets are constantly looking for liquidity. To help the user see runs on liquidity, this indicator projects the previous days highs and lows on to the current day with a line and a price label. The line make it very easy to see where price may be headed. See the image below for the perfect example of this phenomenon. Each of the lines can be independently controlled by color, style, and width. And even the labels can be toggled on or off if the user would prefer just to see the lines. Lastly, there is a line that marks the midnight open price in EST.
Special Notes
This indicator is specifically designed for futures tickers.
All of the backgrounds are not designed to be turned on a once (there are many that overlap). They are designed to give the user ultimate control over exactly what timeframe backgrounds to display on their charts.
The labels only appear when timeframe is 1 hour or less.

Future TimevalueThis indicator plots a chart of future timevalue for all NSE index and NSE FNO Stock. It plots the difference of future and spot's 1min candle close price.
Just open any index or stock spot chart in 1 min timeframe(works with higher tf also) and add the indicator.

ICT Index Futures Vertical LinesLearning to trade is complicated enough, so to make the process it little less daunting, I decided to create something helpful.
This indicator relieves you of drawing the same lines and levels over and over each trading day.
It also provides key price levels for you to watch when the trading session starts.
This project is inspired by the ICT 2022 Mentorship.
This indicator was designed and tested to practice and trade the CME Index Futures like Nasdaq, S&P500 and the DOW.
The concepts by ICT are known to work on other markets like Crypto, but I haven't tested that so use at your own risk.
Features:
When a new trading day starts, the following lipstick is put on the chart:
Vertical lines:
- Globex (Overnight) Session Start @17.00
- New York Midnight @ 00:00
- New York AM Session Start @ 08.30
- CME Open @ 09.30
- New York Lunch Start @12.00
- New York PM Session Start @13.00
- New York PM Session End @ 16.30
Important levels:
- Globex (Overnight) Session Opening price
- Globex (Overnight) Session High
- Globex (Overnight) Session Low
- New York Mignight Opening Price
Additional features:
- Shows the day of the week at the bottom for your convenience
- London Killzone Vertical lines
- London Killzone Highlight
- NY Lunch No-Trade-Zone Highlight
- Important levels have a small label to show their meaning and price
- Almost everything is customizable: colors, line types, times, etc
- Customizable timezone setting in case you don't want to work on ICT's recommended timezone (New York UTC-4)
- Toggle to Show only Today's drawings on the chart. You can choose to display all chart lipstick from almost a month of trading data to do your research. Ideal if you want to determine the daily profiles for example.
Screenshots:
London Killzone Highlight turned on:
Multi Day Lipstick:

Settlement priceThis script is meant to be used intraday, on futures products.
It charts the previous day/week/month settlement price as a constant level intraday.
The settlement price of a product is calculated by the exchange at the end of each day. It is shown in the D/W/M chart as the close price. The settlement price does not coincide with the last close price intraday, thus creating the need of a script like this.
The settlement price can be a pivotal price in intraday futures trading, as it can act as support or resistance
You can select the resolution of the settlement by the "Resolution" input

Binance Futures/Spot PriceShows the last price of either the spot or futures market on Binance, for the current coin.
It shows futures if you are in a spot market, and spot if you are in futures.
Currently this only works for USD stable coin pairs (BUSD, USDT, USDC, ...).
I don't plan to add COIN future pairs, it's not useful to me.
Additionally, it allows you to show the lowest and highest traded price (in the opposite market you are currently on: spot/futures) for a given period, and the respective chart, if you are into that sort of thing.
Bye :D

FX Mini-Day/Index Dividers V2This is a combination of the Mini-Day Separator Indicator, timings based off the research by Tom Henstridge/@LiquiditySniper and additional Index KZ delineations, based on ICT's 2022 Youtube Mentorship.
*It borrows some minor code from Enricoamato997 . Credit where it is due!
This is a joint effort by myself, @vbwilkes / Offseason Vince and @Tom_FOREX / TraderTom on the Index/Index Future portion.
Index Future Example
Forex Example

Session Levels - Ultimate Range IndicatorSession Levels - Ultimate Range Indicator
Primarily developed for trading the E-MINI Futures Markets like NQ or ES from the CME Group,
but also more than suitable for Crypto or other instruments.
This indicator highlights the chosen session, which can be Globex, Asian, London and New York.
It plots the important levels and also renders the Opening Range as it forms (a.k.a. Initial Balance).
After the 1st hour Opening Range is finished, it can plot the Standard Deviations / Projections.
See below for a complete feature list.
All Opening Ranges on chart and for the New York session the Range Projections are turned on:
s3.tradingview.com
How to use (example):
If you are trading the Nasdaq Futures (NQ!)
Enable the Globex Overnight session. Basically in the Futures Market, the Globex session is everything outside of US trading hours of Stocks. This draws the important overnight levels, like the Low, 25%, 50%, 75% and the High.
Enable the New York Session with Levels and Opening Range. Generally, 70% of the time the 1st hour will put a Low or High of the day.
If the price is trading above the Globex Low, most likely the Low of the Day is formed and the price target for the day will be 1.5x Standard Deviation and 2x Standard Deviation.
[*} Deviation of the Initial Balance depends on the volume ad overall market structure.
** This is not financial advice or any guarantee **
Features:
Show each Session Highlighted on Intraday chart in it's own color (each session can be turned off and has customizable times and color)
Show Line Levels of each session: Low, 25%, 50%, 75% and the High (customizable color)
Show the Opening Range (Initial Balance) of the Asian, London and New York session. Note: NY has more options.
Opening Range is displayed as a box with level lines (customizable color)
Levels are drawn to the end of the NY Cash session (customizable time)
Show IB Standard Deviations 0.5 - 3.0. Calculated from the Opening Range (Initial Balance)
Option to display Higher Timeframe levels: Previous Day Open/Close and Previous Week Open/Close
All level lines and OR boxes size dynamically as the session progresses
Built in Alerts for when price hits key levels. e.g. Alert when price crosses the NY Opening Range High. Or an Alert when the first STDEV is hit.
Option to toggle display of drawings for Today's trading session only, or Show all recent session levels. This keeps the chart clean or not.
Extras:
The NY Opening Range also has a 50% level line
The NY Opening Bar can be highlighted separately
The Level Lines can have small labels turned on/off. Values are only shown on mouse over to keep a clean chart
Keep in mind:
1) This indicator works on all instruments, but on instruments with limited market hours, your chart setting
has to be set to "Extended Hours" otherwise. For example TSLA on NASDAQ.
2) The Exchange Time Zone for the CME Group is Chicago UTC-6. So the session times you configure in the settings menu are based on that timezone too.
3) Globex opens at 5pm CST and closes when the US session starts 8:30CST.
4) When enabling the Alerts in the Indicator settings, be sure to also create an alarm for this indicator using the Alarm function of Tradingview.

BTC Futures BasisShows various basis percentages in a table and plots historical basis. Also has an alert function for backwardation events. Useful for tracking bullish/bearish sentiment in BTC futures markets.
*Currently displays March and June futures for the following exchanges: Bitmex, Binance, Deribit, Okex, and FTX
Also displays CME Continuous Next Contract. All of the symbols are customizable.
-----------
Market-wide backwardation usually occurs during a heavy sell-off (such as a liquidation cascade).
**For getting alerts of backwardation events, I recommend creating an alert on the 1 minute chart with the condition "Any alert() function call". Alert level is customizable as well.
-----------
*NOTE!! : Futures contracts expire (obviously), so the contract symbols will need to be updated periodically. I will try to keep them updated going into the future.
**NOTE2!! : The alert() function does not track the CME contract. This is to avoid false triggers.

Market StatsThis script escapes much of the subjective technical analysis and discretionary trading in general. With this Script/Indicator, you will be able to have access to the statistics tested day by day in the markets, statistics that will be a decisive support in your trading plan. Its analysis and creation is based on the quantitative trading system, since these statistics have a testing and database behind, which makes it a potential indicator for your trading.
You can change the time of the market you want to operate, also the colors of the labels of the statistics, their distance, color of the letters, fully editable to adapt it to the type of market you operate.
Its design involves values of the previous session ( RTH ) and extension session (OVERNIGHT), so it will be complemented with markets that are assimilated to that configuration (indices, stocks, futures, CFDs, forex, commodities ) maybe you can adapt it with cryptocurrencies, but being 24/7 you would have to modify its schedule.
Important levels included:
YHOD: Yesterday High of Day
ONH: Onvernight High
ONM: Overnight Mid
YPOC: Yesterday Point of Control
HALFGAP: Close Price Mid
GAP: Yesterday Close Price
ONL: Overnight Low
YLOD: Yesterday Low of Day
IBH: Initial Balance High
IBL: Initial Balance Low
The IBH and IBL levels will appear after 60 minutes into the session, indicating our balance zone. The one that will add more statistics to our trading.
_________________________________________________________________________________________________________________________________________________________________________________________________________
Este script, escapa mucho del análisis técnico subjetivo y del trading discrecional en general. Con este Script/Indicador, podrás tener acceso a las estadísticas testeadas día a día en los mercados, estadísticas que serán un apoyo decisivo en tu plan de trading. Su análisis y creación se basa en el sistema de trading cuantitativo, ya que estas estadísticas, tienen un testeo y base de datos por detrás, lo cual lo hace un indicador potencial para tu trading.
Podrás modificar el horario del mercado que quieres operar, también los colores de las etiquetas de las estadísticas, su distancia, color de las letras, completamente editable para que lo adaptes al tipo de mercado que operas.
Su diseño implica valores de la sesión anterior ( RTH ) y sesión de extensión (OVERNIGHT), por lo que se complementará con los mercados que se asimilen a esa configuración (índices, acciones, futuros, CFDs, forex, commodities ) quizás lo puedas adaptar con criptomonedas, pero al ser 24/7 habría que modificar su programación.
Niveles importantes incluidos:
YHOD: Yesterday High of Day
ONH: Onvernight High
ONM: Overnight Mid
YPOC: Yesterday Point of Control
HALFGAP: Close Price Mid
GAP: Yesterday Close Price
ONL: Overnight Low
YLOD: yesterday Low of Day
IBH: Initial Balance High
IBL: Initial Balance Low
Los niveles de IBH y IBL, aparecerán después de 60 minutos iniciada la sesión, indicando así́, nuestra zona de balance. La que agregará más estadísticas a nuestra operativa.

NCTA Aurora SystemAurora System
This system is designed to present a simple view of trending signals. The signals within the Aurora System will alert the beginning of a possible new trend. The signals also indicate when a trend is continuing or weakening, which advises the trader to adjust their stop or exit the trade. If the trend resumes, the system will print a new confirmation of an entry.
When traded properly, using a 2-3 timeframe alignment, the system will display both trending trades, which anticipate a potentially longer move, or catch trades which are likely shorter moves, which at times may be counter trend, so traders will be looking for a smaller profit.
There are two settings, CXA and PBA. CXA is more sensitive to triggering possible entries while PBA is more conservative. The system will display on the indicator which “mode” is set, CXA or PBA.
How to Use:
When the first red bar appears, labeled with a “S”, go short. This is indicating the start of a possible short trend.
When the first blue bar appears, labeled with a “L”, go long. This is indicating the start of a possible long trend.
White bars indicate a neutral or no trend.
This system can be used individually on a single time frame, but reduces chop and noise when used on a combination of time frames such as an alignment between the 3 minute and 10 minute chart for intraday trading.
3 Minute and 10 Minute Alignment Example:
For example: When the 10 minute PBA signal appears (Red bar with “S” or Blue bar with “L”), monitor the 3 minute chart for a confirmation of that signal (Red bar with “S” or Blue bar with “L”) and enter based on the 3 minute chart
At times, the 10m will first print when the 3m is on a retracement. It may take another 3 - 6 min before the 3m signals a valid entry
Exit when 10m PBA signal stops (could be a white bar or just a blank space on the indicator)
Next Bar Alert:
Included is an optional "Next Bar Alert" setting. Since many of these signals benefit from very prompt action at the beginning of a price bar, there is an additional option in Settings to set an arbitrary number of seconds to be alerted before the next price bar opens. Simply set this to a level you prefer, then set an alert in TradingView on the indicator using the "Next Bar Alert" alert parameter.

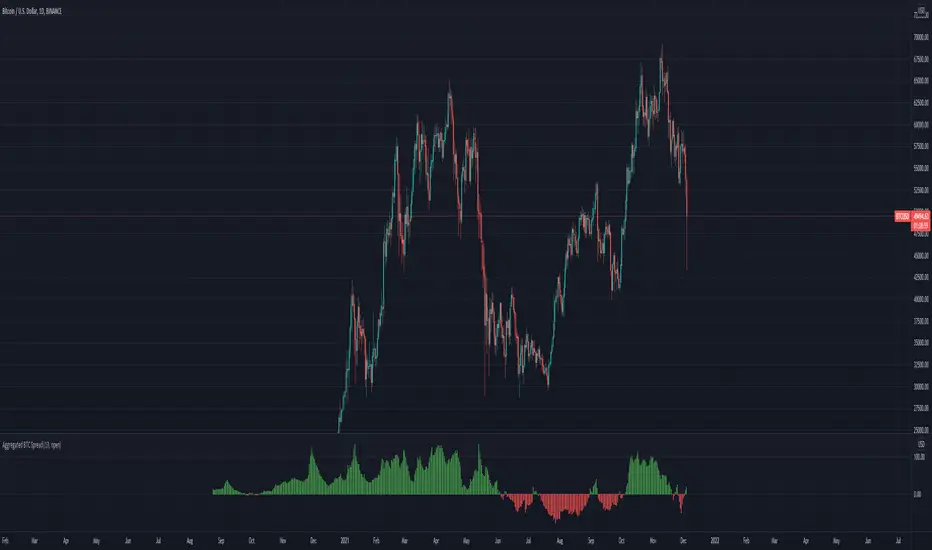
Aggregated BTC SpreadThis script is used to aggregate the bitcoin spread on futures contracts on different platforms.
It works by averaging the for every selected exchange, and apply an EMA of .
It is supporting
Binance (USD / USDT)
Okex
FTX
Huobi
Deribit
Ascendex
CME (BTC1!)
Stochastic DotsThese Stochastic Dots can help show potential turning points and cycles in the market.
- The smaller dots are based off of a faster moving stochastic
- The bigger dots are based off of a longer moving stochastic
- Dots below the candle/bar are bullish
- Dots above the candle/bar are bearish
This indicator is not meant to be traded by itself. Use other forms of confluency and confirmation with it.
If you're interested in more customized indicators to suit your needs, feel free to message me.
Confluence CandlesThis indicator looks for confluence among three indicators (RSI, Stochastic, and MACD), a strategy popularized by Markus Heitkoetter in his book, “The PowerX Strategy: How to Trade Stocks and Options in Only 15 Minutes a Day”, and expands it to look for agreement on up to four symbols.
Each indicator is configurable in the settings, as well as the ability to choose which of the indicators are used.
Default Logic
Green Candles
RSI > 50
Stochastic > 50
MACD Histogram > 0
Red Candles
RSI < 50
Stochastic < 50
MACD Histogram < 0
When multiple symbols are selected, the above needs to be true for all selected symbols.
Example Use Cases
- Setting the indicator to the Nasdaq 100 (QQQ or NQ1!) while trading a stock that is part of that index such as AAPL or TSLA
- Setting the indicator to multiple indexes that tend to move together in order to trade one of them since they tend to make stronger moves when moving together (ex. SPY & QQQ, or ES1! & NQ1!)
- Setting the indicator to Bitcoin while trading a smaller crypto pair that moves as a sympathy play.
Tip
If you have trouble finding the full name for a specific instrument from an exchange such as BTCUSD from Coinbase, you can bring up TradingView’s “Symbol Search” pop-up modal, enter your search term, use the down arrow key on your keyboard to move the focus to the symbol you want, and you will see the full name in the search field such as “COINBASE:BTCUSD”.

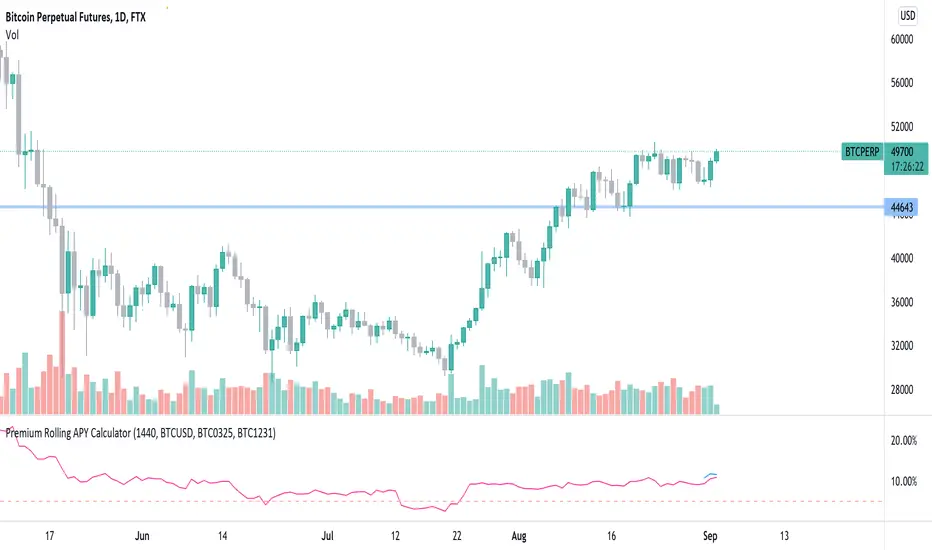
Premium Rolling APY CalculatorThis script can see the rolling APY of future premiums calculated based on the remain days to expire date.
By default you can see the rolling APY for FTX BTC0924, and APY for BTC1231. You can also change the symbol from chart settings to whatever you need and still calculate in the same way.
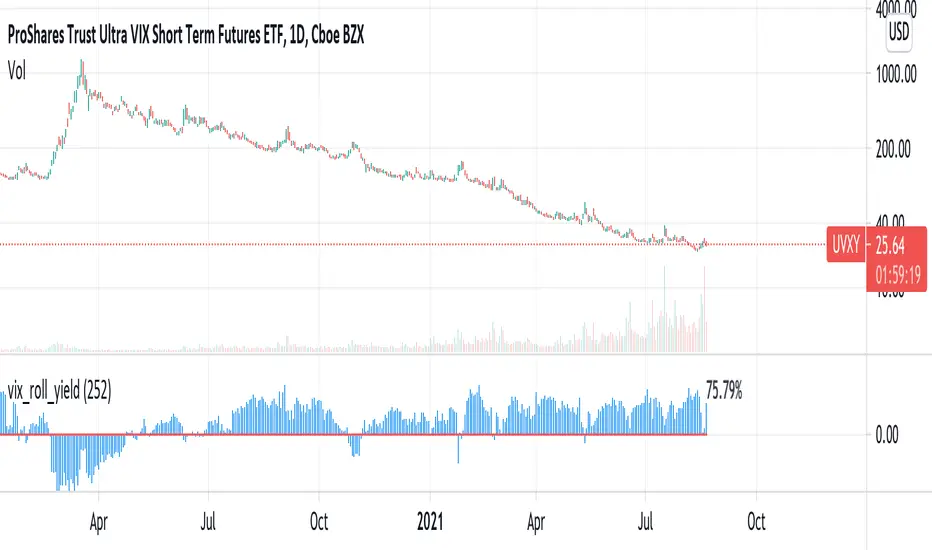
vix_roll_yieldShows the roll yield of the VX futures, which is the ratio of a continuously weighted average of the front two months to the VIX. The VX (VIX futures) contract expires on the third Tuesday of each month. On the next trading day, the front month will have full weighting, and the second month will have no weight. On the expiration day, the back month will have full weighting and the front month will have no weight. In between, the weight gradually shifts.
This weighted average is similar to the SPVIXSTR index that UVXY and several other funds track. When the average is below the VIX, the indicator is negative, and the front month contract will tend to gain value relatively more rapidly than the back month as it converges upward to the VIX spot price. Because funds whose NAV is tied up in VX contracts continuously roll from the (typically cheaper) front month to the back, in situations where the front month is more expensive than usual--or even more expensive than the back month--these products may have a "tailwind". In this case, they are selling expensive front month contracts to purchase cheap back month contracts.
Ordinarily, VIX funds have a "headwind." The roll yield is positive, the front month is cheap, and the back month is expensive. Day by day the funds sell cheap front month contracts and buy expensive back month contracts, which, in turn and over time, become the front month and converge with the VIX, losing value rapidly. This is a brief explanation about the decay of these products.