DTCC RECAPS Dates 2020-2025This is a simple indicator which marks the RECAPS dates of the DTCC, during the periods of 2020 to 2025.
These dates have marked clear settlement squeezes in the past, such as GME's squeeze of January 2021.
------------------------------------------------------------------------------------------------------------------
The Depository Trust & Clearing Corporation (DTCC) has published the 2025 schedule for its Reconfirmation and Re-pricing Service (RECAPS) through the National Securities Clearing Corporation (NSCC). RECAPS is a monthly process for comparing and re-pricing eligible equities, municipals, corporate bonds, and Unit Investment Trusts (UITs) that have aged two business days or more .
At its core, the Reconfirmation and Re-pricing Service (RECAPS) is a risk management tool used by the National Securities Clearing Corporation (NSCC), a subsidiary of the DTCC. Its primary purpose is to reduce the risks associated with aged, unsettled trades in the U.S. securities market .
When a trade is executed, it is sent to the NSCC for clearing and settlement. However, for various reasons, some trades may not settle on their scheduled date and become "aged." These unsettled trades create risk for both the trading parties and the clearinghouse (NSCC) because the value of the underlying securities can change over time. If a trade fails to settle and one of the parties defaults, the NSCC may have to step in to complete the transaction at the current market price, which could result in a loss.
RECAPS mitigates this risk by systematically re-pricing these aged, open trading obligations to the current market value. This process ensures that the financial obligations of the clearing members accurately reflect the present value of the securities, preventing the accumulation of significant, unmanaged market risk .
Detailed Mechanics: How Does it Work?
The RECAPS process revolves around two key dates you asked about: the RECAPS Date and the Settlement Date .
The RECAPS Date: On this day, the NSCC runs a process to identify all eligible trades that have remained unsettled for two business days or more. These "aged" trades are then re-priced to the current market value. This re-pricing is not just a simple recalculation; it generates new settlement instructions. The original, unsettled trade is effectively cancelled and replaced with a new one at the current market price. This is done through the NSCC's Obligation Warehouse.
The Settlement Date: This is typically the business day following the RECAPS date. On this date, the financial settlement of the re-priced trades occurs. The difference in value between the original trade price and the new, re-priced value is settled between the two trading parties. This "mark-to-market" adjustment is processed through the members' settlement accounts at the DTCC.
Essentially, the process ensures that any gains or losses due to price changes in the underlying security are realized and settled periodically, rather than being deferred until the trade is ultimately settled or cancelled.
Are These Dates Used to Check Margin Requirements?
Yes, indirectly, this process is closely tied to managing margin and collateral requirements for NSCC members. Here’s how:
The NSCC requires its members to post collateral to a clearing fund, which acts as a mutualized guarantee against defaults. The amount of collateral each member must provide is calculated based on their potential risk exposure to the clearinghouse.
By re-pricing aged trades to current market values through RECAPS, the NSCC gets a more accurate picture of each member's outstanding obligations and, therefore, their current risk profile. If a member has a large number of unsettled trades that have moved against them in value, the re-pricing will crystallize that loss, which will be settled the next day.
This regular re-pricing and settlement of aged trades prevent the build-up of large, unrealized losses that could increase a member's risk profile beyond what their posted collateral can cover. While RECAPS is not the only mechanism for calculating margin (the NSCC has a complex system for daily margin calls based on overall portfolio risk), it is a crucial component for managing the specific risk posed by aged, unsettled transactions. It ensures that the value of these obligations is kept current, which in turn helps ensure that collateral levels remain adequate.
--------------------------------------------------------------------------------------------------------------
Future dates of 2025:
- November 12, 2025 (Wed)
- November 25, 2025 (Tue)
- December 11, 2025 (Thu)
- December 29, 2025 (Mon)
The dates for 2026 haven't been published yet at this time.
The RECAPS process is essentially the industry's way of retrying the settlement of all unresolved FTDs, netting outstanding obligations, and gradually forcing resolution (either delivery or buy-in). Monitoring RECAPS cycles is one way to track the lifecycle, accumulation, and eventual resolution (or persistence) of failures to deliver in the U.S. market.
The US Stock market has become a game of settlement dates and FTDs, therefore this can be useful to track.
FTD

(FTD) Follow-Through Day SignalFollow-Through Day (FTD) Signal
This indicator detects potential Follow-Through Days (FTDs) — a concept popularized by William O’Neil — to help identify possible market trend confirmations.
A Follow-Through Day occurs when an index shows strong upside action on higher volume several days after a market low, suggesting institutional buying rather than short covering.
How it works:
The indicator checks for a session where the price gains a defined minimum percentage from the prior close (default: 1.2% or more).
Volume must be greater than the previous day’s volume.
The rally must occur at least three days after a recent low, determined by the lookback period (default: 20 days).
Additional safeguards require that recent bars are not making new lows and that the bar three days prior either closed positive or was not at a new low — filtering out false signals from oversold bounces.
When all conditions are met, a blue up arrow is plotted beneath the bar, and an optional “FTD” label appears if enabled.
Inputs:
Min % Gain from Previous Close (%): Sets the minimum daily percentage gain to qualify as a Follow-Through Day.
Lookback Period for Lowest Low Checks: Defines how many bars back to search for a recent market low (default: 20).
Show Signal Label: Toggles the on-chart “FTD” label display.
Usage:
This indicator is intended for use on daily charts of major market indexes — such as the Nasdaq Composite (symbol: IXIC) or broad index ETFs including QQQ, SPY, and DIA — where Follow-Through Day signals are most relevant for confirming potential trend reversals.

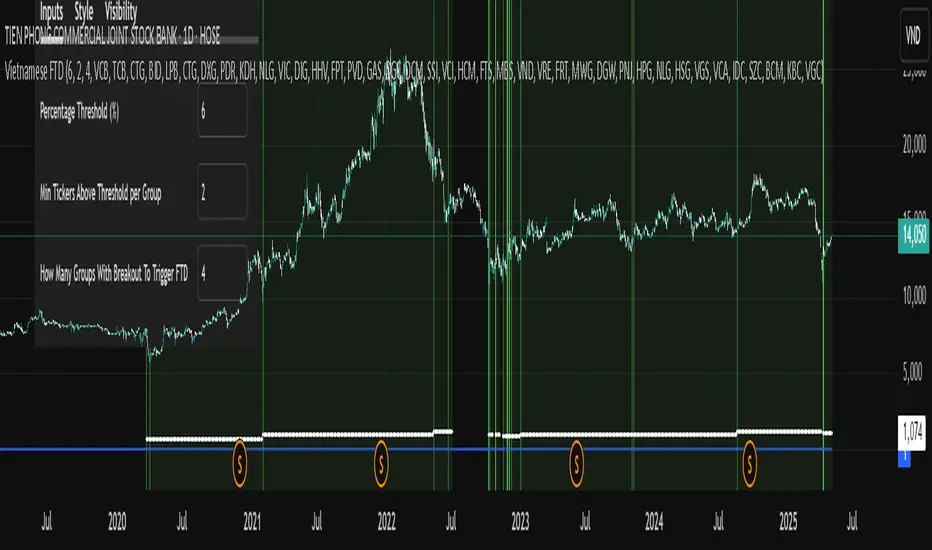
Vietnamese Stock Market FTD (Follow Through Day) AlertA Pine Script implementing William O'Neil’s Follow Through Day (FTD) strategy for the Vietnamese stock market. It scans 7 predefined sector groups (Banks, Real Estate, Retail, etc.) to detect momentum breakouts.
Key Features :
Triggers an FTD signal when ≥X groups (default: 3) have ≥Y stocks (default: 2) rising above a Z% threshold (default: 5%) daily.
Highlights qualifying stocks by group in a dynamic label during alerts.
Visualizes strength via histograms and background shading.
Open-source under Mozilla Public License 2.0 .
Purpose : Identify institutional buying and potential market reversals.
Follow Through Day (FTD) + Sweep [TrendX_]The Follow Through Day (FTD) + Sweep indicator is a Trend-following tool mixing William O'Neil's original FTD concept and Liquidity concept. This indicator helps you identify potential subsequent bullish trends with greater precision by combining volume analysis, price action, and liquidity concepts.
💎 FEATURES
Follow Through Day Candle (FTD Candle)
The FTD, pioneered by William O'Neil, serves as a reliable signal for identifying the beginning of new bull markets. It's particularly valuable because it combines multiple market factors - price action, volume, and timing - to confirm genuine market reversals rather than temporary bounces.
The power of the FTD lies in its ability to distinguish between ordinary market fluctuations and significant trend changes. By requiring specific criteria to be met across multiple sessions, it helps filter out false signals and identifies high-probability reversal points where institutional investors are likely beginning to accumulate positions.
Sweep Area
The Sweep area feature enhances the traditional FTD concept by incorporating modern liquidity analysis. This overlay identifies zones where large market participants are likely to trigger stop losses before continuing the trend. These areas often represent optimal entry points for traders looking to join the new uptrend with reduced risk.
🔎 BREAKDOWN
FTD Candle
The FTD formation process occurs in two distinct phases: Setup and Completion.
Setup Phase
Strong Market Decline
The market must first experience a significant downtrend
This selling pressure helps clear out weak hands and creates oversold conditions
The decline creates the potential energy for a powerful reversal
First Recovery Session
Marks the initial sign of buying pressure emerging
Often characterized by a strong reversal candle
Represents the first indication that selling pressure may be exhausting
Recovery Confirmation
The second and third days must maintain prices above the new pivot low
This consolidation period helps confirm the validity of the initial bounce
Shows that sellers are no longer in control of price action
Completion Phase:
Supply Test Session
Low volume indicates diminishing selling pressure
Price remains above the pivot low
Creates the foundation for institutional buyers to begin accumulating
Breakout Day
Price increase exceeds average profit of bullish candles
Volume increases by at least 15% compared to previous session
Shows strong institutional commitment to the new uptrend
Timing Window
Must occur between the 4th and 8th candle after First Recovery Session
This specific timing helps confirm the sustainability of the reversal
Based on O'Neil's research of historical market bottoms
FTD Sweep
The Post-FTD Phase introduces the Sweep concept, which is crucial for understanding how large market participants operate. This feature leverages the liquidity concept because institutional traders often need to trigger stop losses to accumulate larger positions at better prices. This helps:
Create liquidity pools for large position entries
Shake out weak hands before continuing the trend
Test the strength of the new trend by absorbing selling pressure
⚙️ USAGE
Sweep + TP & SL Strategy
Example: BTCUSDT (1D) - Replay back to 9th November 2024
After an FTD candle forms, traders can adopt a systematic approach to enhance their trading strategy. First, they should determine the swing range and convert the post-FTD zone into concrete stop loss and take profit levels, which are based on the price action during the FTD formation. Next, traders should wait for a sweep formation, as this indicates that institutional players are accumulating positions. A quick price rejection from the sweep level should be observed before executing an entry.
The reasoning behind this strategy is rooted in market microstructure. By waiting for the sweep, traders position themselves alongside institutional players who need to build large positions without causing adverse price movement. The sweep creates the liquidity they need, and the subsequent move often represents the true trend continuation.
DISCLAIMER
This indicator is not financial advice, it can only help traders make better decisions. There are many factors and uncertainties that can affect the outcome of any endeavor, and no one can guarantee or predict with certainty what will occur. Therefore, one should always exercise caution and judgment when making decisions based on past performance.
