Liquidity Regime OscillatorThe Liquidity Signal Line is a macro-driven confirmation tool designed to capture the underlying global liquidity regime in a single, smoothed oscillator. It measures the combined directional flow of monetary and financial conditions using high-impact macro data: Federal Reserve assets (WALCL), Treasury General Account (TGA), and the Overnight Reverse Repo facility (RRP) – adjusted by key market proxies such as the U.S. Dollar Index, credit spreads (HYG/LQD), and equity risk appetite (SPHB/SPHQ). These components are normalized, weighted, and then double-smoothed into a stable signal that translates complex liquidity dynamics into a simple 0–100 scale.
Liquidity expansion provides fuel for risk assets, while contraction drains leverage and risk appetite. The Signal Line acts as a confirmation overlay for trend and allocation strategies, showing whether systemic liquidity is broadly supportive or restrictive. Readings above 50 indicate an expansionary environment (risk-on bias), below 50 a contractionary one (risk-off bias). Because the calculation uses higher-timeframe macro data, it can be displayed on any chart to give traders a consistent, regime-aware signal that bridges macro policy and technical execution.
Federal Rezerv Ekonomik Veri

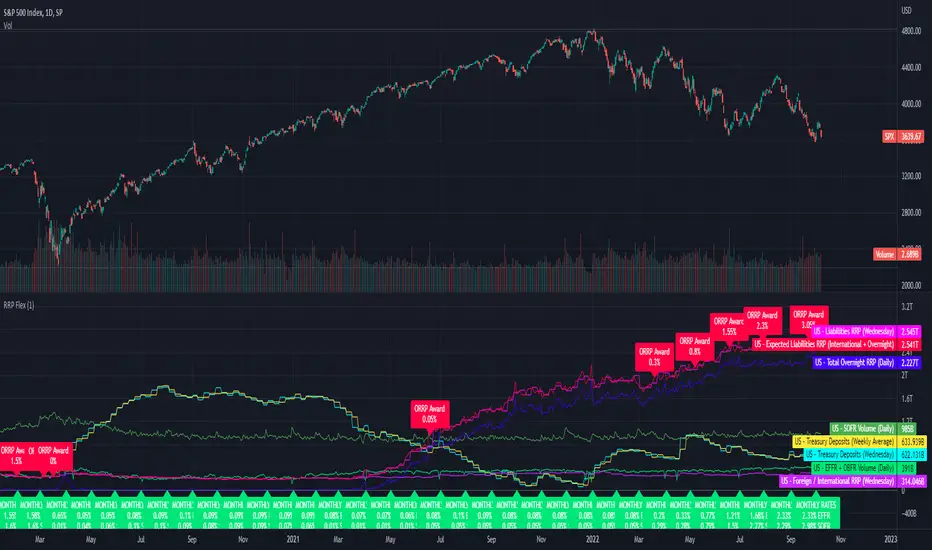
RRP DailyA simple script showing US reverse repurchase agreements and Federal Treasury balance values from FRED.
This script should give a neat overview of how little faith there is in the markets from how much cash is parked in ORRPs.
I made this a while ago as a private script so here it is as a public script.
The indicator is locked to the 1 Day resolution.
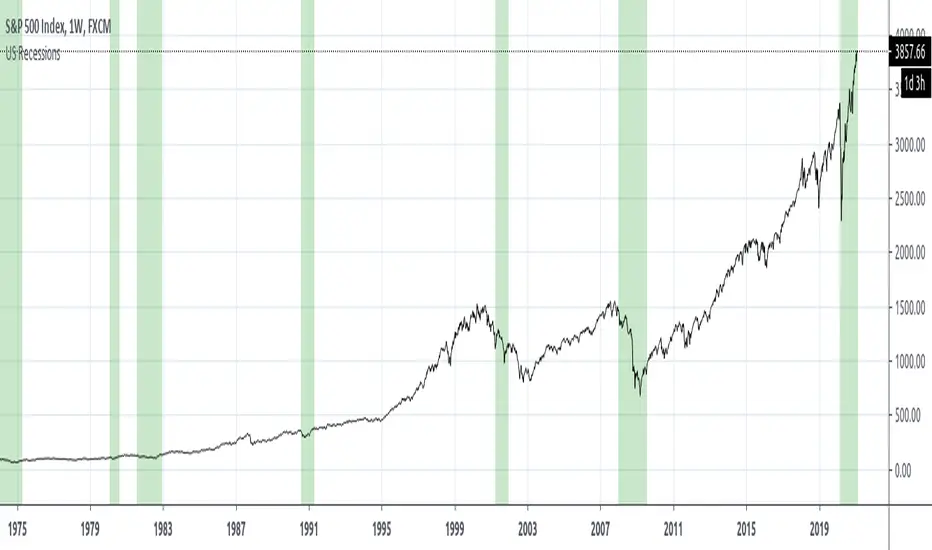
US RecessionsThere are a couple of other Pine Scripts on TradingView that others have kindly contributed but they are presently out-dated because they shade recessions based on manual entries of time. Thanks to the availability of pulling data from QUANDL, we can pull official data from FRED on data like US Recessions.
The FRED series data is taken from is here- fred.stlouisfed.org
"Our time series is composed of dummy variables that represent periods of expansion and recession. A value of 1 is a recessionary period, while a value of 0 is an expansionary period. For this time series, the recession begins on the 15th day of the month of the peak and ends on the 15th day of the month of the trough. This time series is a disaggregation of the monthly series."
This series tracks back to 1854, but good luck finding much of any data on TradingView that goes that far back :)
Libor-EFFRThis is the 3-month Libor minus effective federal funds rate. Traders watch certain spreads for a wider spread to indicate a bad economy.
This is a conceptual indicator that tries to make sense of how important a FRA-OIS spread can be, in this case the Libor-EFFR. It may be completely wrong in calculation and understanding :)
en.wikipedia.org
www.investopedia.com
Libor was derived from the TED Spread less 3-month treasury bills due to Quandl missing updated Libor data.
fred.stlouisfed.org
fred.stlouisfed.org
For the OIS, EFFR is used because it has long historical data and is one of (maybe) the rates used for spread. SOFR was not available at the time but it appears that is what is more common nowadays.
A possible derivative of this indicator would be taking Libor and putting it against something else.
