Fraktal

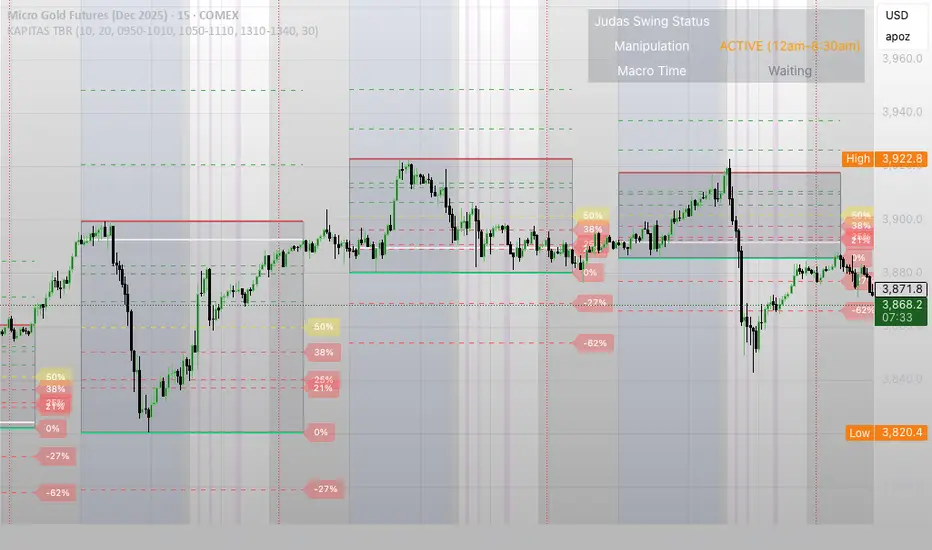
KAPITAS TBR 12am-8:30measures the range between 12am(true day open)-8:30am and has % levels where price is sensitive and likely to reverse
Money Flow Index SignalsThis indicator in daily, weekly and monthly charts can be used to find strong Support, Resistance levels and reversal points. It can be used in lower time frame to find reversal points. When MFI reached 100 either in downside or upside in a candle, if the high is broken take it as a bullish breakout. If MFI is 0 or -0 and the low of the candle is broken take it as a downside breakout.

ICT 369 Sniper MSS Indicator (HTF Bias) - H2LThis script is an ICT (Inner Circle Trader) concept-based trading indicator designed to identify high-probability reversal or continuation setups, primarily focusing on intraday trading using a Higher Timeframe (HTF) directional bias.
Here are the four core components of the indicator:
Higher Timeframe (HTF) Bias Filter (Market Structure Shift - MSS): It determines the overall trend by checking if the current price has broken the most recent high or low swing point of a larger timeframe (e.g., 4H). This establishes a Bullish or Bearish bias, ensuring trades align with the dominant trend.
Fair Value Gap (FVG) and OTE: It identifies price imbalances (FVGs) and calculates the Optimal Trade Entry (OTE) levels (50%, 62%, 70.5%, etc.) within those gaps, looking for price to retrace into these specific areas.
Kill Zones (Timing): It incorporates specific time windows (London and New York Kill Zones, based on NY Time) where institutional trading activity is high, only allowing entry signals during these defined periods.
Signal and Targets: It triggers a Long or Short signal when all criteria are met (HTF Bias, FVG, OTE retracement, and Kill Zone timing). It then calculates and plots suggested trade levels, including a Stop Loss (SL) and three Take Profit targets (TP1, TP2, and a dynamic Runner Target based on the weekly Average True Range or ATR).
In summary, it's a comprehensive tool for traders following ICT principles, automating the confluence check across trend, structure, liquidity, and timing.

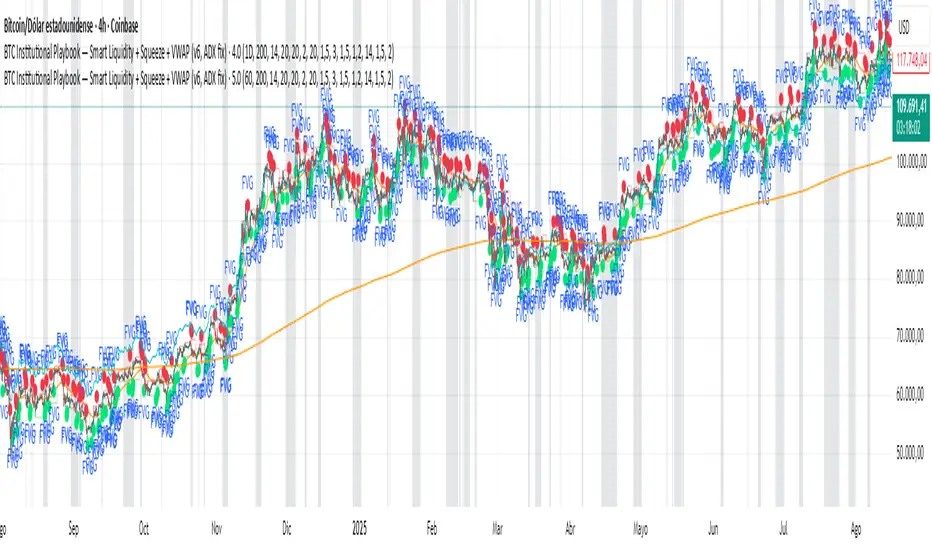
BTC Institutional Playbook Smart Liquidity + SqueezeBTC Institutional Playbook — Smart Liquidity + Squeeze + VWAP (v6, ADX fix)
ORB 15m + MAs (v4.1)Session ORB Live Pro — Pre-Market Boxes & MA Suite (v4.1)
What it is
A precision Opening Range Breakout (ORB) tool that anchors every session to one specific 15-minute candle—then projects that same high/low onto lower timeframes so your 1m/5m levels always match the source 15m bar. Perfect for scalpers who want session structure without drift.
What it draws
Asia, Pre-London, London, Pre-New York, New York session boxes.
On 15m: only the high/low of the first 15-minute bar of each window (optionally persists for extra bars).
On 5m: mirrors the same 15m range, visible up to 10 bars.
On 1m: mirrors the same 15m range, visible up to 15 bars.
Levels update live while the 15m candle is forming, then lock.
Fully editable windows (easy UX)
Change session times with TradingView’s native input.session fields using the familiar format HHMM-HHMM:1234567. You can tweak each window independently:
Asia
Pre-London
London
Pre-New York
New York
Multi-TF logic (no guesswork)
Designed to show only on 1m, 5m, 15m (by default).
15m = ground truth. Lower timeframes never “recalculate a different range”—they mirror the 15m bar for that session, exactly.
Alerts
Optional breakout alerts when price closes above/below the session range.
Clean visuals
Per-session color controls (box + lines). Boxes extend only for the configured number of bars per timeframe, keeping charts uncluttered.
Built-in MA suite
SMA 50 and RMA 200.
Three extra MAs (SMA/EMA/RMA/WMA/HMA) with selectable color, width, and style (line, stepline, circles).
Why traders like it
Consistency: Lower-TF ranges always match the 15m source bar.
Speed: You see structure immediately—no waiting for N bars.
Control: Edit session times directly; tune how long boxes stay on chart per TF.
Clarity: Minimal, purposeful plotting with alerts when it matters.
Quick start
Set your session times via the five input.session fields.
Choose how long boxes persist on 1m/5m/15m.
Enable alerts if you want instant breakout notifications.
(Optional) Configure the MA suite for trend/bias context.
Best for
Intraday traders and scalpers who rely on repeatable session behavior and demand exact cross-TF alignment of ORB levels.

Session ORB 15m Synced + Pre-Sessions + MAs (final v3)Session ORB Live Pro — Pre-Market Boxes & MA Suite
Description (EN):
Session ORB Live Pro is a Pine v6 indicator built for intraday traders who rely on Opening Range Breakouts. It draws session boxes for London, New York, and Asia—plus configurable Pre-London and Pre-New York windows—live from the very first candle (no waiting for 10 bars). The high/low levels update in real time, and optional breakout alerts fire the moment price closes beyond the range. To keep charts clean and relevant for scalping, the boxes auto-hide on chart timeframes above 20 minutes.
Beyond ranges, the tool adds a compact moving-average suite: SMA-50 and RMA-200 out of the box, plus three fully customizable MAs (SMA/EMA/RMA/WMA/HMA) with selectable color, thickness, and style (line, stepline, circles). Each session and pre-session can be toggled on/off and tinted with its own color, so you can tailor the visual map of liquidity grabs and range breaks to your strategy.
Key features
Live ORB boxes for London, New York, Asia (no 10-bar delay).
Pre-sessions: Pre-London & Pre-New York with independent time windows and colors.
Auto visibility filter: boxes show only on ≤ 20m chart TF; hidden on higher TFs.
Breakout alerts when price closes above/below the session range (ready for alert() rules).
MA toolkit: SMA-50, RMA-200 + 3 user MAs (SMA/EMA/RMA/WMA/HMA) with color, style, and width.
Clean inputs using input.session; robust, low-friction UX.
How to use
Set your ORB calculation timeframe (e.g., 15m) and choose which sessions/pre-sessions to display.
Pick colors for each box and enable alerts if you want instant breakout notifications.
Configure the MA suite for trend bias and dynamic S/R (e.g., SMA-50 for momentum, RMA-200 for bias).
Trade the first clean break or the retest of the ORB extremes—your choice. The visual map updates tick by tick.

Multi Timeframe BOS & rBOSThis is the same Multi-Timeframe Break of Structure and Market Structure Shift posted by Lenny_Kiruthu. However, the only difference is the naming of Market Structure Shift to rBOS (Break of Structure Reverse). To me, they are all break of structures when previous peaks or valleys are violated. The only difference is in sequence. Once a sequence of BOS reverses, then a new sequence begins. To me, this simplifies the various terminology incorporated by different systems such as ICT or SMT which adds unnecessary complexity.
eT

Short Monday , Long TuesdayKillaxbt create this concept. Often BTC create this pattern:
Monday Short ✔️
Tuesday Long ✔️
Wednesday... Lets give it a test during Asia. Just remember who shared this first. 😉
Thursday is pivot. Depending on the narrative leading into thursday... we determine direction. ⚡️
This concept is graphic, he show where you are and where we can go. He give you a plan for the week
Concept : @killaxbt
Code by @paulbri

SW's Asia/London H/L'sAccurate Asia and London (with other session) High's and Low's. As well as NY Pre-market and opening bell, and end of day vertical lines. Also created 4 slots in UI to be able to set specific vertical lines with custom label options.
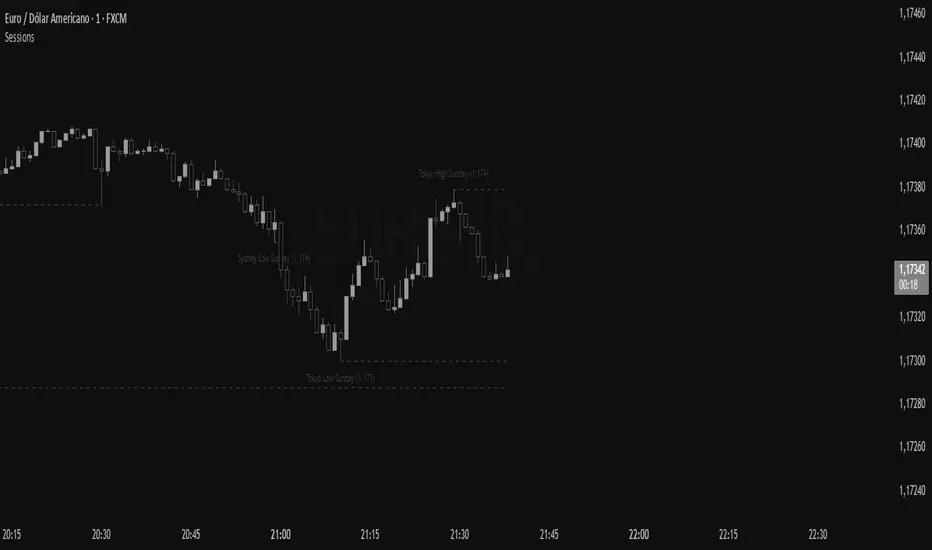
Sessions RangeThis script clearly displays the price ranges (High–Low) of the main sessions—Sydney, Tokyo, London, and New York—with boxes on the chart and marked levels. Level labels can display price and date (or day of the week) in the time zone of your choice (GMT).
Main Features
Boxes by session: Visually highlight the range for each session.
High/Low levels: Lines at the session extremes, with configurable length.
Smart labels: If you choose to show "on the right," only active (unmitigated) levels track the price; when mitigated, they return to their starting point, keeping the chart clean.
Flexible date: Choose between day of the month (with time) or day of the week.
Alerts (optional): Notification when a level is broken.
Notes
The time zone displayed on the labels follows the chosen GMT, regardless of the chart time zone.
You can choose to extend levels until they are mitigated or beyond, depending on your reading.
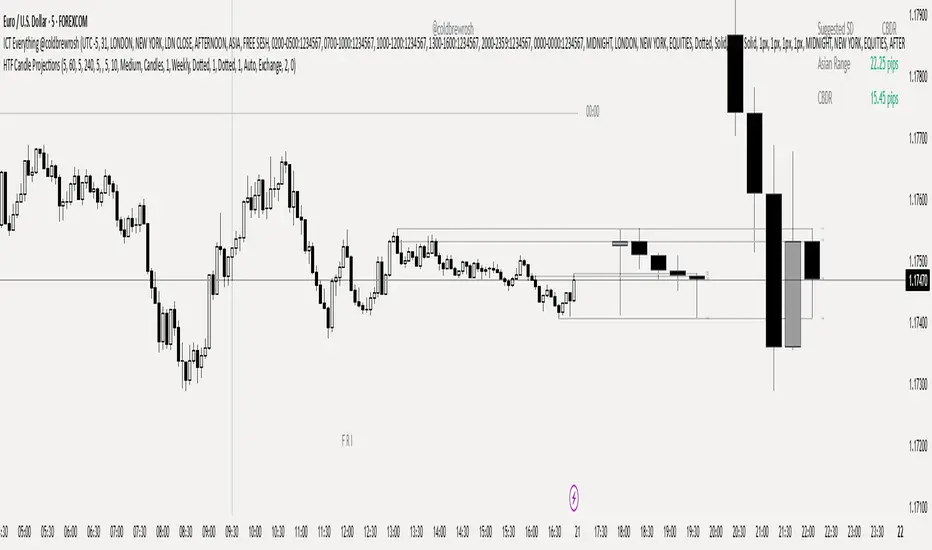
HTF Double TF Candle Projections by Pahto\ HTF Candle Projections (Dual Timeframe)\
This indicator projects higher-timeframe candles directly onto your chart, allowing you to see how larger structures are forming in real time. Instead of waiting for a higher-timeframe bar to close, it builds and updates projected candles tick-by-tick.
\ Key Features\
* \ Dual timeframe support\ – plot two higher-timeframe levels at once for deeper context.
* \ Custom opening times\ – align HTF candles to session opens or specific market times.
* \ Flexible candle types\ – choose between regular or Heikin Ashi projections.
* \ Projection lines\ – live open, high, and low levels extend from the current HTF candle.
* \ Configurable visuals\ – body, wick, border colors, label sizes, margins, and offsets.
* \ OHLC labels\ – optional price markers for open, high, low, and close of projected candles.
\ Use Cases\
* Anticipate higher-timeframe levels while trading on lower timeframes.
* Track evolving HTF opens, highs, and lows during live sessions.
* Compare two higher-timeframe perspectives side-by-side without switching charts.
This tool is designed for traders who rely on multi-timeframe confluence, price action mapping, or session-based analysis. It keeps HTF structure visible at all times so you can trade lower-timeframe setups with bigger-picture alignment.
Staolin Trade maxx V1This script is a custom TradingView indicator named "Staolin Trade maxx V1". It overlays on price charts and includes features for visualizing support and resistance zones, trendlines, EMA-based trend fills, higher high/lower low labels, range boxes, Supertrend buy/sell signals, risk management lines with SL/TP levels, and customizable moving averages. Inputs allow toggling elements like trendlines, EMA trends, labels, ranges, and levels, as well as adjusting lengths, colors, sensitivities, signal strengths, and risk-reward ratios. Zones appear as gradient-filled bands (red for upper, green for lower), trendlines as extending lines (teal up, red down), EMA fills as translucent ribbons (green up, red down), labels as triangles (green HH, red LL), ranges as colored boxes (blue unbroken, green/red broken), signals as labels (green buy, red sell), SL/TP as extending lines with emoji-labeled tags (blue entry, red SL, green TPs), and MAs as lines (blue 5, red 13, green 20).

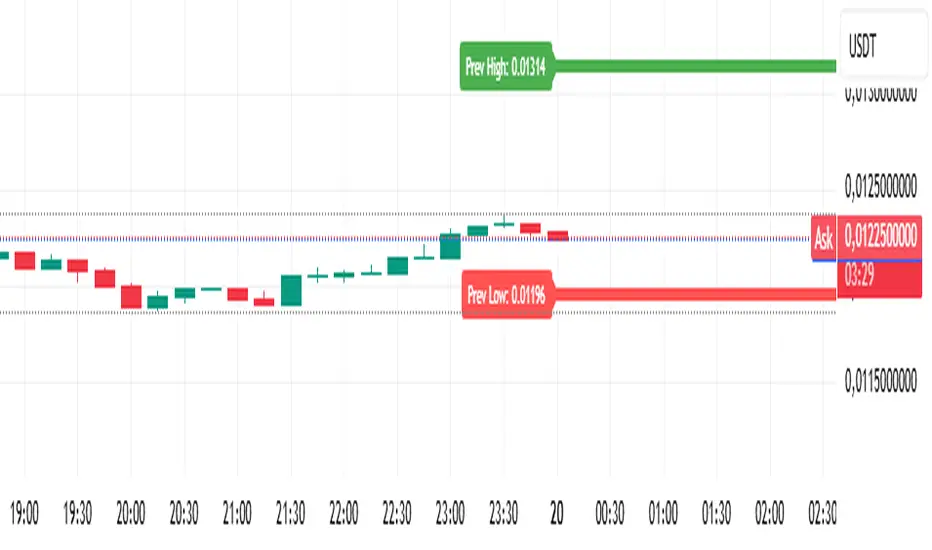
Analitica Trading — Previous Day SR (2 lines + labels) 2.0📊 Analitica Trading — Previous Day SR (Support & Resistance)
This indicator displays the previous day’s key levels on any timeframe:
Prev High → Green horizontal line with label.
Prev Low → Red horizontal line with label.
🔹 Stable across timeframes: The levels are calculated from the daily candles and remain fixed, no matter if you switch to 1D, 1H, or 5m.
🔹 Simple & clean: Exactly two lines only (no duplicates).
🔹 Price labels included: Each line has a clear tag showing the exact level.
🔹 Dynamic update: Lines refresh automatically at the start of each new daily session.
🔹 Alerts: Optional alerts trigger when the price breaks above the Prev High or below the Prev Low.
💡 Ideal for support/resistance trading, breakouts, and Smart Money Concepts (SMC) strategies.
Analítica Trading — Prev Day Levels🤖📊 Analítica Trading — Previous Day Levels
This indicator clearly and precisely displays the key levels from the previous day:
📈 Previous Day High (green line).
📉 Previous Day Low (red line).
The lines are fixed horizontals, updated automatically at the start of each new session, and remain visible throughout the entire day, providing a reliable reference for trading.
It also includes:
🔔 Configurable alerts when the price breaks any of the levels.
🏷️ Labels on the chart with the exact value of each level.
💡 Ideal for Support and Resistance, Breakout strategies, and Smart Money Concepts (SMC).

Diamond PivotsWhen price changes direction, it forms Pivot. They are also called reversals, because they represent the point where the price reverses direction.
There are two varieties of pivots: Pivot high and pivot low
A pivot high occurs when the price is moving higher, then changes directions and begins moving lower.
A pivot low occurs when the price is moving lower, then changes direction and begins moving higher. Since the financial markets are in a constant state of movement, pivots are constantly forming.
The Pivot is identifying the liquidity points or sweeps of liquidity

TB DayProfile (stabil)TB DayProfile Indicator
The TB DayProfile plots intraday price movements relative to the current day’s opening price. Each bar is shifted so that the daily open acts as a fixed zero line, making it easy to see how far the market has moved above or below the open during the session.
The indicator includes:
Relative intraday bars (iOpen, iHigh, iLow, iClose): Displayed as a custom bar chart, showing price action normalized to the day’s open.
Zero line with color signals: Turns green if the number of consecutive bars above the open exceeds a user-defined threshold, or red if below.
ATR reference bands: Daily ATR(5) from the previous day (scaled by 0.25) is plotted as upper and lower bands, helping to gauge typical intraday ranges.
This tool helps traders quickly identify whether the market is trending strongly away from the daily open, or if price is reverting back toward it, independent of the chosen chart timeframe.

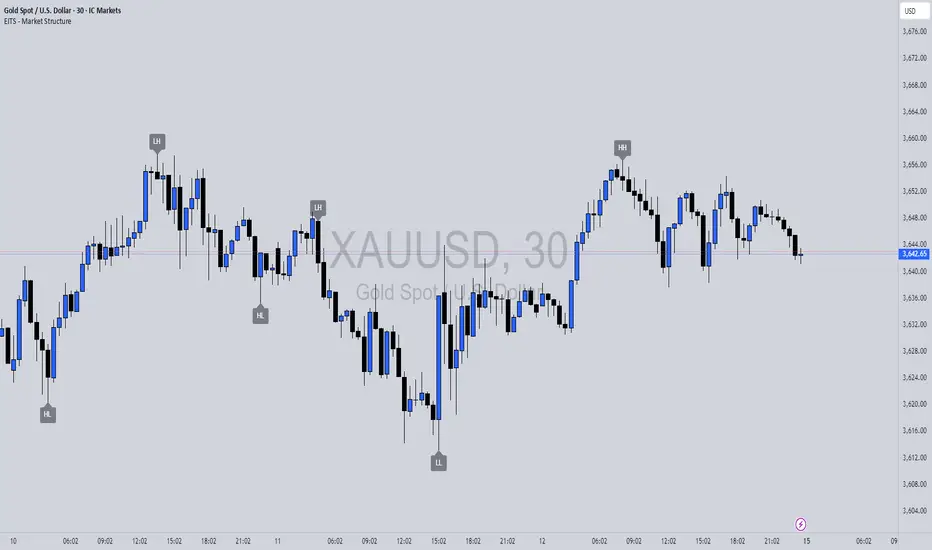
EITS - Market StructureThis script marks the Swing Lows and Highs of a chosen pair. H,HH,L,LL,HL,LH will be marked on chart. Have fun!!
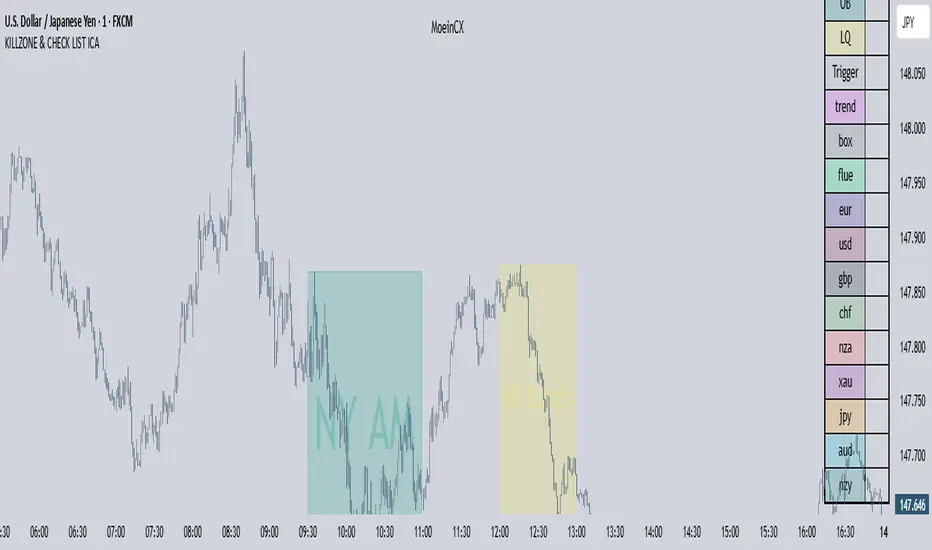
KILLZONE & CHECK LIST ICAKILLZONE & CHECK LIST | The Inner Circle Alchemist
✨ Features:
Display of precise trading killzones on the chart
Marking the high, low, and mid-level of each killzone
Option to show/hide killzone names
Daily separators at custom times (e.g. 17:00 or 00:00)
Highlighting Midnight Open, 8:30 Open, and New York Stock Exchange Open
Display of previous day, week, and month highs & lows (optional)
A clean and practical trading checklist on the bottom-right of the chart
Visual customization, such as showing your name/brand on the chart
Clear indication of weekdays
⚡️ A perfect mix of professional tools & visual style to keep you one step ahead!
ID on all platforms: TheInnerCircleAlchemist
#Forex #Trading #Indicator #Killzone #TradingChecklist #PriceAction #DayTrading #SwingTrading #SmartMoney #MarketStructure #TradingTools #ChartAnalysis #TechnicalAnalysis #ForexStrategy #TraderLife #ForexTrading
[DEM] Heikin Ashi Barcolors Heikin Ashi Barcolors is designed to apply smoothed Heikin Ashi calculations to regular candlestick charts and color the price bars based on the resulting Heikin Ashi trend direction to reduce market noise and provide clearer visual trend identification. The indicator first applies EMA smoothing to the standard OHLC values, then calculates Heikin Ashi values using the traditional formulas (averaged close, modified open based on previous values, and adjusted high/low), and applies an additional layer of EMA smoothing to the Heikin Ashi results. The bars are colored teal when the smoothed Heikin Ashi close is above the smoothed Heikin Ashi open (indicating bullish conditions) and red when the close is below the open (indicating bearish conditions), effectively transforming the visual appearance of regular candlesticks to reflect the smoother, trend-following characteristics of Heikin Ashi methodology while maintaining the original price structure.
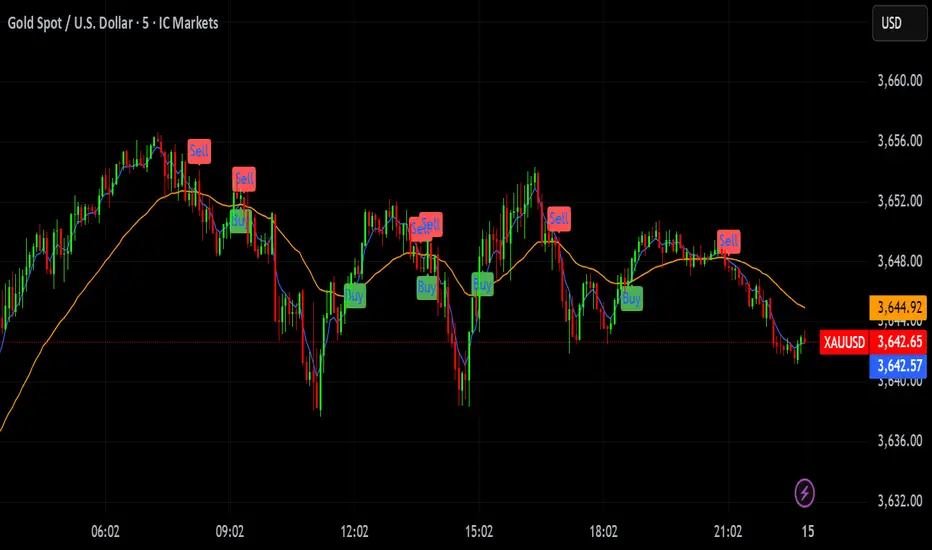
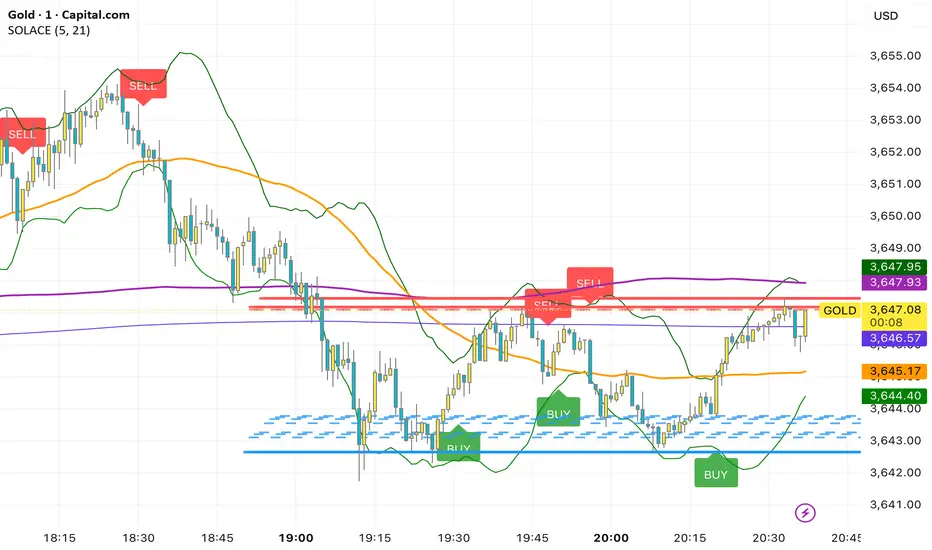
SOLACEThis overlay combines a fast/slow EMA price-action system with rich context tools. Buy prints on the current bar when both EMAs (5 & 21) are below the OHLC average and the 21 EMA crosses below the 5 EMA; Sell prints when both EMAs are above the average and the 21 EMA crosses above the 5 EMA. It also plots MACD, VWAP, Bollinger Bands (20,2), SMA50/200, plus dynamic support/resistance lines from recent swing highs/lows (20/40/60 bars) for confluence. Labels fire same-bar for early entries, and alerts are included for both signals; fractal logic is prepared for future use.
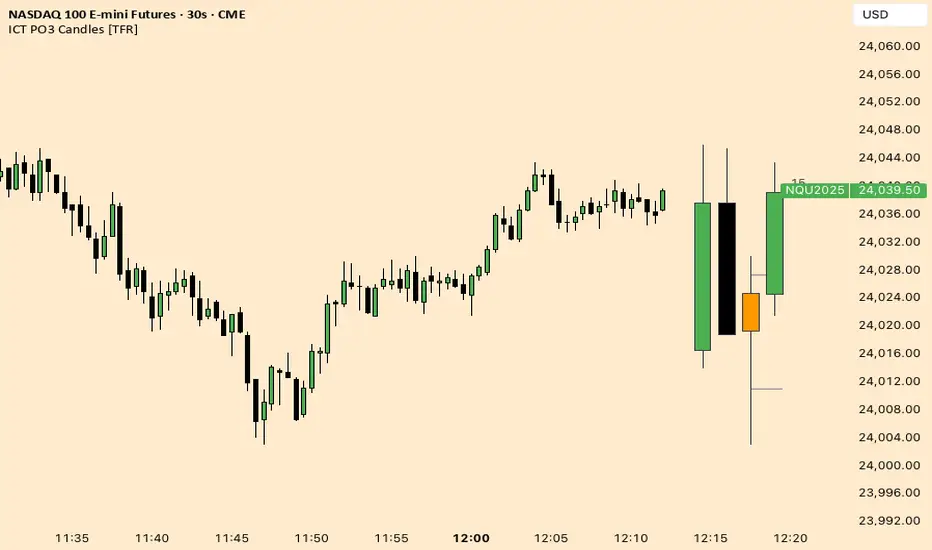
ICT Fractal HTF Candles [TFR]ICT HTF Fractal Candles
This indicator overlays higher timeframe (HTF) candles directly on your current chart for better multi-timeframe analysis. It plots up to the last 4 candles from a user-selected timeframe (5m, 15m, 1h, 4h, or 1D) with customizable body and border colors.
Features:
Displays the last 4 higher timeframe candles (open, high, low, close) on your current chart.
Customizable bullish, bearish, and inside close candle colors.
Optional midpoint wick lines (top and bottom) for precision reference, with extendable length for clarity.
Optional candle midpoint line for additional confluence.
Overlay mode allows you to see HTF structure without switching chart timeframes.
Timeframe label display so you always know which HTF is being plotted.
Offset control for shifting candle position.
Use Case:
This tool helps traders apply ICT concepts like PO3, midpoint reference levels, and multi-timeframe confirmation without constantly switching between charts. It’s particularly useful for identifying liquidity zones, midpoint reactions, and higher timeframe market structure while executing on a lower timeframe.