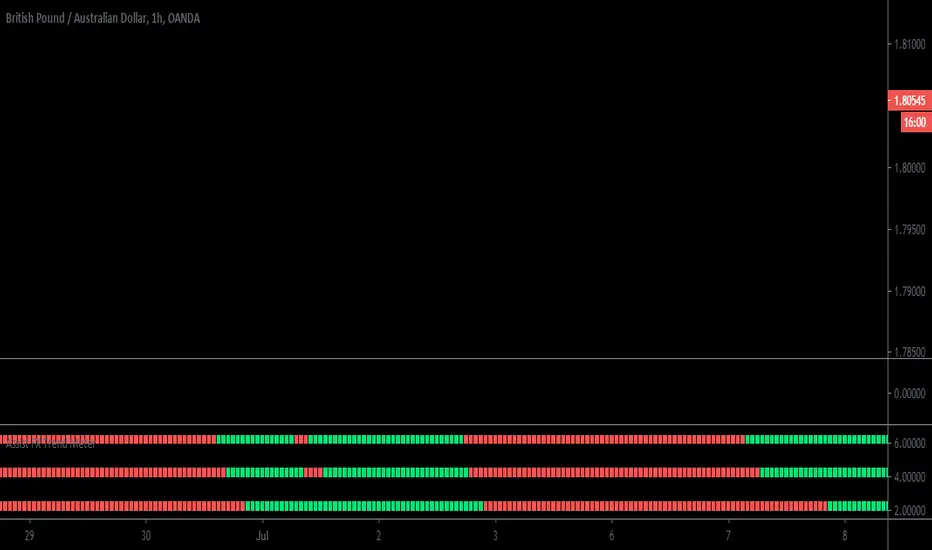
Assist FX Trend MeterWelcome to the Assist FX Trend Meter.
This trend meter is our own script that is based off Multiple Timezone Analysis and a Momentum Squeeze.
The Way the trend meter works is as follows it is based off the 1 Hour, 4 Hour and Daily time zones each line represents them times, If the market is "Bullish" you will get green lines , If the market is "Bearish" you will get red lines.
This you can use with other confluences, But most importantly helps you identify without switching between time zones which way the market is moving at the time you are looking at your chart.
If you have any questions or would like to use this script please send us a private message.
Thank you
Foreks
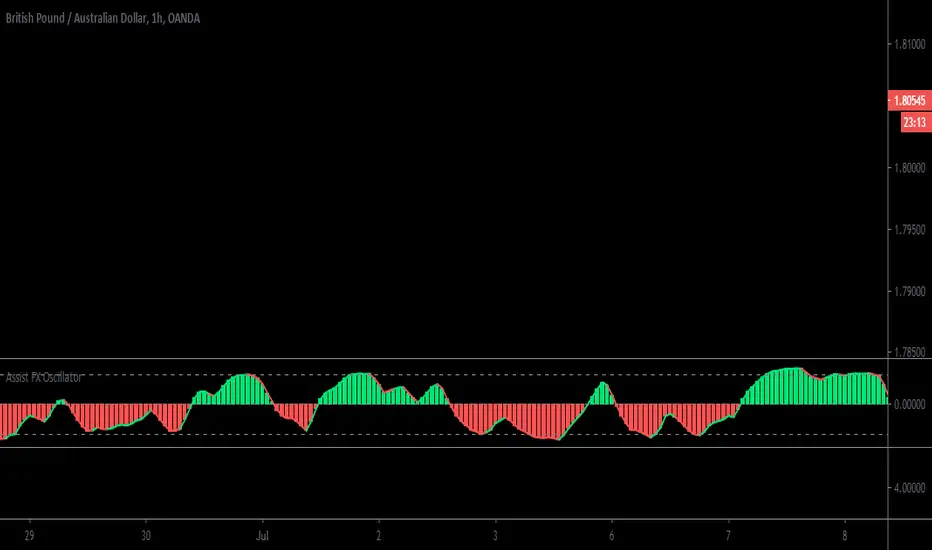
Assist FX OscillatorWelcome to The Assist FX Oscillator
This is our very own Oscillator that has been developed to Incorporate Trend Movement in the market and Volume Combined.
How do we know how to read the Oscillator?
When the Oscillator Turns "Green" this Suggests there is a potential Bullish Trend happening and Volume in the market , If it goes "Red" this would suggest the opposite and look Bearish.
We suggest you use this with other confluences before placing any trade.
If you have any questions or you would like to use this script please send us a private message.
Thank you very much.
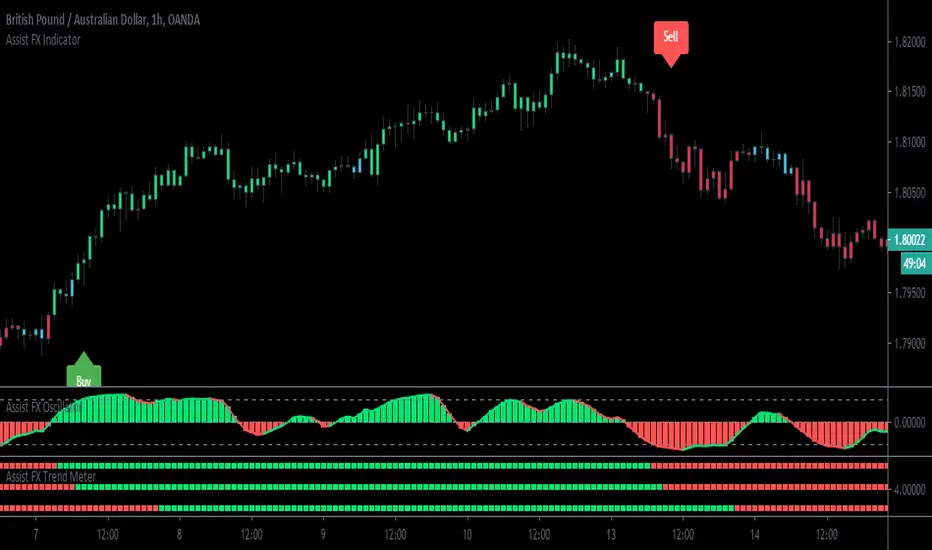
Assist FX IndicatorWelcome to The Assist FX Indicator/Toolkit
This is a Strategy we have been working on for a long time now and were ready for Release.
How Does it work you ask?
Our strategy will help you identify the current trend in the market and based off the market movement and 3 other Confluences will Place "Buy" and "Sell" Signals on your Chart - Just to note for File this signals to Not Repaint.
This takes away most of the Technical Analysis for you , Yes we Suggest you also use your own Knowledge and Influence before placing your trades.
When all criteria is met in the code our signals appear, You will get a Red Sell signal for if the market is looking to go bearish and if you get a green buy signal the market is looking to go Bullish.
If you have any other questions relating to the indicator or you would like access , Please do not hesitate to contact us via private message and we will be able to assist you
Have a great day!
Dexie Indicator v1.0The Dexie Indicator is a Forex indicator system built for the 5 min chart. It is suitable for Forex traders and Nadex users and provides BUY/SELL signals with alerts and comes with a series of 8 custom built Moving Averages designed to reduce the need for chart drawing.
This indicator can be used by beginners out of the box and requires very little trading experience to be successful.
The more advanced trader can work with this tool to greatly increase their success rate and make for a much more enjoyable trading experience.
Please contact for more details.
Dexie Indicator with BUY/SELL signals displayed only:
Dexie Indicator with BUY/SELL signals, Bollinger Bands and custom Moving Averages:
Dexie Indicator with all custom Moving Averages displayed:
Dexie Indicator slower Moving average bull cross example:
Dexie Indicator slower Moving average bear cross example:

Real Interest Rate DifferentialThe Real IRD is a simple indicator built for forex trades that need a long-term view and want to compare currencies in search of high yield. The indicated interest rate maturity is 2 years, since shorter maturities may not price central banks' monetary policy decisions.
Example:
- You need to do an analysis of the AUDUSD
- In the Interest Rate 1 field, we put the interest rate for the base currency, in this case the AUD
- In the Interest Rate 2 field, the interest rate of the other currency, in this case the USD
- In the CPI 1 field, inflation referring to base currency
- In the CPI 2 field, inflation for another currency
CPI Codes:
QUANDL:RATEINF/INFLATION_USA < USD
QUANDL:RATEINF/INFLATION_EUR < EUR
QUANDL:RATEINF/INFLATION_JPN < JPY
QUANDL:RATEINF/INFLATION_CHE < CHF
QUANDL:RATEINF/INFLATION_GBR < GBP
QUANDL:RATEINF/INFLATION_CAN < CAD
QUANDL:RATEINF/INFLATION_RUS < RUB
QUANDL:RATEINF/INFLATION_AUS < AUD
QUANDL:RATEINF/INFLATION_NZL < NZD

Dexie Indicator v1.0The Dexie Indicator is a complete Forex trading system built for the 5 min chart. It is suitable for Nadex users and provides BUY/SELL signals with alerts and comes with a series of 8 custom built Moving Averages designed to reduce the need for chart drawing.
This indicator can be used by beginners out of the box and requires very little trading experience to be successful.
The more advanced trader can work with this tool to greatly increase their success rate and make for a much more enjoyable trading experience.
Please contact for more details.
Dexie Indicator with BUY/SELL signals displayed only:
Dexie Indicator with BUY/SELL signals, Bollinger Bands and custom Moving Averages
Dexie Indicator with all custom Moving Averages displayed

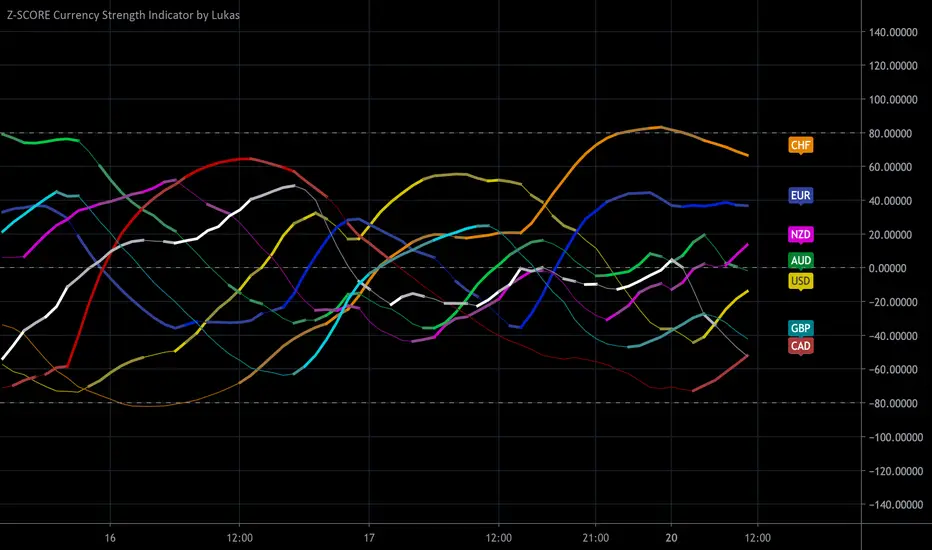
Z-SCORE Currency Strength Indicator by Lukas"you must have" indicator if you trade Forex major pairs.
So far this is the most reliable script i have for trade forex pairs.
This indicator will give us information of momentum, strength and cycle.
What i like about Z-SCORE, it's calculate price and volume.
Setting :
1. Set Color 0 and Color 2 into thick line, it will give you strength information.
The strength information is base on cumulative Currency price Vs. 7 others currency,
When Source Price above EMA and Above LWMA "Color 0" active, above EMA "Color 2" active, below EMA "Color 1" active
so it's important to set the thickness.
2. You can set EMA length as thickness filter
3. You can set Signal line between EMA and LWMA
EMA = smoother
LWMA = reactive
Strong currency signal when Color 0 active and they are on upward movement, crossing -80 or above 0
Weak Color 1 active and they are on downward movement, crossing 80 or below 0
Trade Strong Vs. Weak
Any feedback are welcome.
Hope it useful!
I also have unpublished OBV and smooth RSI indicator,
OBV can give you earlier bull/bear sign, let me know if you are interested~
Thank you.
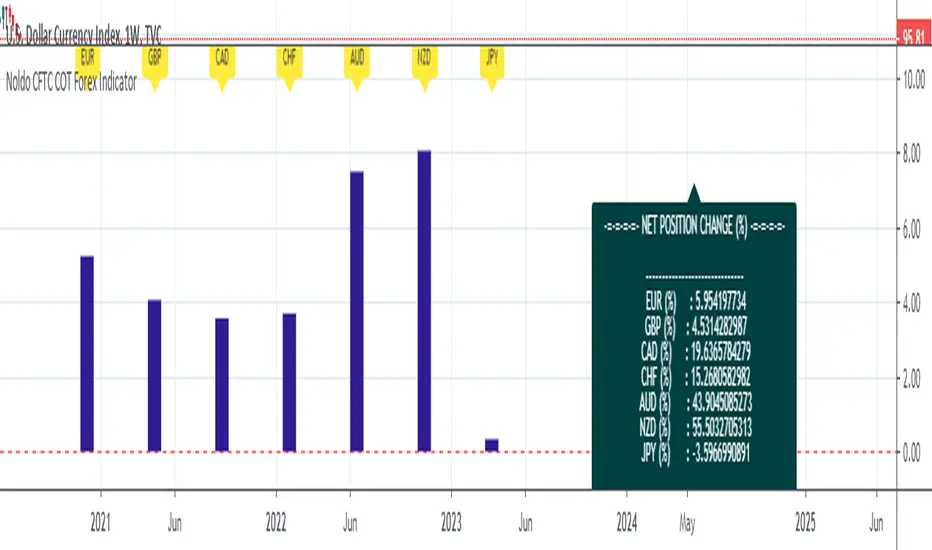
Noldo CFTC COT Forex IndicatorHello.
I decided to publish the COT Forex Indicator, which I created for convenience, as an open source.
The period DXY is determined by the differences between the two signals on the Pivot Reversal Strategy on the weekly chart.(1W)
Thus, relative period point search is automated.
When the new signal comes, after the closing, the number of bars between the previous bar before the new signal comes both directions.
This elapsed time is our period in which we will look back on relative changes.
If there is no signal, the period remains constant, thereby allowing us to notice excessive changes.
And in this period, COT data exchange and price changes are reflected in the terminal.
The automatic time-keeping of the period and the automatic generation of the relative differences of the terminals according to the period prevents a great loss of time.
Thus, we create one of the strong columns that enable us to make decisions.
The other column is the signals we obtained as a result of technical analysis.
The last column is the economic agenda and data tracking.
That's why I made my decision to share this:
Real life should not be distracted,
should not be drowned in the sea of technical analysis.
COT data is one of the most important and valuable tools that bring us signs of real life,
It should not be forgotten !
A lot of time is lost while doing these analyzes, and I wanted this to be much more practical and tidy!
And we can see if there are factors that will back up our incoming signals.
Usage
This script works only on DXY .
You must open DXY.
It only works on 1W graphics.
Because COT data is announced on Tuesday, it will cause repaint every Tuesday.
However, since it is a terminal, this factor is not strong enough to affect your decisions.
For use, you should open the bottom panel, go a little to the right in the history section and enlarge the panel you have opened.
The terminal will take its form in the presentation and provide analysis on the big screen.
COT data are pulled via Quandl.
General kind request:
Authors who know the technical broad expression of the security function or have an idea about its creation, please reach me.
Best regards.
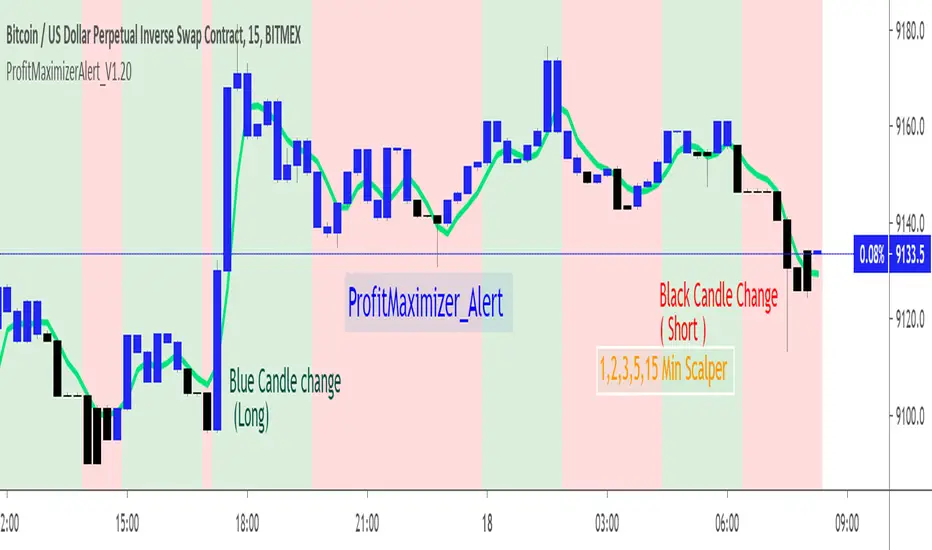
PM_Scalper_AlertsFriends,
Welcome to ProfitMaximizer(PM) Scalper Alert Indicator. This is same Indicator as that published by me on Dec 26, 2018 .
Since the old script was published using "heikin ashi" ,As per recent house rules it was moderated and hidden by Admin.
Based on the discussion with Admin and direction given by them republishing as it is with no change in the code but the chart is now with Real CANDLEs .
This indicator basically uses multiple time-frame and checks the price variation to determine the long and short candles.
On accumulation on good up moving candles the plot is done as Blue color that shows sign for LONG .
On accumulation on good down moving candles the plot is done as Black color that shows sign for SHORT .
Long : Change of Candle from Black to Blue Candle (U can customize color in Styles settings of this indicator)
Short : Change of Candle from Blue to Black Candle.
Alerts : Alerts are inbuilt in this indicator that can be used to get Alerts when the direction of the Candle(Blue to Black,Black to Blue) is getting changed . Financial Market is always risky.Any trade you make based on this indicator and its result is your responsibility.As an author i will be held no responsibility of your trade gain or loss.Be Cautious.
Note : This is scalper indicator and only works only in
1min ,2min, 5min, 15min .
In Higher timeframe the chart wont paint the colors.
Use the JETLINE to detect good entries ,Price above the JET line good for Long,Price Below the JET line good for short.
The Strategy version of this indicator published on 3-Sep-2018 is here for your study and reference.
Find the indicator useful,Share your feedback in comments and appreciate if this is useful.
Note : This chart can be applied for any TV supported charts.Examples Below.Thank you!
ETH Chart : 5min
EURUSD Chart :5min
SPX500 Chart :5min
iqlegendThe iqlegend indicator integrates stocastic information and places overbought and oversold entry points. Trade accordingly when Buy and Sell signals coincide with RED points to sell and Green points to buy.
The best points to enter Sell are above the dashed -30 line and to enter Buy are below the dashed -30 line.
Confirm with the intersection of the stocastics.
When you make your trade, don't forget the correct administration of your capital, use risk units, 6UDR is my recommendation.
I hope this indicator provides you with the business information you need.
PM us to obtein acces.
Kind regards and successes!
********************************************************************
El indicador iqlegend integra información estocastica y ubica puntos de entrada en sobrecompra y sobreventa, Opere en consecuencia cuando coincidan las señales de Buy y Sell con los puntos Rjo para vender y los puntos Verde para comprar.
Los mejores puntos para entrar en Sell están por encima de la linea punteada -30 y para entrar en Buy están por debajo de la linea punteada -30.
Confirme con la intersección de los estocásticos.
Cuando realice su comercio , no olvide la correcta administración de su capital, use unidades de riesgo , 6UDR es mi recomendación.
Espero que este indicador le proporcione la información comercial que usted necesita.
Envíeme un mensaje privado para obtener acceso.
Un cordial saludo y éxitos!

iqlegendThe iqlegend indicator integrates stocastic information and places overbought and oversold entry points. Trade accordingly when Buy and Sell signals coincide with RED points to sell and Green points to buy.
The best points to enter Sell are above the dashed -30 line and to enter Buy are below the dashed -30 line.
Confirm with the intersection of the stocastics.
When you make your trade, do not forget the correct administration of your capital, use risk units, 6UDR is my recommendation.
I hope this indicator provides you with the business information you need.
PM us to obtein acces.
Kind regards and successes!
**********************************************************************
El indicador iqlegend integra información stocastic y ubica puntos de entrada en sobrecompra y sobreventa, Opere en consecuencia cuando coincidan las señales de Buy y Sell con los puntos RED para vender y los puntos Green para comprar.
Los mejores puntos para entrar en Sell estan por encima de la linea punteada -30 y para entrar en Buy estan por debajo de la linea punteada -30.
Confirme con la intersecion de los stocastics.
Cuando realice su comercio , no olvide la correcta administración de su capital, use unidades de riesgo , 6UDR es mi recomendación.
Espero que este indicador le proporcione la información comercial que usted necesita.
Envíeme mensaje privado para obtener acceso.
Un cordial saludo y éxitos!

Smart Forex Buy Sell Signal by LukasHi again!
So, this is BUY and SELL signal base on Price action, RSI, and Correlation between Forex Major Pairs.
It's only work for Forex Major Pairs because I only took their data.
Included alert : Spec, Buy, Strong
Recommended to wait for double signal :
Spec Buy > Buy or Spec Sell > Sell
Buy > Strong Buy or Sell > Strong Sell
So execute after the second signal triggered.
It's indicate the trend.
Looking forward for your feedback to improve the script.
Thank you.
It's better combine it with Moving average indicator to indicate direction, I use Moving Average Adaptive Q from cheatcountry to help me make decision.

Forex Trend Buy Sell Signal by LukasHello,
This is Forex Buy and Sell indicator, Signal line cross up blue line = Buy, cross down = Sell
Above Yellow line = Uptrend, Looking for Buy only, vice versa.
Only works on Major Pairs.
Calculate price strength and momentum.
Hope you guys like it.
Cheers
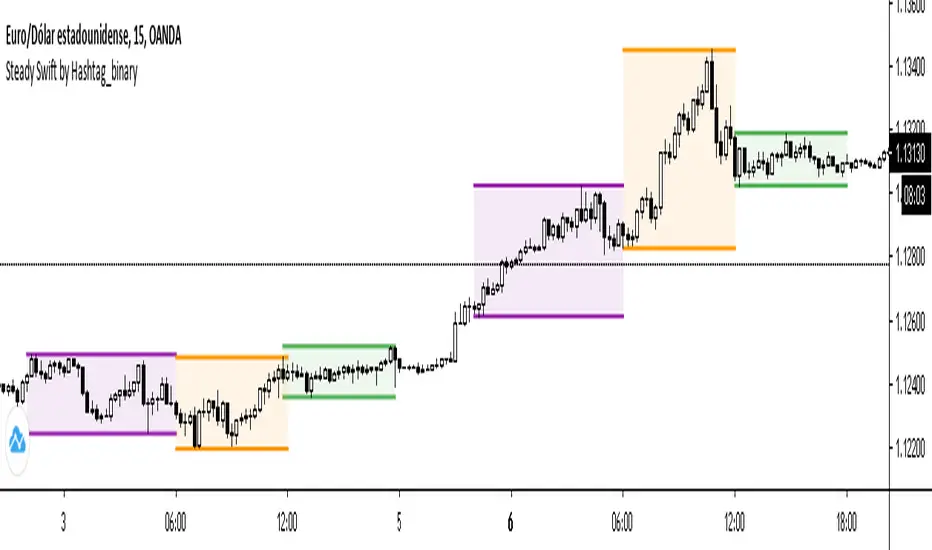
Steady Swift by Hashtag_binarySteady Swift is an indicator that shows the forex sessions and the highest and lowest points of each session of the day.
The sessions that appear on the indicator are Tokyo, London and New York.
The calculation of each session is per hour and goes from 0 to 24 hours, where point 0 begins in the Tokyo session.
In the settings part sessions can be selected or removed, just as you can choose if you want the high and low points to be measured from the wick or the body of the candle, and you can also place the colored background or remove it if you wish (as a preference it is better to leave the background color).
The lines (either current or past) of the high points and the low points of each session can be modified in thickness.
There is a variety to choose the color of the sessions. Even modify the term of each session.
MACD Binary Strategy by Hashtag_binary MACD Binary Options Strategy is an trend momentum system, It's based on the double MACD in the sub window below the chart.
- Markets: Stocks, Indicies, Metals, Forex. This binary strategy works good on the Indicies ( S&P 500, DAX, FTSE, ).
- MACD Binary System il also good as trading system for to trade.
- Time Frame 30 min or higher ( best 4H).
- Expires Time 3 bars after. (90 min, 180 min, 720 min, 3 daily).
Rules MACD Binary Options Strategy
Buy Call:
- EMA 6 over EMA 13;
- MACD ( 5, 15, 1) crosses upward MACD ( 12,26,1 );
- MACD (5,15, 1) over level 0.
Buy Put:
- EMA 6 under EMA 13;
- MACD ( 5, 15, 1) crosses downward MACD ( 12,26,1 );
- MACD (5,15, 1) under level 0.
The same conditions for entry trade.
Exit position options:
- When MACD (5, 15, 1,) crosses in opposite direction MACD (12,26,1);
- When exponential moving average crosses in opposite direction;
- Make profit with ratio 1:3 stop loss.
- Initial stop loss at the previous swing.

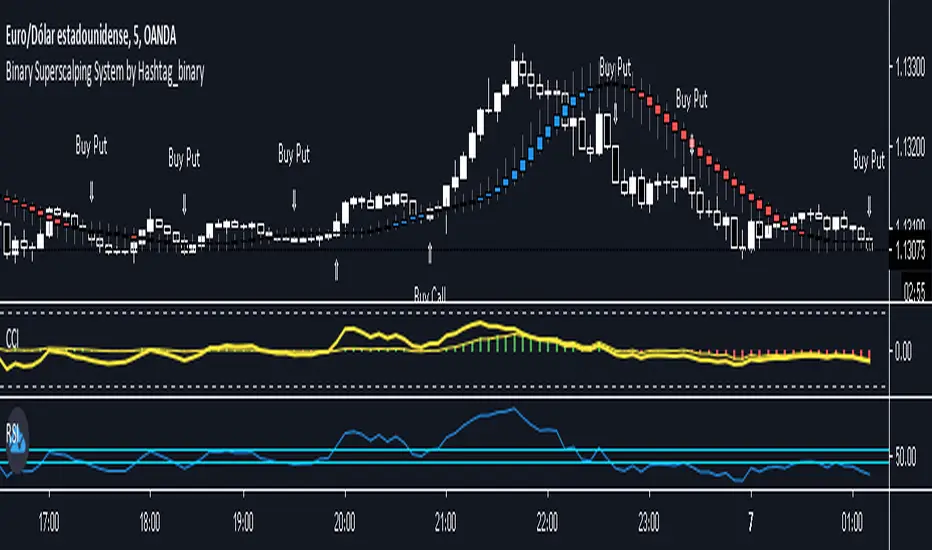
Binary Superscalping System by Hashtag_binaryBinary Superscalping Systyemis a trend momentum strategy designed for scalping and trading with binary options. This trading system is very accurate with the 80% profitable trades.
- Markets: Forex (EUR/USD, GBP/USD, AUD/USD, USD/CHF, USD/CAD, NZF/USD, USD/JPY,) Indicies (S&P500, Dow Jones, DAX, FTSE100) and Gold.
- Time Frame 5 min, 15min, 30min.
- Expiry Time (4-6 candles).
Buy Call or Buy:
- Trend CCI (170) crossed the zero line upwards (green bar >0);
- Entry CCI (34) crosses upward the zero line ;
- RSI (Relative Strength Index) indicator value is greater than 55 level;
- Heiken Ashi Smoothed indicator is color blue (optional).
Buy Put or Sell
- Trend CCI (170) crossed the zero line downwards (red bar <0);
- Entry CCI (34) crosses downward the zero line ;
- RSI indicator value is lower than 45 level;
- Heiken Ashi Smoothed indicator is color red (optiona).
Exit position for Scalping options:
- Entry CCI (34) crosses in opposite direction trend CCI (170),
- Profit Target:5 min time frame 7-10 pips, 15 min time frame (9-14 pips), 30 min time frame (15- 18 pips).
- Make Profit at fibopivot levels.
- Initial stop loss on the previous swing.
ADX signal Binary Options System by Hashtag_binary ADX signal Binary Options System is amanual trading system trend-momentum high/low. This system is still really interesting to use for binary options and trading without binary.
- Time Frame 15 min or higher.
- Expiry time 2-4 candles.
- Markets: Forex (Currency pairs: Majors; Index: S&P 500, Dow Jones, DAX, FTSE).
Trading rules ADX signal Binary Options System
Buy call:
1. The Moving Average line (14) is above others two Moving Averages (60 and 100 red and magenta line).
2. The TrendSignal Bar first subwindow indicator with bar green.
3. Stochastic is above 50 level.
4 If the previous conditions are agree when appear ADX green arrow you can enter buy call.
Buy Put:
1. The Moving Average line (14) is below others two Moving Averages (60 and 100 red and magenta line).
2. The TrendSignal Bar first subwindow indicator with bar red.
3. Stochastic is below 50 level.
4. If the previous conditions are agree when appear ADX red arrow you can enter buy put.
Exit position for trading without binary
Time Frame H1 and 30 min place trailing stop 15 or 20 pips, 4H time frame place trailing stop 30-40 pips depends by currency pairs.
Initial stop loss on the previous swing High/Low.


SupertrendIndicatorSupertrend (13,2.5) & Supertrend (18,3) are best for intraday.
Loving the signals.


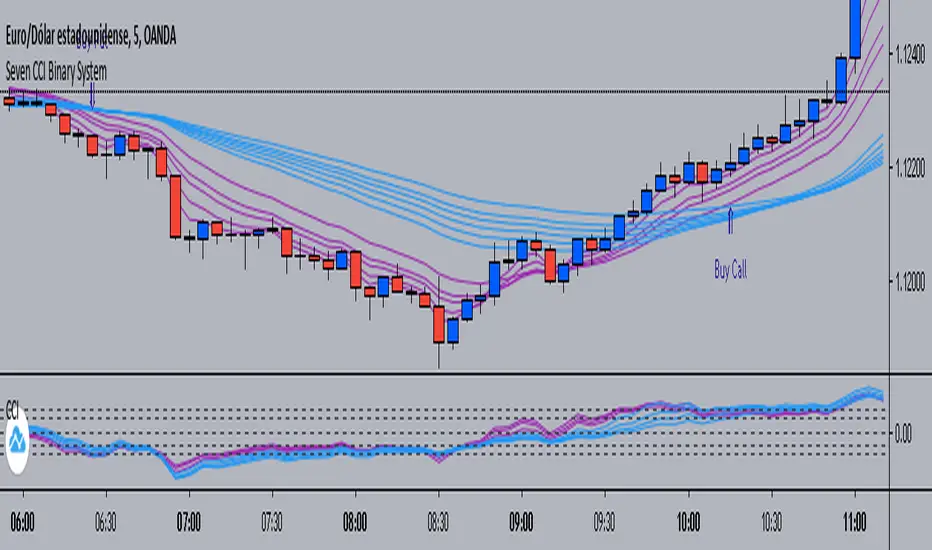
Seven CCI Binary System by Hashtag_binarySeven CCI binary system is trend-momentum strategy based on CCI and exponential moving averages. This trading system is also good for scalping and intraday trading.
Rules for Binary Options:
- Time Frame 5 min or 15 min.
- Expiry time 4-5 candles.
- Trades only in trend.
Buy Call:
- EMA's lines color magenta above EMA's lines color blue;
- CCI lines color magenta are above CCI lines color blue and zero level.
- When thes conditions are agree buy call at opening of the next bar.
Buy Put:
- EMA's lines color magenta below EMA's lines color blue;
- CCI lines color magenta are below CCI lines color blue and zero level.
- When thes conditions are agree buy put at opening of the next bar.
Scalping:
-Time Frame 5 min, 15min.
- Currency Pairs: EUR/USD, GBP/USD, AUD/USD, USD/CHF, USD/JPY.
- The rules for buy and sell are the same.
- When the price is within the bundle of the moving averages do not trade.
Exit position
- Make Profit on the pivot points levels or with fast profit target.
- Initial stop loss on the previous swing price.
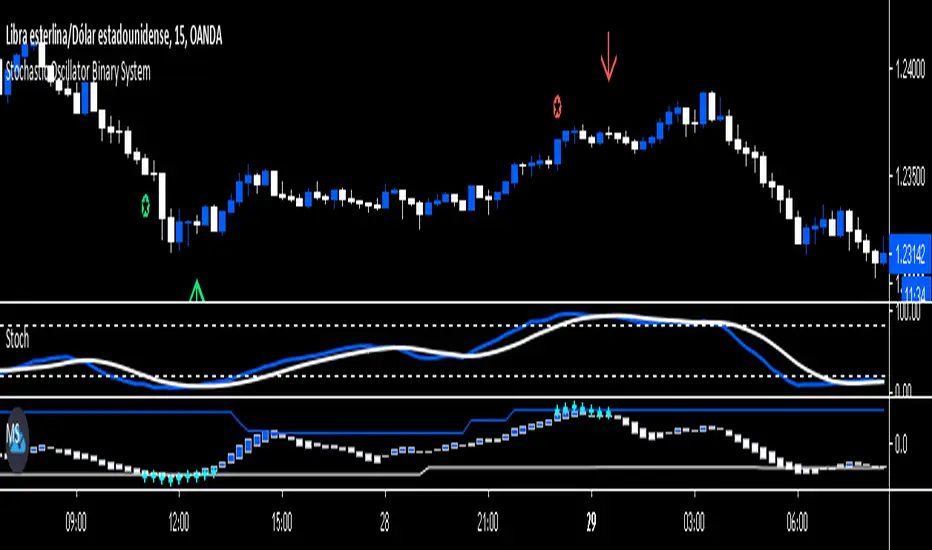
Stochastic Oscillator Binary System by Hashtag_binaryRules
- Time Frame 1 min.
- Expires Time 3 min or 15 min (the best option).
- Markets: Forex (only volatile currency pair), Futures.
- Sessions: London and New York.
Call
- Heiken Ashi Dodger blue;
-Stochastic Oscillator cross upward from oversold Zone (conservative trade, aggressive trade: Stochastic Oscillator cross upward ).
-Matrix three square dodger blue.
Put
- Heiken Ashi white;
- Stochastic Oscillator cross downward from overbougth Zone (conservative trade, aggressive trade: Stochastic Oscillator cross downward ).
- Matrix three square withe.
This Binary System is also good for trade scalping. The same rule for entry with conservative trade:
Exit position options
- For Buy close position when the stochastic line touches 80 levels,
- For Sell close positions when stochastic line touches 20 levels.
- Initial Stop loss on the previous swing.
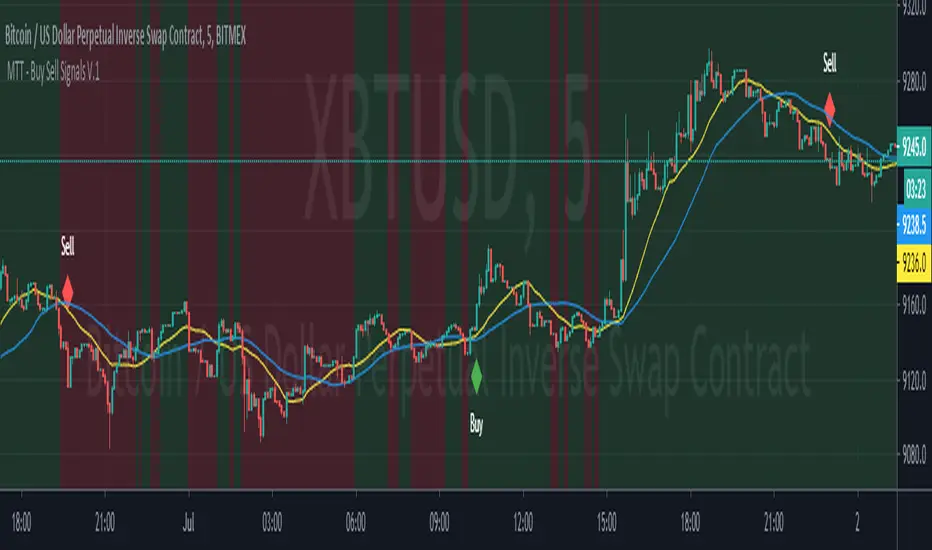
Market Trading Tools - Buy Sell SystemOur Buy Sell System indicator generally works on a modified version of the ATR ( Average True Range ) formula. The Buy Sell System is a trading method that generates Buy and Sell signals when conditions are met. These conditions include Exponential Moving Averages, ATR and depends on price action as well. Our indicator also shows a green/red background that indicates the trend on a chosen time frame.
** Our Indicator does not repaint.
** It can be used on any financial market; crypto, stocks or forex. We also encourage using time frames as the 15 minutes and above. The use of a higher than 4hr time frame requires special settings and once you have access to it, you can change the parameters as you want. We have enabled our users to freely use the settings as they wish and to their on discretionary.
Once you are granted access to use it, add it from going into the scripts >> invite only scripts >> enable the indicator. Once the indicator is added to your chart you will see the indicator popping up on your chart.
We are happy to announce that our trading indicator is special and unique from different ones because it firstly eliminates noise coming out from an average ATR indicator. We believe we are providing a service second to none and we are happy with our product.We believe that we have not seen a similar indicator, and we are proud of our work and we will continue updating the indicator when we believe it is necessary according to market changes. We have also enabled a function for our users to get a better view of the trend when they add the indicator to their chart. You can now view the trend background color (red&green) depending on if the price is above the EMA of your choice. you can also check whichever time interval you want that does not limit you to the time interval chosen on your chart itself.
Hope you enjoy it, Good luck and stay safe!
** If you are interested in this indicator. please use the link below to obtain access to this indicator