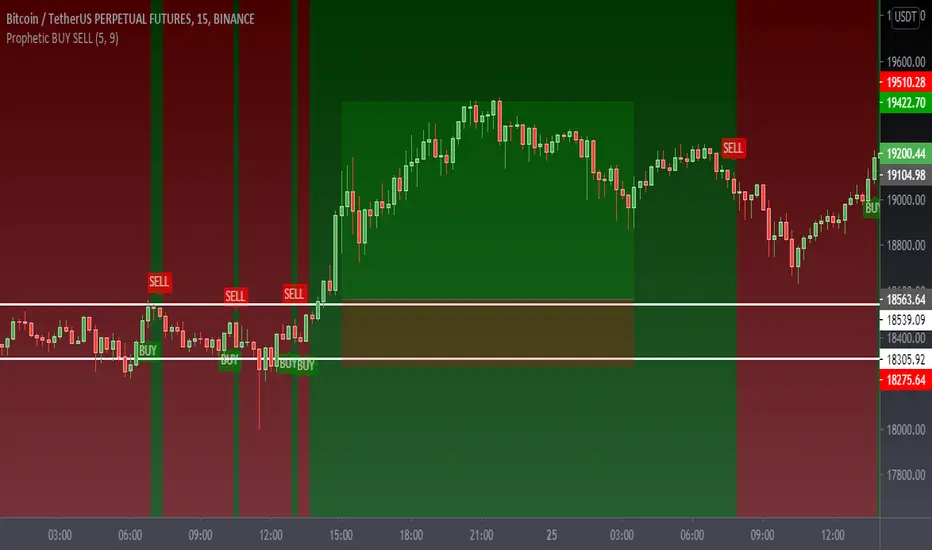
Prophetic BUY SELL IndicatorThis premium indicator will help you to do quick scalping on Cryptocurrencies, Forex, and Stocks.
This indicator is very simple to understand.
Green BUY Alert - Buy Signal Market is up
Red SELL Alert - Sell Signal Market is down
Caution:- Do not use it during market being choppy or sideways
Once the BUY signal appears the background changes green and same with SELL it turns red
can change the color according to requirements
It also has a moving average which also changes the color as the candles close above the MA or the below Default color are green and red
Please Like Share and Follow and if required please contact:- @mobudd (TELEGRAM)
or Ping me on trading view
Guys, It takes effort so please do not ask for free access.
You're always welcome to share any type of suggestion & feedback.
Foreks
Trendy Bar Trend Color LiteLite version of the original Trendy Bar Trend Color
This will only color the candlestick body of your chart
Can be used with solid, hollow, renko, or any other chart type
Custom coloring for Highs, Lows, and consolidation is removed

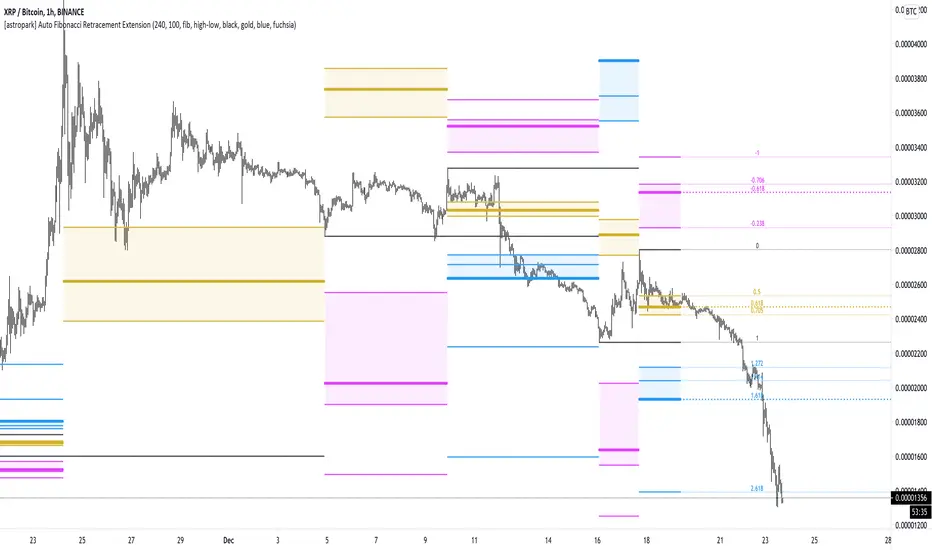
[astropark] Auto Fibonacci Retracement ExtensionDear followers,
today a new analysis tool for day trading, scalping and swing trading: Automatic Fibonacci Retracements and Extensions drawer!
It works on every timeframe and market, as it simply draws automatically most important fibonacci levels on the chart.
Based on the analysis window set (default 100 bars, but you can edit it as you like), it finds recent high and low and start drawing the following levels:
recent high and low (black)
golden retracement range: 0.5 * 0.618 * 0.705 fibonacci retracements (gold)
fibonacci extensions range above 1: 1.272 * 1.424 * 1.618 * 2.618 * 4.236 (blue)
fibonacci extensions range below 0: -0.238 * -0.618 * -0.706 * -1(fuchsia)
Whenever the indicator finds a new high or a new low, al fibonacci levels are re-draw automatically.
The indicator will let you:
change analysis window
enable displaying labels related to current fibonacci levels and/or prices
change colors
show/hide each specific level
How to use the indicator?
Basically, all techniques which apply to fibonacci tool are valid here too.
After a big move up or down, a new high or low is created and a retracement is expected: if trend is strong, retracement to golden ration 0.618 will be a perfect spot for buy or sell respectively in order to continue riding the trend.
In general a bounce is always expected when price hit 0.618 retracement , good to know for scalping traders, while swing trades will continue holding the trade for higher profits.
If the golden retracement range (0.5 - 0.705) is broken and then retested from the other side, a continuation move is expected towards previous high/low (fib level 1) and even more towards the fibonacci extensions range above 1 (1.618 - 2.618 - 4.236).
If the base of bounce and trend continuation on golden retracement range, traders can expect
price to hit again previous high/low and
if trend is strong, a consolidation near the previous high/low range (conditions that are respectively bullish and bearish)
do a further continuation towards -0.618 fib level range
Traders must always understand that
the higher the timeframe, the stronger is the meaning and so the reaction when a specific fibonacci level is hit
don't trade blindly, try to find confluences to have an higher chance to be in a winning trade in near future
money and risk management are very important, so manage your position size and always have a stop loss in your trades
As said, this indicators work on every timeframe and in all markets (Crypto currencies, stocks, FOREX, indexes, commodities). Here some examples:
BTCUSDT 1D: after a long run, a retracement is expected and a bounce at 0.618 golden level is more than obvious: perfect short (sell) entry
BTCUSDT 1D: again as previous example, after a long run, a retracement is expected as well as price's bounces back above
EURUSD 1h: lots of info here, directly in the chart below:
bounces on 0.618 golden zone
double top
price breaks 0.618 level and retests it from below targeting previous low
double bottom and bounce back towards golden zone
bearish consolidation at recent low and further decline towards 1.618 fib extension
AMZN 1h stock: lots of info here too, directly in the chart below:
new high is print, price retrace to golden zone
bounces on 0.618 golden zone
price breaks 0.618 level and retests it from below targeting previous low
double bottom and bounce back towards golden zone
rejection at golden zone, price falling targeting previous low again and probably 1.618 fib extension
price breaks hard previous low and hits fib extension range below recent low
price retraces back up towards new golden retracement range
golden retracement range is broken and used as support: targets are previous high and 1.618 extension
once 1.618 extension level is broken and retested successfully as support, price moves towards 2.618 fibonacci extension level
SPY (SPX500) index: lots of info in the chart
interesting to note that March 2020 huge dump can be totally mapped as a series of fibonacci level bounces, so you understand the importance of riding a trend now, right?
after the low was formed, price retraced perfectly to golden ration 0.618
each time price hit a golden level/range, it retraces creating double top and double bottom configurations too
In the chart below we can see the power of the double bottom at golden retracement level: targets are previous high and -0.618 fibonacci extension level
XAUUSD 15m: as we are in a lower timeframe, the default analysis windows has been reduced to 50.
What can we see here:
golden retracement and price is rejected towards previous low
golden retracement hit and price bounces back lower
new high is formed: golden retracement hit and price bounces back higher
price break previous high and hits fibonacci extensions -0.618 and -1
price continues rising forming a regular bearish divergence with RSI
once uptrend is broken, price falls dramatically
first target is 0.618 retracement level, where you see a very small retracement due to strength of sellers
second target is previous low, which is broken and retested many time from below (bearish retest)
third target is fibonacci extension range (in this case 1.414 is almost hit)
as an hidden bullish divergence with RSI was created, price goes back up
This is a premium indicator , so send me a private message in order to get access to this script.
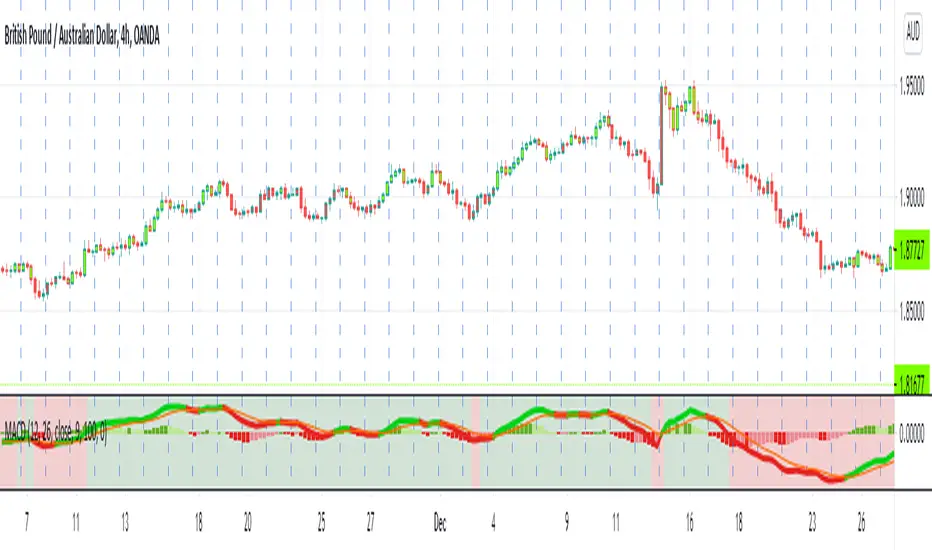
MACD with 3 strategiesMACD WITH 3 STRATEGIES
- Macd line change colour when cross the signal line
- Background Color change colour based on a moving average, on settings the value of the moving average can be changed 50,100,150,200
- Strategy one based on Macd lines with bar changing colours
- Strategy two based on Macd lines but with a different method
- Strategy three based on two other trending indicators
This indicator can be used to spot trends and changing of direction of the market and with the bar coloured its easier to identify them.
The strategy one can be used as confirmation of a trend or as changing direction integrated with other indicators like Rsi , Stochastic, Supertrend , Bollinger band, with ema option mode works better.
The strategy two can be use together with the back ground colour: When is red and the candles are red can be identified as strong drown trend.
When is green and the candles are green can be identified as strong up trend.
The strategy three can be used after checked the strategy two for more confirmation for a trend.
VERY IMPORTANT WHEN YOU TRY A NEW STRATEGY TEST IT IN A DEMO ACCOUNT FOR AT LEAST 3 MONTHS
Every donations will be devolved to cancer research and you ll have one month free trial.
If you want to purchase this indicator 30% will be devolved to cancer research.
Please leave a comment or message me if you want you have two weeks trial.
Enjoy!
Multi Time Frame Buy&Sell V4.0 [ALERTSETUP]Hi guys,this indicator Developed for Intraday and multi Time Frame Trading. Note: Invite only Script.Request to me Access permission to test this.
*** THIS IS STUDY VERSION ***
Time Frame : can use for 15 min / 30 min / 1h / 4h time
15 min configuration is best result for bitcoin and ethereum .
This can be used : Crypto Currency/ Bitcoins / ethereum ,Forex,currencies ,Index ,Commodity Gold / silver , Oil Market and in Equity / Futures
ETHUSDT Futures 15min
BTCUSDT Futures 15min:
GOLD /USD FOREX 15min:
HOW IT WORKS:
this indicator analyze EMA&SMA support and resistance then combine with pivot point and fibo levels is used to calculate the signals.and finally show entry label on
chart with target point and stop loss
HOW TO USE:
Creating a signal is as simple as adding the indicator called to your chart(buy or sell)label and background color change ( green=buy / red = sell)
green line is target and black line is stop loss.
in top of setting page you can see noise filter option . that can change it to get better result and reduce noise. in setting can set 3 target level and stoploss
NOT:all information show to info panel in chart.
strategy tester : enabled .All you can test this in live market in any segment.
NOT: can to change noise filter in setting setup until to get best result.
Choose any Date Month Year to Current Date and check the results below in the Strategy Tester.
REPAINT/NO REPAINT : No Repaint ,entery labal(buy or sell) and Background Color wont change. In the current candle position wait for the candle to close to see the
stability.
"Set alert": Select "Once per bar close" for your alert options.
There are 5 alerts:
- BUY
- SELL
- BUY OR SELL (for free TV users)
- take profit
- stop loss
To Get access - Send me a private chat message in tradingview.com to get access.Or request in comment section below.
Review and Feedback.Thank you!
Any issues report to me to Fix.Thank you!
Use the link below to obtain access to this indicator:

[astropark] DMI/ADX strategy [alarms]Dear Followers,
today I'm happy to share with you my DMI / ADX Strategy .
It provides directional trend information, so if a bullish or a bearish trend is going to start. Statistically it works better on lower timeframes (from 5 minutes to 1 hour).
It is both a Swing and Scalping Strategy indicator , based on a simple trend following theory , good for trading FOREX, Indexes, Stocks, Commodities and Cryptocurrencies.
To help in Taking Profits, the strategy integrates 2 special other than bull/bear signals:
Overbought and Oversold RSI Signals , which appear both as darker background (the darker the color, the more the price is in overbought/oversold) and green "ob"-"tp" / red "os"-"tp" labels (they optionally pop up only on a configurable stronger overbought/oversold condition) (you can enable/disable it optionally)
Peak Profit Tracker , which resets every time a new trade starts and keeps track of price fluctuation during the trade: the message is don't be too greedy and take profits or lock them with a stoploss in profit (you can enable/disable it optionally)
You can edit many options in order to
have more/less bull/bear signals
enable/disable showing bull/bear signals
enable/disable showing RSI TP signals (you can edit RSI length, overbought (OB) and oversold (OS) levels)
enable/disable showing peak profits on each trade
The user who wants to use this strategy, especially via an automated bot, must always set a stoploss (example 150$ from entry on bitcoin ) or use a proper risk management strategy .
This is not the "Holy Grail", so use it with caution. It's highly suggested to use a proper money management .
This script will let you set all notifications you may need in order to be alerted on each triggered signals.
You can find the strategy version for backtesting here below:
Here there are some examples how this DMI / ADX strategy works on many markets:
LTC/USDT 15m
BTC/USD 15m
BNB/BTC 15m
ETH/USD 15m
GOLD (XAU/USD) 15m
GOLD (XAU/USD) 1h
FB 15m
AAPL 15m
TSLA 1h
BANKNIFTY Index 5m
NIFTY 50 Index 5m
This is a premium indicator , so send me a private message in order to get access to this script .

Crazy Signals - Early Detection of a Short Term TrendThis is a simple yet powerful tool that helps you detect Trends for the short term.
Time Frames:
- Avoid using very small time frames as there will be too many signals in a short period
- Intraday: 15 mins, 30 mins, 60 mins seem to detect trends well
- Overnight Trades: 60 mins
- Positional: 1D is recommended
- For Investment, one can week a weekly timeframe
Rules of Engagement:
1. The Upward Arrow (Green) indicates possible upside. While the Downward Arrow (Orange) indicates a possible downside
2. Not every Signal has to be traded. Rules to check before taking a trade:
a. The candle on which the Signal is generated, should be either small or medium size compared to other candles on the chart. If the candle is large, ignore it
b. In case of a Buy Signal, entry should be made once the Price crosses above the High made on the Signal Candle
c. In case of a Sell Signal, entry should be made once the Price crosses below the Low made on the Signal Candle
d. For extra caution, in steps b & c, one can wait for the current candle to close higher than the High of Signal Candle for Buy Signal and close lower than the Low of Signal Candle (this is for extra safe traders)
This tool is to be used for trades that usually last for a few candles.
Please do your own research before trading.

Ultimate VWAP Bands- Ultimate VWAP Bands is a script that helps to decide and further clarify areas of oversold and overbought conditions.
- For example, when the price is in the lowest band it is extremely oversold relative to the VWAP . Hence it should be considered a good place to buy with a high risk to reward payoff.
- Each band is set at a fixed offset away from the VWAP . The "VWAP Band Multiplier" adjusts this and is a key part of the script. This allows the indicator to be adjusted based on the assets volatility . For example, with Crypto. A multiplier of 1 would be strongly advised. Whilst a multiplier of 0.1-0.25 would be useful for currency pairs.
- This indicator can be used for all manners of trading. However, it is most effective when used for scalping and swing trading.

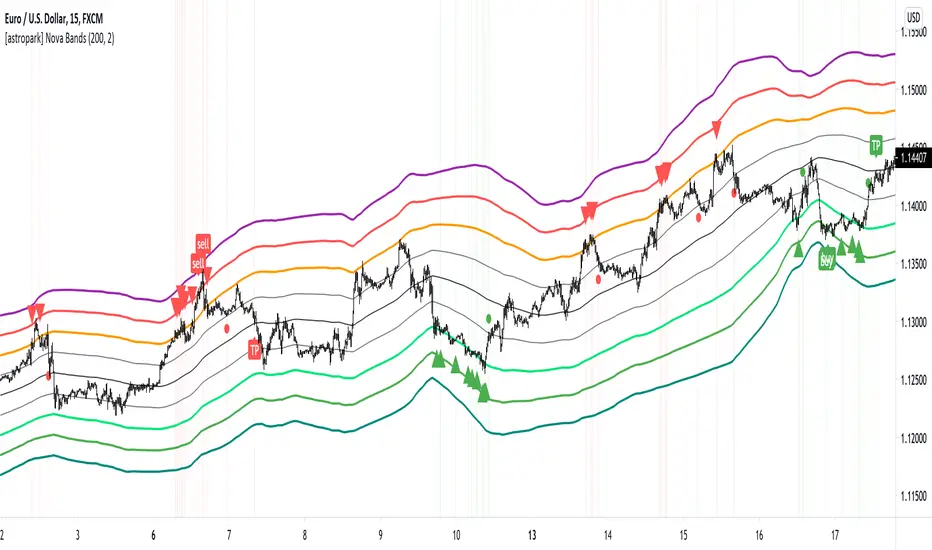
[astropark] Nova BandsDear followers,
today a new analysis and scalping tool for day trading on low timeframes (5-15 minutes) or to plan swing trades on hourly timeframes. It can be used also on high timeframes just for analysis current market trend.
The indicator plots a series of levels which create a nice bands flow.
The slope of levels make you easily understand when price is in consolidation, in uptrend or in downtrend.
The golden rule is always the same: buy low and sell high .
This indicator plots:
3 "price is low here" levels (from dark green to light green)
3 "price is average here" levels
3 "price is high here" levels (from purple to orange)
When bands are flat, price is in consolidation and this is best condition to trade with nova bands.
When price reaches higher bands, you will open a short position with targets below levels, fully closing your position when price hits the average level (black).
Here an example on Bitcoin on 15m using 1h resolution:
The same applies when price reaches lower bands, you will open a long position with targets above levels, fully closing your position when price hits the average level (black).
When bands get nearer and nearer is called "Bands Squeeze": price is next to a main breakout move, volatility is coming!
Here an example of SPX500: after long consolidation and bands getting nearer and neared, we had the breakout, downwards in this case.
In this screenshot you can see what signals algorithm provided:
Our suggestion is to play safe these kind of scenarios, no reason to FOMO buy/sell. Just wait for price consolidation / getting back inside the bands.
For example you would have skip first three buy signals, while you would have longed the last two as price came back inside bands after the big volatility which made price went below bands.
Another example is TSLA stock on 15m with 1h resolution:
Price touched the first bullish level and made a big move upwards, breaking bands with a +90% move.
In this case, you would have skipper first 2 sell signals, while you would have accepted next two with stoploss above recent high.
Acceptable also the other two sell signals, which you may have closed when price retraced to lower levels:
You can of course run trends like this buying on price hitting bullish/lower levels after a long consolidation and sell on price hitting middle and higher levels:
A trader who wants to be a winner must understand that money and risk management are very important, so manage your position size and always have a stop loss in your trades.
Here some examples how the indicator works on different markets:
EURUSD 15m with standard settings and 1h resolution
GOLD (XAUUSD) 15m with standard settings and 1h resolution
Facebook (FB) 15m with standard settings and 1h resolution
This is a premium indicator , so send me a private message in order to get access to this script.
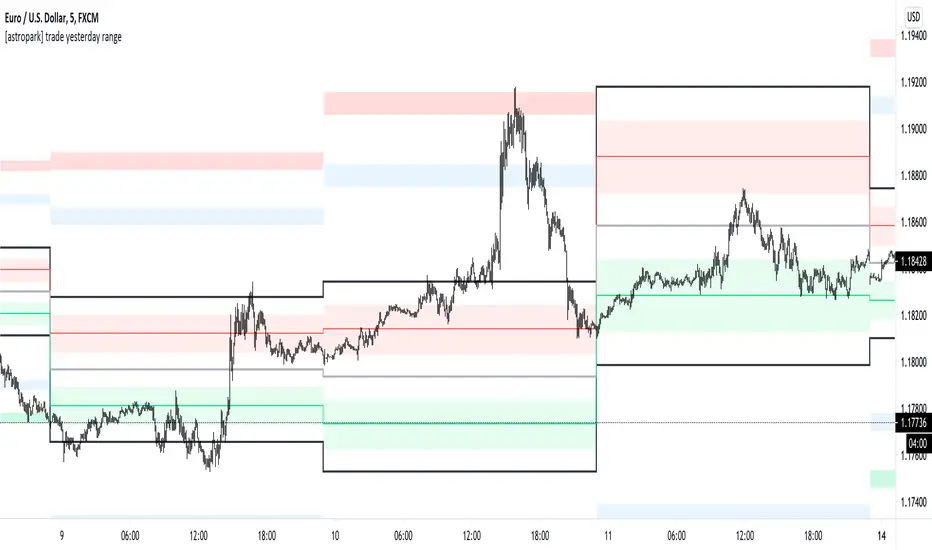
[astropark] trade yesterday rangeDear followers,
today a nice scalping tool for day trading on low time frames (1-3-5 minutes)!
Each day the indicator will print some important levels and ranges related to the trading day before:
yesterday high (black line)
yesterday day range averange (silver line)
yesterday low (black line)
average between yesterday high and yesterday average, together with a resistance range (red)
average between yesterday low and yesterday average, together with a support range (green)
two extension ranges above yesterday high (first is blue, second is red)
two extension ranges below yesterday low (first is blue, second is green)
Trading levels is one of most effective trading tecniques:
once a level is broken upwards, you can long (buy) the bullish retest with stoploss below recent low
once a level is broken downwards, you can short (sell) the bearish retest with stoploss below recent high
consolidation below or at a resistance level is bullish, so long (buy) breakout upwards and long more on a bullish retest of broken level
consolidation above or at a support level is bearish, so short (sell) breakout downwards and short more on a bearish retest of broken level
many times you see a level to be tested 2 or 3 times: short (sell) double and triple top, long (buy) double or triple bottom
Here you can see the levels described above and basic usage in a consolidation trading day:
A trader who wants to be a winner must understand that money and risk management are very important, so manage your position size and always have a stop loss in your trades.
Here you can see many examples on how to use this indicator.
Triple top on yesterday range high: perfect short setup (5 take profits targets in the example)
Resistance levels broken: long setup on bullish retest (2 take profits targets in the example)
Double top and support broken: 2 short setups (2 and 3 take profits targets in the example)
Here some examples how to basically use the indicator in a consolidation trading day: short (sell) resistance levels, long (buy) support levels
This is a premium indicator , so send me a private message in order to get access to this script.
Dynamic Dots Dashboard (a Cloud/ZLEMA Composite)The purpose of this indicator is to provide an easy-to-read binary dashboard of where the current price is relative to key dynamic supports and resistances. The concept is simple, if a dynamic s/r is currently acting as a resistance, the indicator plots a dot above the histogram in the red box. If a dynamic s/r is acting as support, a dot is plotted in the green box below.
There are some additional features, but the dot graphs are king.
_______________________________________________________________________________________________________________
KEY:
_______________________________________________________________________________________________________________
Currently the dynamic s/r's being used in the dot plots are:
Ichimoku Cloud:
Tenkan (blue)
Kijun (pink)
Senkou A (red)
Senkou B (green)
ZLEMA (Zero Lag Exponential Moving Average)
99 ZLEMA (lavender)
200 ZLEMA (salmon)
You'll see a dashed line through the middle of the resistances section (red) and supports section (green). Cloud indicators are plotted above the dashed line, and ZLEMA's are below.
_______________________________________________________________________________________________________________
How it Works - Visual
_______________________________________________________________________________________________________________
As stated in the intro - if a dynamic s/r is currently above the current price and acting as a resistance, the indicator plots a dot above the histogram in the red box. If a dynamic s/r is acting as support, a dot is plotted in the green box below. Additionally, there is an optional histogram (default is on) that will further visualize this relationship. The histogram is a simple summation of the resistances above and the supports below.
Here's a visual to assist with what that means. This chart includes all of those dynamic s/r's in the dynamic dot dashboard (the on-chart parts are individually added, not part of this tool).
You can see that as a dynamic support is lost, the corresponding dot is moved from the supports section at the bottom (green), to the resistances section at the top (red). The opposite being true as resistances are being overtaken (broken resistances are moved to the support section (red)). You can see that the raw chart is just... a mess. Which kinda of accentuates one of the key goals of this indicator: to get all that dynamic support info without a mess of a chart like that.
_______________________________________________________________________________________________________________
How To Use It
_______________________________________________________________________________________________________________
There are a lot of ways to use this information, but the most notable of which is to detect shifts in the market cycle.
For this example, take a look at the dynamic s/r dots in the resistances category (red background). You can see clearly that there are distinctive blocks of high density dots that have clear beginnings and ends. When we transition from a high density of dots to none in resistances, that means we are flipping them as support and entering a bull cycle. On the other hand, when we go from low density of dots as resistances to high density, we're pivoting to a bear cycle. Easy as that, you can quickly detect when market cycles are beginning or ending.
Alternatively, you can add your preferred linear SR's, fibs, etc. to the chart and quickly glance at the dashboard to gauge how dynamic SR's may be contributing to the risk of your trade.
_______________________________________________________________________________________________________________
Who It's For
_______________________________________________________________________________________________________________
New traders: by looking at dot density alone, you can use Dot Dynamics to spot transitionary phases in market cycles.
Experienced traders: keep your charts clean and the information easy to digest.
Developers: I created this originally as a starting point for more complex algos I'm working on. One algo is reading this dot dashboard and taking a position size relative to the s/r's above and below. Another cloud algo is using the results as inputs to spot good setups.
Colored Bars
There is an option (off by default, shown in the headline image above) to fill the bar colors based on how many dynamic s/r's are above or below the current price. This can make things easier for some users, confusing for others. I defaulted them to off as I don't want colors to confuse the primary value proposition of the indicators, which is the dot heat map. You can turn on colored bars in the settings.
One thing to note with the colored bars: they plot the color purely by the dot densities. Random spikes in the gradient colors (i.e. red to lime or green) can be a useful thing to notice, as they commonly occur at places where the price is bouncing between dynamic s/r's and can indicate a paradigm shift in the market cycle.
_______________________________________________________________________________________________________________
Timeframes and Assets
_______________________________________________________________________________________________________________
This can be used effectively on all assets (stocks, crypto, forex, etc) and all time frames. As always with any indicator, the higher TF's are generally respected more than lower TF's.
Thanks for checking it out! I've been trading crypto for years and am just now beginning to publish my ideas, secret-sauce scripts and handy tools (like this one). If you enjoyed this indicator and would like to see more, a like and a follow is greatly appreciated 😁.

London Open Range Breakout by KviateqThis script is what I currently use to day trade forex on a 5-minute timeframe.
The script features Multi-timeframe EMA20 that uses timeframe multipliers and is smoother by the factor by which you're multiplying your current timeframe.
Default settings are set to display EMA20 on the current (M5) timeframe, as well as M15, H1, H4 and D1 timeframes.
The background color changes intensity based on how many conditions are met - are all EMAs in the right order, is the current close above/below all the EMAs.
Featured is also a range set to 1 hour since the London breakout (can be changed to M15, or however long you'd like - my current setting is 30 minute).
Also featured are levels that I find to be of most importance - such as Daily and Weekly Open, Previous Day's and Week's Highs.
The idea is to only take trades when all stars align - EMAs, break above/below the Opening Range and not to long/short into an important level.

Fx Auto Supply and Demand [For Day Trading Only]Fx Auto Supply and Demand automatically plots important supply and demand levels for Forex day trading.

Efficient Support & Resistance LevelsThis script is a mixture of my two previous scripts "True Strong Classical Support/Resistance Levels" and "Hidden Supports & Resistances + Round Levels". This combination brings on better identification of the most efficient support/resistance levels.
Note that "Hidden SnR Levels" part of the code is only expected to work on Forex charts, but apart from that, the other parts could be applied to any chart.
The script may:
- Draw classical support/resistance levels which retraced the price previously, aided by multi-timeframe analysis
- Draw hidden support/resistance levels based on psychological patterns of the price
- Adjust to wicks better than Pine Script built-in pivot functions
- Differ the levels color based on chart reactions
- Merge nearby classical levels to avoid congestion on the chart
Feel free to use it and send me your thoughts.

PpSignal Regression Weierstrass functiongHi, this is an indicator based on the slope calculation of the resultant of this moving average slope, the Weierstrass approximation theorem emerges that gives us information about where the price can go, this is only a probability of occurrence depends on the formation of the slope.
Buy when the color turns blue and aqua and sell when the moving average changes to red color ... it also has alarms

ETS Breakout LevelsThis indicator mimics the breakout levels a professional trader would draw and watch for trading opportunities. It is a very powerful tool to have.
The lines are drawn as soon as a new breakout level is detected, and the line is then automatically extended to the right, making it easy to see when the market reacts to it.
Knowing where important levels on a chart are, immediately takes you from having no idea where the market might make a big move, to being a trader ready to take action at the right time.
The Breakout Levels indicator is also very good at keeping you out of the market when it's simply choppy and difficult to trade, because the breakout levels will most likely fall outside of the choppy sideways consolidation area, but still prepare you for when the market finally picks a direction again.
This indicator also includes colored time bands that mark times during the trading day where historically stocks often reverse course, or may enter a period of consolidation. These times coincide with tea breaks, lunch breaks or times when news are typically announced.
For Forex traders, there are colored session bands that help you to easily see when the major markets are open.
What Makes It So Powerful?
- Give you a signal as early as possible and does not "repaint" once the bar completes
- Reacts to fast market direction changes like a master trader
- Is super easy to understand and implement in your trading
- Can be used for Forex, Stocks and Crypto
- Works on all timeframes
This indicator also has a number of options you can change in Settings:
1. "Safety Margin" - I keep this at zero, but if you want a bigger "buffer" for safety before entering a trade you can increase this value.
2. "Hidden Above Interval (Minutes)" - The Forex sessions or Stock important daily times can be set to be hidden above a certain timeframe to keep your charts clean.
3. "Show Moving Averages" - All of the moving averages that are included for convenience can be shown or hidden by setting this value.
3.1. The next 5 settings all deal with moving averages that can be shown or hidden individually.
4. "Show Stock Pivot Times" - There are a number of trading times for US Stocks that are important during the trading day, and this setting will highlight them.
4.1. "Show Main Stock Pivot Times" - This shows only the Stock trading times that are deemed the most important, and around these times the market often change direction (e.g. after the morning break, after lunch, etc.)
5. "Show Forex Sessions" - Does pretty much what it says, and you can also adjust the hours if you wish.
6. "Extreme Move Reversal Points" - If an extreme market move has been detected, and this is enabled, a "X" will be shown above or below the bar to indicate that the market might reverse.
7. "More Signals" - If you want to see more potential breakout levels, enable this option.
8. "Show VWAP" - This will include the VWAP indicator as a convenience if selected.
How To Use the ETS Breakout Levels Indicator
1. Add the indicator to any chart you wish to trade, Crypto, Forex or Stocks and set it to the timeframe you prefer. For instance, I use it on 1 minute and 5 minute charts for daytrading Stocks. For Forex I generally use a 15 minute chart, and longer timeframes for Crypto.
2. Open the Settings and change values to suit your requirements as described above.
3. When the indicator has determined that a new breakout level has formed, it will draw a line and extend it to the right so that you can see when future bars come close to it.
4. Price action will either bounce off it, or pierce through it and continue on.
5. If the market is relatively far away from smaller moving averages such as the 9 EMA or 20 EMA, expect that the price action might first move back to the moving averages before continuing in the new direction identified by the indicator.
6. When these levels are broken, it is often an indication of a breakout occurring and it can give you some very significant market moves.
This is an "invite only" script, which means that you will need to let me know that you're interested in it before you can get access to it. This is a paid script, please follow the link in my profile to get the details or ask me directly. It may take up to 48 hours for me to respond, but I do my best to respond as quickly as possible. You will get 7 days to test it for yourself on all your charts with no restrictions.

ETS Trending ArrowsThis indicator is the end result of years of trial and error to create an indicator that aims to mimic market entry points that a professional trader would take.
It has arrows that clearly show potential market entry points, and suggested stop-loss levels. What I like about it is that it generally responds as fast to market changes as a good trader would, leaving you enough time to still validate the move before taking it.
This basically levels the playing field, because even if you're a rookie trader, or maybe an experienced trader in a slump, this indicator can help you to identify possible trading entry points that is responsive to market moves, and that can be used on different timeframes based on how you want to trade. And if you're an experienced trader, this indicator will help you like a good trading buddy to make good trading decisions.
What Makes It So Powerful?
- Give you a signal as early as possible and does not "repaint" once the bar completes
- Reacts to fast market direction changes like a master trader
- Is super easy to understand and implement in your trading
- Can be used for Forex, Stocks and Crypto
- Works on all timeframes
How To Use The ETS Trending Arrows Indicator
1. Add the indicator to any chart you wish to trade, Crypto, Forex or Stocks and set it to the timeframe you prefer. For instance, I use it on 1 minute and 5 minute charts for daytrading Stocks. For Forex I generally use a 15 minute chart, and longer timeframes for Crypto.
2. Open the Settings and change values to suit your requirements:
2.1. "Early Trigger Live Signals / Stable Signals" - When you select "Stable Signals", the arrows will appear once the bar closes, on the new bar. Selecting "Early Trigger" will signal instantly and can give you an early entry, but may update in some cases as conditions change.
2.2 "Show More Signals" - This pretty much does what it says. If you don't want all possible signals, this will scale things back a bit and give you fewer signals.
2.3. "Show 20, 50, 200 Moving Averages" - This is just a convenience, and is provided to help you exit trades, which I typically do when price crosses back over the 9 EMA or 20 EMA.
2.4. "Show 9 Expo Moving Average" - Also provided for convenience, and separate in case you don't want this level of detail.
2.5. "Show Immediate Reversals" - Personally I don't use this setting, but someone requested that I add it. What it will do is if there is a signal, which then immediately passes the "stoploss" dotted line, this will immediately give a signal in the opposite direction.
2.6. "Show Bollinger Bands" - This is also only provided for convenience, I use Bollinger Bands to determine where the market move is in relation to the average deviation.
2.7. "Bollinger Bands Length" - Simply the regular BB length setting.
2.8. "Bollinger Bands Deviation" - I use a 2.5 setting by default in order to better identify areas where the price action is really far beyond where it should be.
3. Now that you've set things up, all you need to do is to wait for a signal. As mentioned earlier, the signals will react differently based on whether you chose "Early Trigger Live Signals" or "Stable Signals". If you opt for "Early Trigger Live Signals", like I do, you should pay attention to where the market currently is in relation to the closest moving average, like the 9 EMA or 20 EMA. Keep in mind that price will often signal a new move, but then first move back to the average, before continuing in the new direction identified by the trading arrow.
4. These signals are intended to identify new trending moves, and for that reason, if the market moves against the signal, you should not hold on to your position hoping that it will turn in your favor.
5. When the market is moving in your favor, resist the urge to exit quickly, and use either (or both) the 9 EMA and 20 EMA to exit your trades. A good approach is to use the 9 EMA to exit a portion (maybe 50%) of your trade, and exit out of the rest once price closes above or below the 20 EMA depending on the direction of your trade.
This is an "invite only" script, which means that you will need to let me know that you're interested in it before you can get access to it. This is a paid script, please follow the link in my profile to get the details or ask me directly. It may take up to 48 hours for me to respond, but I do my best to respond as quickly as possible. You will get 7 days to test it for yourself on all your charts with no restrictions.

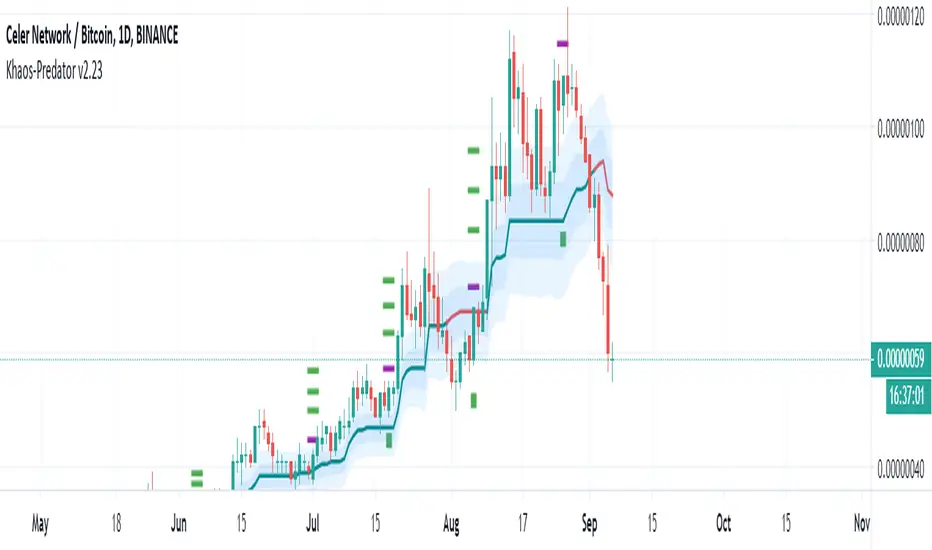
Khaos-PredatorThis Indicator is a full trading system that offers setups with Entries and Targets and Trade Management. This indicator is very accurate because it uses advanced setup detection and filtering logic.
There are 2 conditions that must occur for you to take a trade:
1) Price must move beyond the purple dot
2) The baseline must be green for long trades, or red for short trades.
The setup is triggered if the price passes the purple dot. Do not enter the trade unless price passes the purple dot. (You may wait for pullback to enter if you wish – but only after price traded beyond the purple dot firstly.) Remember, the trade is NOT active unless price moves beyond the purple dot.)
Each setup has 3 possible targets, which are dots colored green for longs and red for shorts.
You can use the baseline (which is a trend-line that is either green for bullish or red for bearish) to filter trades. You should only enter long trades if the baseline is green and only enter short trades if the baseline is red. One strategy would be if you enter a trade long, and reach the first target, you can take some profits, but still let the some of the position run and use the baseline to manage the trade.
Also, you can use the baseline for trailing stops.
To summarize:
• Purple Dot = Entry Trigger
• Green Dots = Long Targets (3 of them, for different price targets: target 1, 2 and 3)
• Green Square = Long Stop
• Red Dots = Short Targets (3 of them, for different price targets: target 1, 2 and 3)
• Red Square = Short Stop
The great thing about this indicator is that its universal, there are no settings necessary -- just put it on the chart and it finds high probability setups and paints it on the chart as they occur. There is NO Repainting with this indicator.
Of course, you can add other indicators if you wish, and even add this indicator to your existing trading system.
Again, this indicator does NOT repaint.
Once a setup is found, the indicator draws the entry trigger price and the targets at the setup bar close.
Setup Alerts are fully supported, via email, sms, and desktop notification.
*If you wish to license this indicator, please contact me via private message for details regarding access. Thank you.
LEGAL STUFF:
Risk Disclosure
Futures , forex, stock, crypto and derivative trading contains substantial risk and is not for every investor. An investor could potentially lose all or more than the initial investment. Risk capital is money that can be lost without jeopardizing ones’ financial security or life style. Only risk capital should be used for trading and only those with sufficient risk capital should consider trading. Past performance is not necessarily indicative of future results
Hypothetical Performance Disclosure
Hypothetical performance results have many inherent limitations, some of which are described below. no representation is being made that any account will or is likely to achieve profits or losses similar to those shown; in fact, there are frequently sharp differences between hypothetical performance results and the actual results subsequently achieved by any particular trading program. One of the limitations of hypothetical performance results is that they are generally prepared with the benefit of hindsight. In addition, hypothetical trading does not involve financial risk, and no hypothetical trading record can completely account for the impact of financial risk of actual trading. for example, the ability to withstand losses or to adhere to a particular trading program in spite of trading losses are material points which can also adversely affect actual trading results. There are numerous other factors related to the markets in general or to the implementation of any specific trading program which cannot be fully accounted for in the preparation of hypothetical performance results and all which can adversely affect trading results
ETS MA Deviation ExtremesWhile trading, I noticed that emphasis is often placed on how far price has moved from the moving average (whichever a trader prefers). In these cases I also found that Bollinger Bands only sometimes played a factor in determining whether price had moved "too far" from the moving average to potentially result in a sharp move back to the average.
Because I wanted something more objective than a "gut feeling" that price has moved away from the average enough to make it move back, I decided to see what I could do to determine the standard deviation of how price action moved away from the average , in order to determine when it could potentially have a "rubber band effect" to jump back to the "norm". The result of that is the ETS MA Deviation Extremes indicator, and I hope that it will help you in your trading.
The indicator also has bar coloring included, which can be turned off, which gives a good on-chart visual to warn you that the price action might reverse. This has often helped me to be a bit more cautious before just jumping into a trade that might be on the brink of reversing and taking my position out, and it actually turned out to be a good indicator for a reversal trade strategy.
The histogram bars give an indication of how far the price has moved away from the average, and I look for a potential reversal as soon as the histograms move back inside the deviation lines after having been outside it. The bar coloration actually depend on more than one set of deviation lines, but putting all of that on the chart just makes it confusing, so I removed the ones that I felt were not essential to make it clearer.
I hope it helps you in your trading and makes it easier for you to trade successfully!

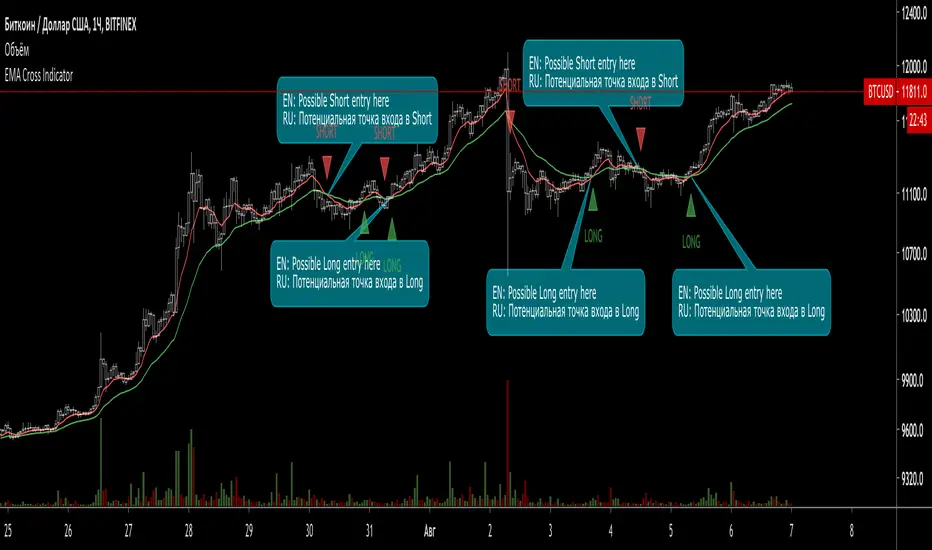
EMA Cross Indicator (with signals)This indicator shows 2 EMA (Long and Short) Cross and gives a possible entry point for a trade.
When Short EMA (red line) line crosses Long EMA (green) from bottom to top - this is a possible Long trade entry point.
When Long EMA (green line) line crosses Short EMA (red) from bottom to top - this is a possible Short trade entry point.
In both cases (basically, all the crossovers) are indicated with "Long" and "Short" labels.
Works with Crypto (from 30 min timeframe and higher)
Stocks (from 1 hour timeframe and higher)
Commodities (from 1 hour timeframe and higher)
Forex (from 1 hour timeframe and higher)
Consider using it with respect to Your trading style, money- and risk-management as well as other indicators.
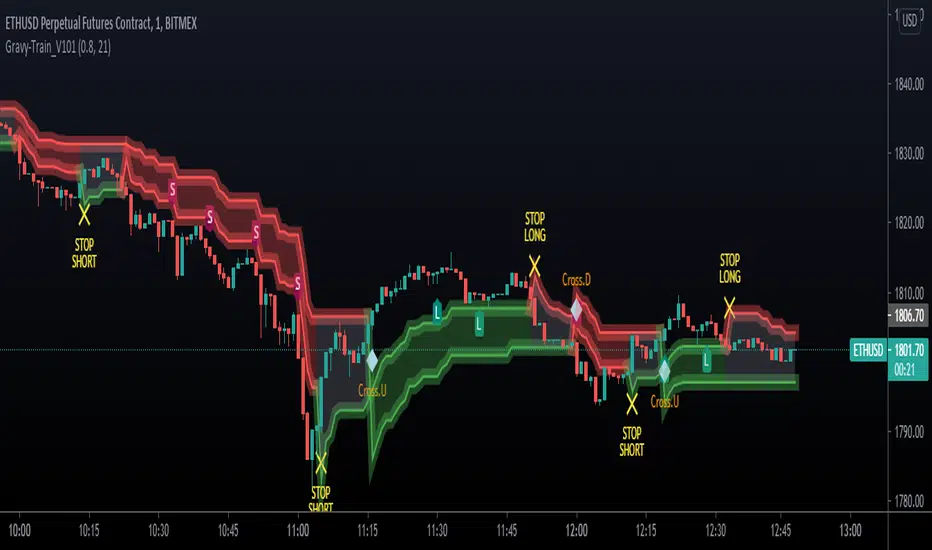
UTG - Gravy TrainThe most complex indicator we've ever developed.
Works on ALL MARKETS!
Gravy Train is a ALL IN ONE - ONE GLANCE indicator.
- It allows you to gauge trend, gives you appropriate LONG & SHORT identifiers
- It identifies when the trades should be over
- Cloud based support & resistance Zones drawn on the chart
- It keeps you OUT of the market in areas of indecision
- It works on ALL timeframes
- Takes the emotion out of trading various markets
- Gravy Train is Unity Trading Groups bread and butter for Scalping, Swing Trading, Position Trading & Day Trading
Unity Trading Group is proud to present Gravy Train!
To gain access to this script, you can find our details in our Signature, use the links below to find out!
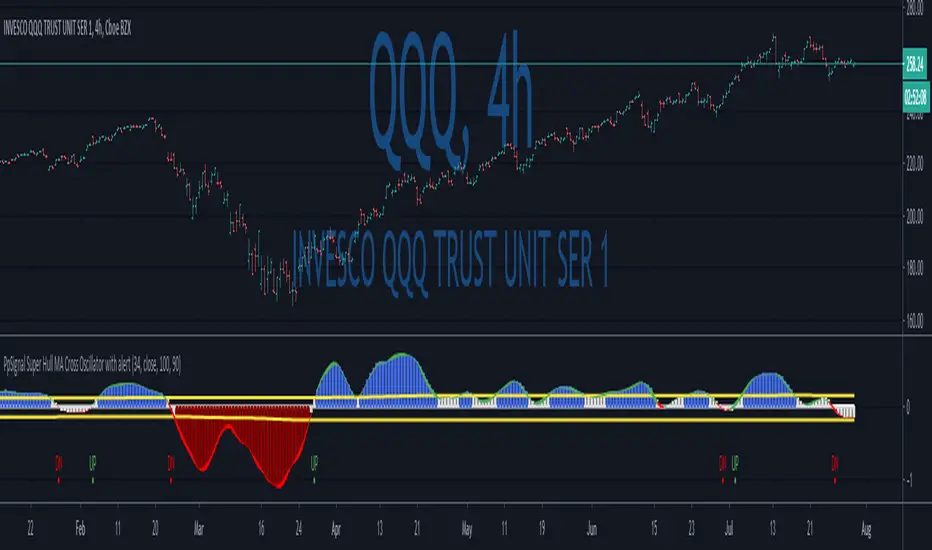
PpSignal Super Hull MA Cross Oscillator with alertWe have a Super Hull Move average oscillator style.
Super Hull, it is a hull move average open-close, smooth with elder method.
So, when you have a green color (hull cross up 0 Line), you have a buy signal.
When you have q red color (hull cross down 0 Line) sell signal.
Enjoy it...
Musashi MTF Trend HeatMapThis indicator compliments the Musashi TrendBars and allows convenient multi time frame analysis.
This HeatMap, shows 5 different time zones, each with color codes to indicate the trend expression of a corresponding timeframe.
- Dark Green = Good Uptrend (ok to enter short)
- Light Green = Uptrend but it can be exhausted (put in protective stops)
- Cyan = In Bull Trend but pulling back (be careful, maybe put in protective stops)
- Dark Red = Good Downtrend (ok to enter short)
- Orange = Downtrend but it can be exhausted (put in protective stops)
- Magenta = In Bear Trend but pulling back (be careful, maybe put in protective stops)
The dark grey markers on the Heat Map show when markets are not having strong trends.
*If you wish to license this indicator, please contact me via private message for details regarding access. Thank you.
LEGAL STUFF:
Risk Disclosure
Futures , forex, stock, crypto and derivative trading contains substantial risk and is not for every investor. An investor could potentially lose all or more than the initial investment. Risk capital is money that can be lost without jeopardizing ones’ financial security or life style. Only risk capital should be used for trading and only those with sufficient risk capital should consider trading. Past performance is not necessarily indicative of future results
Hypothetical Performance Disclosure
Hypothetical performance results have many inherent limitations, some of which are described below. no representation is being made that any account will or is likely to achieve profits or losses similar to those shown; in fact, there are frequently sharp differences between hypothetical performance results and the actual results subsequently achieved by any particular trading program. One of the limitations of hypothetical performance results is that they are generally prepared with the benefit of hindsight. In addition, hypothetical trading does not involve financial risk, and no hypothetical trading record can completely account for the impact of financial risk of actual trading. for example, the ability to withstand losses or to adhere to a particular trading program in spite of trading losses are material points which can also adversely affect actual trading results. There are numerous other factors related to the markets in general or to the implementation of any specific trading program which cannot be fully accounted for in the preparation of hypothetical performance results and all which can adversely affect trading results
