RS Stock + Chart Pattern Pine ScreenerThis script is a comprehensive stock screener & pattern detector based on Mark Minervini’s Trend Template, enhanced with breakout detection, range tightening indicator (RTI), ATH tracking, and flag pattern recognition. It’s designed to help traders quickly identify high-potential trend setups on any timeframe.
🔑 Features
✅ Minervini Trend Template (8 Core Rules)
Implements the well-known Minervini checklist used by top momentum traders:
Price above the 150 & 200 SMA
150 SMA above 200 SMA
200 SMA trending up for at least 1 month
50 SMA above both 150 & 200 SMA
Price above 50 SMA
Price at least 25% above 52-week low≈
Price within 25% of 52-week high
RS Rating (relative strength) above 70
📉 Range Tightening Indicator (RTI)
Detects volatility contractions that often precede explosive moves.
📈 Breakout & Breakdown Finder
Detects pivot breakouts and breakdowns using highs/lows tests.
🏆 All-Time High Tracker
Find the stock’s all-time high (ATH).
🚩 Bull & Bear Flag Detection
Identifies bullish and bearish flag patterns based on pole strength, pullback depth, and consolidation length.
Automatically find the flags on your screener.
FLAG

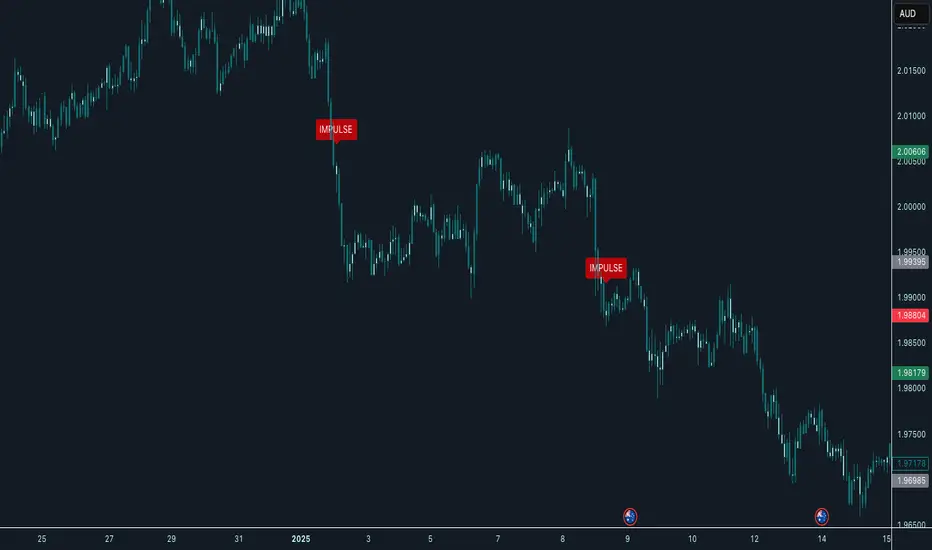
Impulse Indicator New Capital FXThe Impulse Indicator is designed for traders who demand precision when identifying explosive market moves. This tool detects powerful short-term impulses by combining ATR-based volatility analysis with tactical price action patterns.
Key Features:
1. Dynamic Impulse Detection: Spots major price shifts based on a 5-bar momentum structure and ATR volatility filter.
2. Adaptive Volatility Filter: Filters out weak signals with a customizable ATR multiplier.
3. Cooling Period Logic: Reduces signal noise by enforcing a minimum bar spacing between impulses.
4. Clear Visual Signals: Plots "IMPULSE" labels directly on your chart for instant recognition.
How It Works:
The markets explode in a short-period of time, the indicator spots the move and plots a label, now if you're trading mean reversion pairs, you can look to go against the impulse, or if you want to catch trends you can use the indicator for potential continuation setups.
Customizable Settings:
ATR Multiplier (Best with 3,4,5)
Cooling Period (Standard is 5 bars, which is good)
ATR Length (The standard 14 period)
Flag Screener [QuantVue]Flag Screener is a screening tool that identify bull and bear flags in up to 40 different symbols.
The indicator takes a comma separated list of symbols and then scans the symbols in real time to detect bull or bear flags.
What are flags
Flags are continuation patterns that occur within the general trend of the security. A bull flag represents a temporary pause or consolidation before price resumes it's upward movement, while a bear flag occurs before price continues its downward movement.
Both flag patterns consist of two components:
The Pole
The Flag
The pole is the initial strong upward surge or decline that precedes the flag. The pole is usually a fast move accompanied by heavy volume signaling significant buying or selling pressure.
The flag is then formed as price consolidates after the initial surge or decline from the pole. For a bull flag price will drift slightly downward to sideways, a bear flag will drift upward to sideways. The best flags often see volume dry up during this phase of the pattern.
Indicator Settings
Both components are fully customizable in the indicator so the user can adjust for any time frame or volatility. Select the minimum and maximum accepted limits from the % gain loss required for the pole, the maximum acceptable flag depth or rally and the minimum and maximum number of bars for each component.

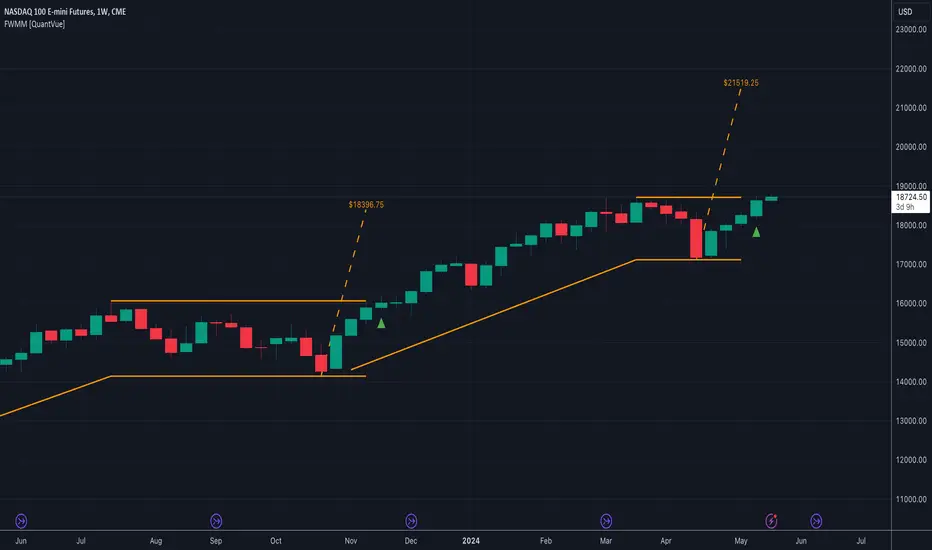
Flags With Measured Move [QuantVue]Flags with Measured Moves is a technical analysis tool that identifies bull flags and provides a measured move target.
A bull flag is a continuation pattern that occurs within the context of a general uptrend. It represents a pause or small consolidation before the price resumes its upward movement.
A bull flag consists of two sections: the flagpole and the flag.
The flagpole is the initial upward movement that occurs before the flag forms.
The flag forms as the price consolidates after the initial uptrend. During this phase, the price tends to drift downward or sideways, ideally with declining volume.
Once the flag has put in a low, the initial range of thrust is added to the flag low to form the measured move target.
Every element of the flag is customizable by the trader, including the size and length of the prior uptrend and the minimum and maximum flag depth and length.
The indicator also includes alerts for when new flags are formed, when a breakout from the flag occurs, and when the measured move target is reached.
By default, the indicator settings are set for use on a daily timeframe. If using the indicator on an intraday timeframe, you will need to adjust the settings.
Give this indicator a BOOST and COMMENT your thoughts!
We hope you enjoy.
Cheers!
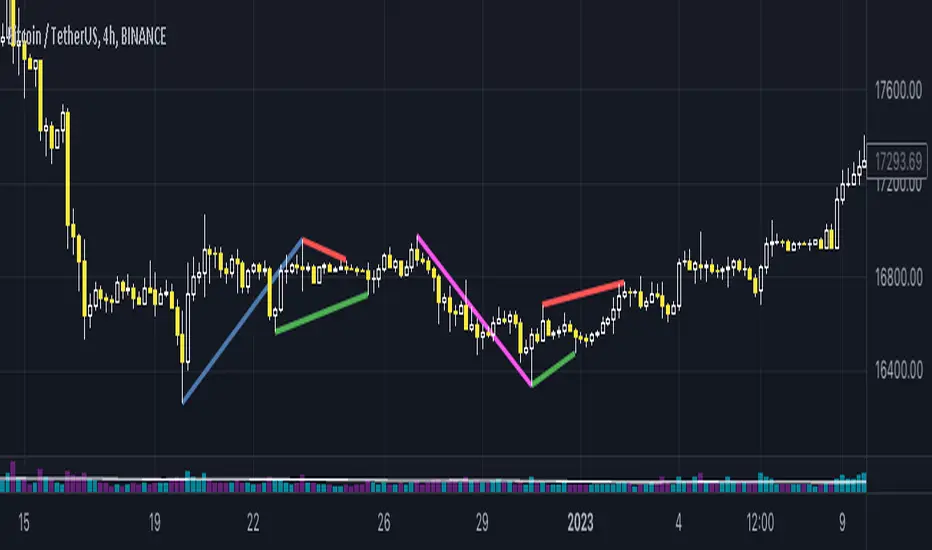
wedges and flagsThis script identifies chart patterns: wedges, flags, triangles on the chart
It has many settings. You can choose by which extremums you want to identify patterns - by the edges of wicks (tails, shadows), or by the edges of candle bodies .
You can also adjust the accuracy - how smooth and accurate the shapes must be in order for them to be considered wedges or triangles.
You can also customize other parameters of the figure, for example, how long the flagpole should be in order to consider such a figure a wedge, a flag or a triangle.
You can also set how large the allowable spread of candles relative to the flagpole can be.
The Sensitivity parameter - will allow you to control the number of patterns detected depending on whether you want the patterns to be detected more often, or if they cover more candles and thus be more reliable
You can also customize your styles.
All key settings are accompanied by tooltips
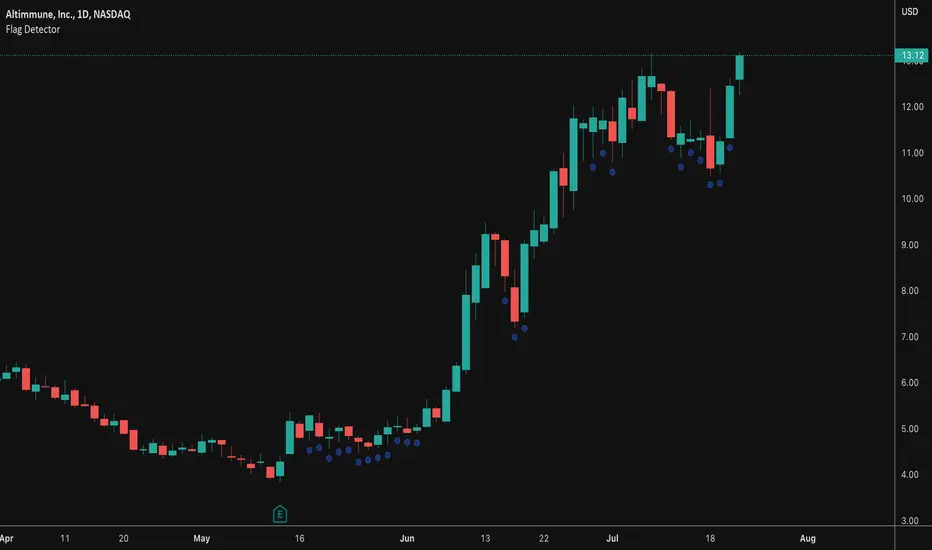
Flag DetectorThis script attempts to find consolidations or retracements within the context of a previous uptrend - basically looking for flag type patterns. It first measures an initial move (referred to as the flag pole in this script) and then looks for consolidation after that move within a certain range. If the consolidation is within the rage, it plots a dot under the candle to show you the consolidation areas. It's not fool proof, but seems to do a decent job of identifying pullbacks and sideways consolidations reasonably well.
TwP: Indian FlagWishing all Indians a Happy Independence Day .
With this script, you can plot the Indian Flag on your chart.
You can place the Flag on any corner, resize it and also add a text under it.
Feel free to use.
Jai Hind!

Rockstar Long Take profit flagFlag to indicate a good time to consider taking profit if you are in a long position.
The indicator will show a green diamond in an uptrend where the price is overbought and could pull back.
Conditions for flag:
Price above 20MA
20MA above 50MA
50MA above 200MA
RSI > 70
Close price is far from 20MA (about to pull back and overbought)
All inputs configurable in the settings for the indicator.
Please do not trade based on indicators alone. Use your strategy and be careful!

How To Limit n Round Trips Per Day [Alerts]Example how to limit the number of round trips per day. If entry condition is never met logic will force a round trip at end of day. Set chart to a timeframe that is lower than 1 Day period.
NOTICE: This is an example script and not meant to be used as an actual strategy. By using this script or any portion thereof, you acknowledge that you have read and understood that this is for research purposes only and I am not responsible for any financial losses you may incur by using this script!

Flagging BandsIntroduction
A pun between the word flag and the adjective flagging (less dynamic) , this indicator have two bands who react faster when in contact to the price. Imagine you are under sheets, if you abruptly rise, the sheets will instantaneously go up, then if you abruptly get down, the sheets will fall slowly until being in contact with a surface, this is because of a type of friction called drag or air resistance , this force is described in fluid dynamics and i inspired myself from that for the creation of the indicator.
The indicator
The indicator is made of two bands, one upper band and one lower band, then a weighted average of each bands, this average is weighted depending on which band the price is closer. The length control the period of the indicator, in general higher lengths will create wider bands, you must consider that this parameter behave differently than other ones and may create slower results in comparison with other bands indicators while having the same length period.
The indicator can use a simple breakout methodology (see trailing stop part) but can sometime provide support and resistance points, in fact i believe that when the average variability/volatility of band A is higher than the average variability/volatility of band B and that the price cross band B then price will reverse its direction, this claim is not justified, research is needed.
Trailing Stop Mod
It is possible to make the indicator act as a trailing stop, in order to do so just tick the trailing stop mod box.
The average/bands will automatically disappear being replaced by the trailing stop.
Conclusion
I was just playing around when making the skeleton of the indicator, i hope the code is easy to understand, if you need some kind of explanation just pm me, i'm always open to help people/receive suggestions.
Best Regards

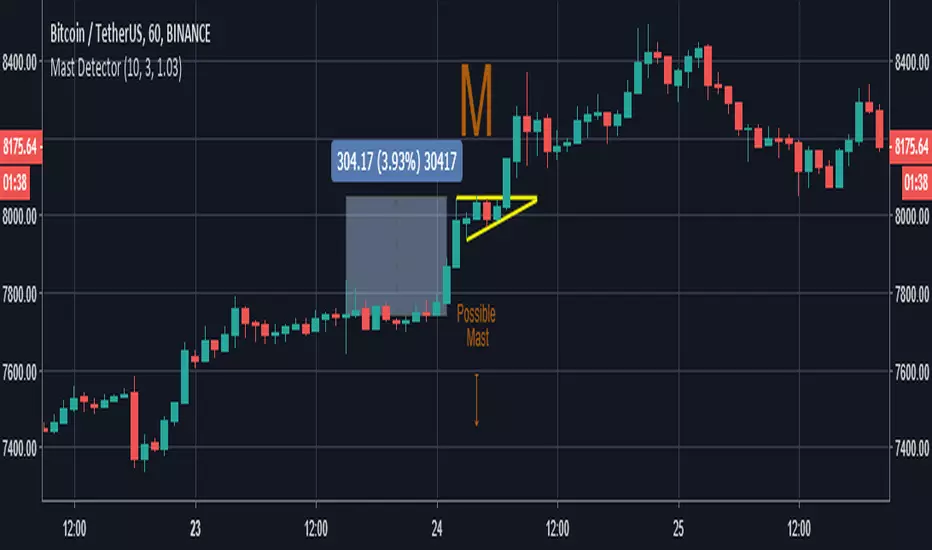
Mast DetectorThis indicator is a flag mast detector.
Works with cryptocurrencies, Forex and stocks.
Marks with "M" the possible mast.
Inputs:
CandlesToAnalyze: Quantity of Candles to Analize.
MinMastCandles: Minimum quantity of green candles of the mast.
MinPercentageMast: minimum percentage of mast gain.