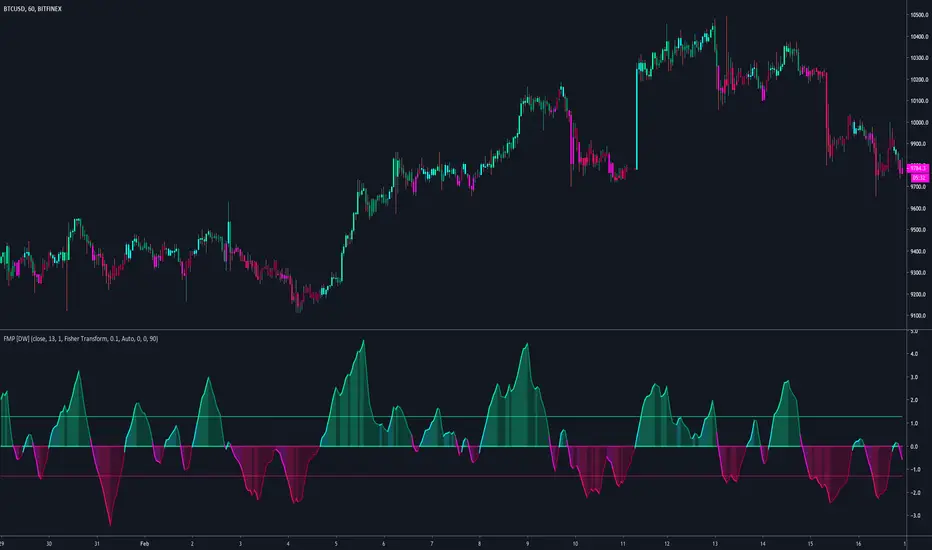
Inverse Fisher Z-Score Introduction
The inverse fisher transform or hyperbolic tangent function is a type os sigmoid function (sometime called squashing function) , those types of functions can rescale a result in a certain range and are widely used in artificial intelligence. More in depth the fisher transform can make the correlation coefficient of a time series normally distributed, in practice if you apply the fisher transform to the correlation coefficient between a time series and a linear function you will end up with an estimate of the z-score of the time series. The inverse transform however can do the contrary, it can take the z-score and transform it into a rough estimate of the correlation coefficient, if your z-score is not smooth then you will have a non-smooth estimate of the correlation coefficient, that's quite nice no ?
The Indicator
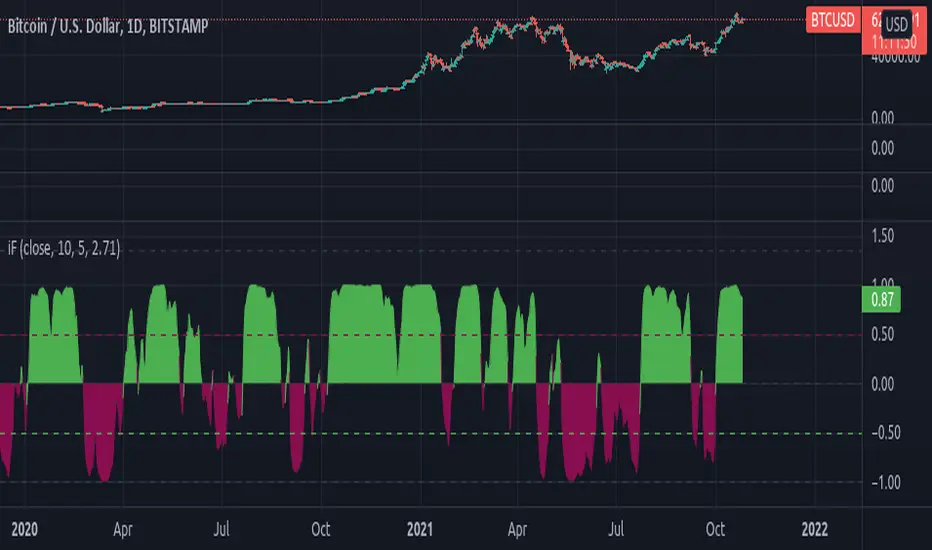
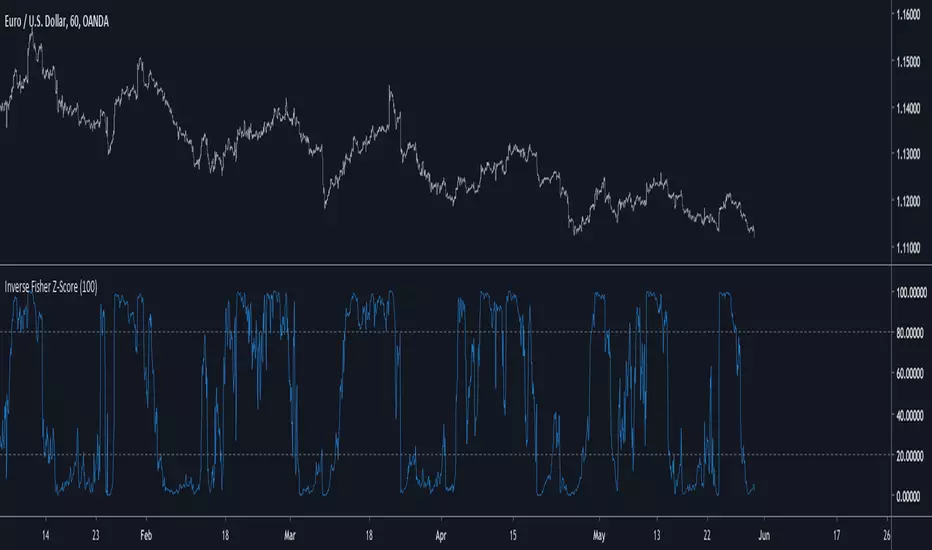
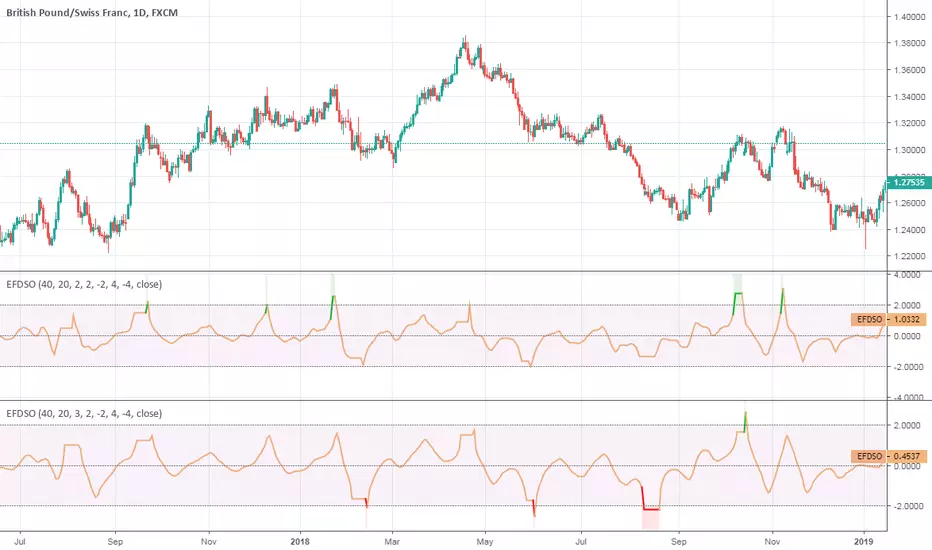
The inverse fisher transform of the z-score will produce results in a range of 1/-1, here however i will rescale in a range of 100/0 because its a standard range for oscillators in technical analysis. Values over 80 indicate an overbought market, under 20 an oversold market. The smooth option in the indicator settings will make the indicator use a linearly weighted moving average as input thus resulting in a smoother result.
The indicator with smooth option.
Conclusion
I presented a new oscillator indicator who use the inverse fisher transform of a z-score. Using the fisher transform and its inverse can give a new shape to your indicator, make sure to control the scale of your indicator before applying the fisher transform, the inverse transform should be applied to values in range of 1/-1 but you can use higher limits (2/-2,3/-3...) , however remember that higher limits will approximate an heavy side step function (square shape) . I hope you will find an use to this indicator.
Thanks for reading !
Fisher
Triple Fisher Transform — SharkCIA3x Fisher Transform used for high accuracy trend analysis.
🐟 Fisher has been my go-to indicator for establishing bias and provides a reliable second opinion for your trade setups. It also helps to identify overbought and oversold levels. If you use it properly, you will be fishing for profits. 🤑
One of the main advantages of fisher transform is that it works well on any timeframe.
I use it most often on 4h or daily timeframes, but it works on 1 minute as well.
Increasing from a pivot low is a long signal. Decreasing from a pivot high is a short signal.
The Fisher Transform is a technical indicator created by J.F. Ehlers that converts prices into a Gaussian normal distribution. In this way, the indicator highlights when prices have moved to an extreme, based on recent prices. This may help in spotting turning points in the price of an asset.

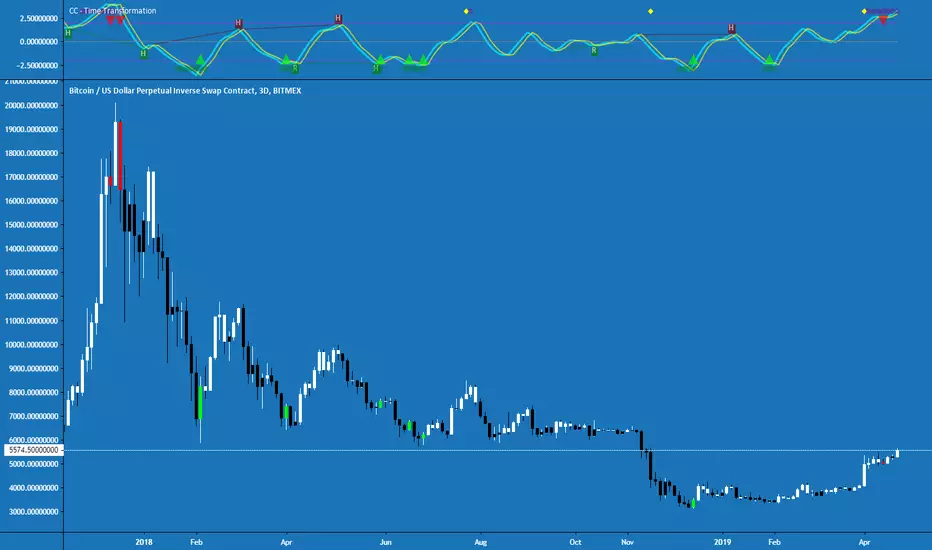
Cracking Cryptocurrency - Time TransformationTime Transformation is the creation of the Cracking Cryptocurrency Premium Trading Group . It's purpose is to provide volume , momentum, trend, and divergence at a glance. This limits the restrictions of a trader dramatically, by providing them with a powerful tool applicable on any asset, any time frame.
Momentum:
Time Transformation accurately interprets precise entry and exit positions in a ranging market via overbought and oversold conditions. When an asset is trending, these levels also indicate short-term exhaustion, and ideal profit taking levels.
These levels are completely customization, by adjusting the Cycle Length, and the boundaries of overbought and oversold itself. Also, with an advanced algorithm that calculates advanced price action, you can adjust this measurement for optimum results. One can even look at the momentum on a different time frame.
Trend:
Utilizing the power of Heikin Ashi to identify the dominant trend, this allows a trader to filter out the noise of Japanese candlesticks while still looking at their more accurate OHLC price information. Bars are colored pursuant to the dominant Heikin Ashi trend. One can also look at the Heikin Ashi trend of a higher or lower time frame to adjust the noise filtration.
Volume:
All traders know that we need volume for profitable movements. This indicator succinctly points out periods of unnatural volume , alerting a trader that a potential reversal or breakout may be occurring.
Divergence:
This Indicator understands fractal patterns of price action and oscillator movement. This allows for both Regular and Hidden divergence to be detected and displayed on the screen in real-time. One of the most powerful features of this indicator.
This Indicator boasts Multi-Time Frame features for both it's Momentum Oscillator and Trend Pattern Function, as well as fully adjustable settings for every function. Alerts are coded for every possible occurrence a trader could want.
Begin your journey towards market domination today. Allow this Indicator to Transform your Trading as it Transforms Time.
For access to this and all other Cracking Cryptocurrency Proprietary Indicators and Strategies, visit Cracking Cryptocurrency Premium Trading Group
Update Log:
-Adjusted default aesthetics to make Signal and Trigger Line more visible on a variety of backgrounds.
-Adjusted default aesthetics of zero line, overbought, oversold.
-Updated entire script to Pine Script Version 3.
-Updated Heikin Ashi Bar Recoloring Script - Will not re-paint, monitors the open and closing price and switches colors faster.
-Updated Input Setings for Multi-Time Frame feature. Much easier and more intuitive to select Time Frames from the drop-down menu.
-Simplified Input Settings, making them more intuitive.
-Updated Alert Messages to ease language barrier difficulties.
By Request: Added Alert Function for regular crosses.
Upcross = Fisher Crossing Over Signal Line.
Downcross = Fisher Crossing Under Signal Line.
Note that these are not buy/sell signals as per the Time Transformation strategy, as those crosses must occur in either overbought or oversold territory. :)
Cuban's MTF FisherA multi-timeframe Fisher indicator that has been updated to Pine version 3, added linear regression and RMA lines with up down colour coding, alert conditions for ease and autoview automatic trading, and a few other little tricks.
This indicator will no longer repaint and will provide more accurate signals. I've also added a backtester to allow you to find something that works for you. Just search 'Cuban's MTF Fisher Backtester'.
If you would like any features added, DM me on Tradingview or Twitter.

Fisher Stochastic Center of GravityWhat happens when you take the Fisher Transform of a Stochastic Oscillator?
Well, you filter out all the stuff you don't want and are left with super-precise entries!
This indicator works especially well in with a trend-follower in a higher timeframe - iTrend, MAMA, Hull, etc...
How to trade:
Use with another indicator to tell you the current trend.
Take buy and sell signals as you would with the Stoch.
-DasanC

Fisher Transform Multi-TimeframePlots the multi-timeframe version of the fisher transform. When the desired interval is less than the chart interval, the intermediate values of the transform will be displayed.

TB! Fibonacci Elliot Wave OscillatorOnly one way to do it the right way!
With forwarded wave propagation.

Recursive Median Oscillator & Fisher Transforms RibbonThis is a composite indicator made up of:
- modifided (rescaled) version of evergets version of recursive median oscillator.
- 1996anoojpatels Futur modification of Ehlers Fisher Transform Ribbons Indicator
I think Ehlers attempts to minimise latency in indicators are extremely valuable and some of my most use trading tools. Thanks to all the authors whose iterations keep moving these indicators toward perfection. Here is my contribution.

Missile RSI (RSI of momentum w/ Dominant Cycle length + Fisher)This is a predictive indicator that looks for explosions in momentum of the cycles in price and large shifts in Momentum (Fisher turns the Bimodal PDF into Guassian like) as statistically unlikely events, showing points to exit or reverse positions.
You can adjust the lowpass frequency cuttoff (Aka what cycles you want to remove from the calculations through the super smoother filter).
To be honest you can monkey trade the direction of the Signal if you'd like but the Divergences and Maxing of the values is whats most useful.
Let me know if you guys want me to add anything else.

Ehlers Fisherized Deviation-Scaled OscillatorEhlers Fisherized Deviation-Scaled Oscillator script.
This indicator was originally developed by John F. Ehlers (Stocks & Commodities V. 36:11: Probability - Probably A Good Thing To Know).
Twiggs Money Flow Fisher Transform// Credits to @LazyBear
// This is an experimental indicator (Originaly coded by Lazybear) modified by @haidinurhasfi by applying the Fisher Transform to Twiggs Money Flow.
// Tune the length according to your trading style and instrument
Volume_Master_420Volume is a key component to moniter for trading; this indicator has volume and many other key indicators built in
The Aqua and Fuchsia bg colors are multi fisher confluence signals. Aqua ==> long bias; Fuchsia ==> short bias
The blue and red bg colors are when certain 'bar shapes' of volume print with confidence scores (usually good bars to add on a trend)
The white circles are when volume is making highs or lows of 52 periods back
The blue dots below are the 'atlas' signal showing when BBands are shrinking in a statistically significant way ==> large moves incoming
The volume itself is based on trend volume accumulation by just uncle L;
I have added alerts for when the tva flips from - to + (long alert) and the opposite + to - (short alert)
GL HF
xoxo
Snoop


Zero Lag Volume Price Confirmation IndicatorImplementation of Volume Price Confirmation Indicator with an added Zero Lag VPCI inspired by ZLEMA from Ehlers. It also supports a Fisher mode that can show interesting signals.
Based on docs.mta.org
Addendum (from the author):
"At the time, I believed a falling trend and falling VPCI was bearish, it is in fact a bullish indication."
"I also may have stated a falling trend and a rising VPCI was bullish, however it is a bearish indication."
More reading material:
cmtassociation.org
www.scribd.com
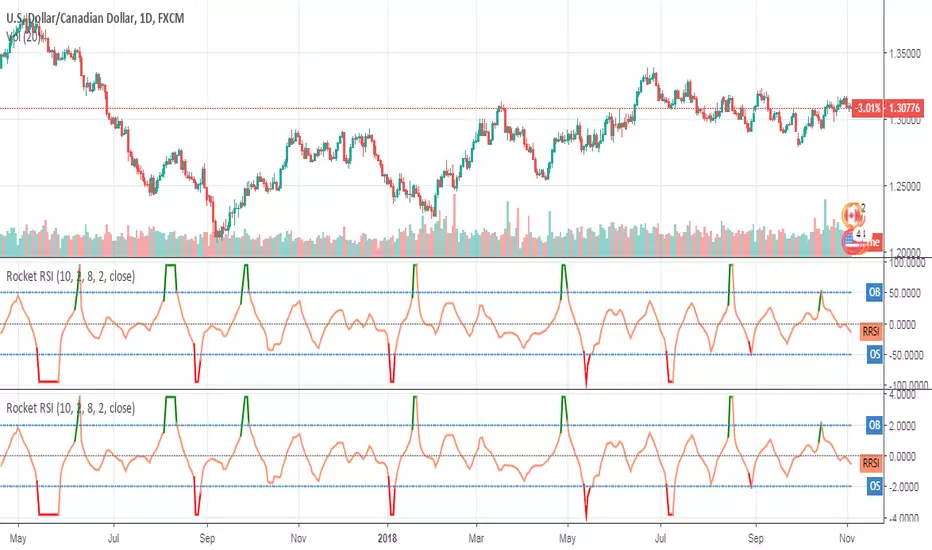
Rocket RSIRocket RSI indicator script.
This indicator was originally developed by John Ehlers (Stocks & Commodities V.36:6, RocketRSI - A Solid Propellant For Your Rocket Science Trading).
Fisher Multi-Pack [DW]This is an experimental study designed to visualize price activity using John Ehlers Fisher Transform and Inverse Fisher Transform methods.
The Ehlers Fisher Transform is a variation of R. A. Fisher's Z transformation.
In this study, there are five oscillator types to choose from:
-Fisher Transform Indicator - A conversion of price's probability distribution to a Gaussian normal distribution with a smoother output
-Inverse Fisher Relative Strength Index - Converts the RSI's distribution to a bounded distribution between 1 and -1 with a smoother output
-Inverse Fisher Stochastic Oscillator - Converts the Stochastic's distribution to a bounded distribution between 1 and -1 with a smoother output
-Inverse Fisher Commodity Channel Index - Converts the CCI's distribution to a bounded distribution between 1 and -1 with a smoother output
-Inverse Fisher Blast Off Momentum - Converts the BOM's distribution to a bounded distribution between 1 and -1 with a smoother output
The study uses a modified set of Bollinger Bands applied to the chosen oscillator to determine trend and impulse activity, which are highlighted by the color scheme.
Custom bar colors are included.
Fisher Transform Ribbons Indicator V1.0Utilizing the Fisher Transform by Ehlers with different lengths based on multipliers will allow you to notice movements in price and understand whether the shift was a correctional wave, or part of the overall trend.
To learn about Fisher Transform , check out the Fisher Transform documentation: www.mesasoftware.com
Fisher has plenty of functionalities. Ribbons provides you with a view of consistency in price action. If all ribbons flip, generally this is a strong signal that the trend is changing. Fisher is extremely punctual (minimum input lag) and robust (doesn't miss movement). Look for everything, including divergences, trends, and Oversold, Overbought points.
Changing length will further provide you more sensitivity in overselling and buying, while numbing chop.
Enjoy!
And for a single Fisher, check out HPotter's Fisher Transform or LazyBear's implementation of the inverse of the Fisher, which has many other interesting properties

N Day Pivot Moving Avg (WONTON GRP)This is a tool used by Fisher style traders. It allows the trader to set the pivot period (3 Days is default) and the moving averages of that pivot.
Provided by the Wonton Group.

Inverse Fisher Transform on RSIAbout John EHLERS:
From California, USA, John is a veteran trader. With 35 years trading experience he has seen it all. John has an engineering background that led to his technical approach to trading ignoring fundamental analysis (with one important exception).
John strongly believes in cycles. He’d rather exit a trade when the cycle ends or a new one starts. He uses the MESA principle to make predictions about cycles in the market and trades one hundred percent automatically.
In the show John reveals:
• What is more appropriate than trading individual stocks
• The one thing he relies upon in his approach to the market
• The detail surrounding his unique trading style
• What important thing underpins the market and gives every trader an edge
About INVERSE FISHER TRANSFORM:
The purpose of technical indicators is to help with your timing decisions to buy or
sell. Hopefully, the signals are clear and unequivocal. However, more often than
not your decision to pull the trigger is accompanied by crossing your fingers.
Even if you have placed only a few trades you know the drill.
In this article I will show you a way to make your oscillator-type indicators make
clear black-or-white indication of the time to buy or sell. I will do this by using the
Inverse Fisher Transform to alter the Probability Distribution Function (PDF) of
your indicators. In the past12 I have noted that the PDF of price and indicators do
not have a Gaussian, or Normal, probability distribution. A Gaussian PDF is the
familiar bell-shaped curve where the long “tails” mean that wide deviations from
the mean occur with relatively low probability. The Fisher Transform can be
applied to almost any normalized data set to make the resulting PDF nearly
Gaussian, with the result that the turning points are sharply peaked and easy to
identify. The Fisher Transform is defined by the equation
1)
Whereas the Fisher Transform is expansive, the Inverse Fisher Transform is
compressive. The Inverse Fisher Transform is found by solving equation 1 for x
in terms of y. The Inverse Fisher Transform is:
2)
The transfer response of the Inverse Fisher Transform is shown in Figure 1. If
the input falls between –0.5 and +0.5, the output is nearly the same as the input.
For larger absolute values (say, larger than 2), the output is compressed to be no
larger than unity. The result of using the Inverse Fisher Transform is that the
output has a very high probability of being either +1 or –1. This bipolar
probability distribution makes the Inverse Fisher Transform ideal for generating
an indicator that provides clear buy and sell signals.
Multi Fisher Transform + AlertBased on 3 Fisher transforms -- this script look for confluence on crosses of 0
this is alert enabled; make sure to use 'once per bar on close'
hope it helps
xoxo
--sn00p
Fisher Transform with Up/Down colours - squattter - V2Colours change faster now using the white line as reference rather than the bars.

[RS]RSI Inverse Fisher Transform V1RSI inverse fisher transform (fishy turbo) as described here:
autotradingstrategy.wordpress.com
forexsb.com
update:
added color conditional.