First X Days Of A YearFirst X-Day Indicator
Overview
The "First X-Day Indicator" is a powerful tool to visualize and analyze market sentiment during the crucial first trading days of each new year. It provides immediate visual feedback on whether the year is starting with positive or negative momentum compared to the previous year's close, a concept often related to market theories like the "January Effect" or the "First Five Days Rule."
The indicator is designed to be clean, intuitive, and fully customizable to fit your charting style.
Key Features
Yearly Baseline: Automatically draws a horizontal line at the previous year's closing price. This line serves as a clear 0% reference for the current year's performance.
Dynamic Background Coloring: For a user-defined number of days at the start of the year, the chart background is colored daily. Green indicates the close is above the previous year's close, while red indicates it's below.
Final Performance Symbol: At the end of the analysis period (e.g., on the 5th day), a single summary symbol (like 👍 or 👎) appears. This symbol represents the final performance outcome of the initial trading period.
Settings & Customization
You have full control over all visual elements:
Analysis Period: Define exactly how many days at the start of the year you want to analyze (e.g., 3, 5, or 10 days).
Line Customization: Fully control the yearly baseline's appearance. You can change its color, width, and style (Solid, Dashed, or Dotted) or hide it completely.
Symbol Customization: Choose any character or emoji for the positive and negative performance symbols. You can also adjust their size (Small, Normal, Large) or hide them.
Background Control: Enable or disable the daily background coloring and select your preferred custom colors for positive and negative days.
First

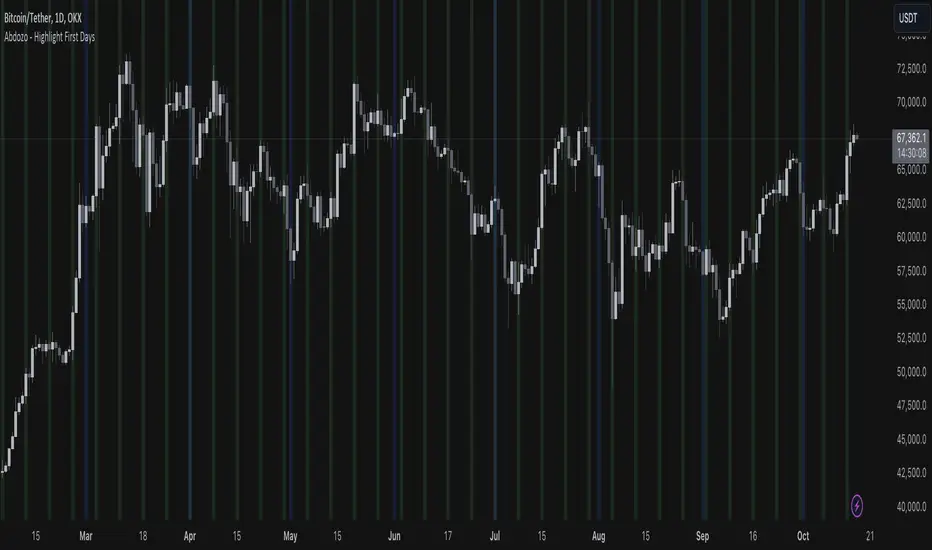
Abdozo - Highlight First DaysAbdozo - Highlight First Days Indicator
This Pine Script indicator helps traders easily identify key timeframes by highlighting the first trading day of the week and the first day of the month. It provides visual markers directly on your chart, helping you stay aware of potential market trends and turning points.
Features:
- Highlight First Day of the Week (Monday): Automatically marks Mondays to help you track weekly market cycles.
- Highlight First Day of the Month: Spot the start of each month with ease to analyze monthly performance and trends.
Soren test 222Say we use strategy.risk.allow_entry_in() to only trade longs. When our script uses the strategy.entry() function to open a short trade, TradingView of course won’t allow our strategy to go short. But that doesn’t mean the trade is ignored. Instead the ‘enter short’ trade – which is actually a sell command – becomes an ‘exit long’ order.
Another way to think about this is the following. The strategy.entry() function can reverse positions: longs into shorts, and shorts into longs. That reverse behaviour gets stopped by strategy.risk.allow_entry_in(). What strategy.entry() instead ends doing is close positions: from long to flat, or from short to flat.
(The example strategies that we discuss later in this article show how strategy.risk.allow_entry_in() makes strategy.entry() close instead of open trades.)
# Can still trade both long or short
strategy.risk.allow_entry_in() can also allow our strategy to trade both long or short. That’s a bit silly, since this is already the default behaviour. But to cod
