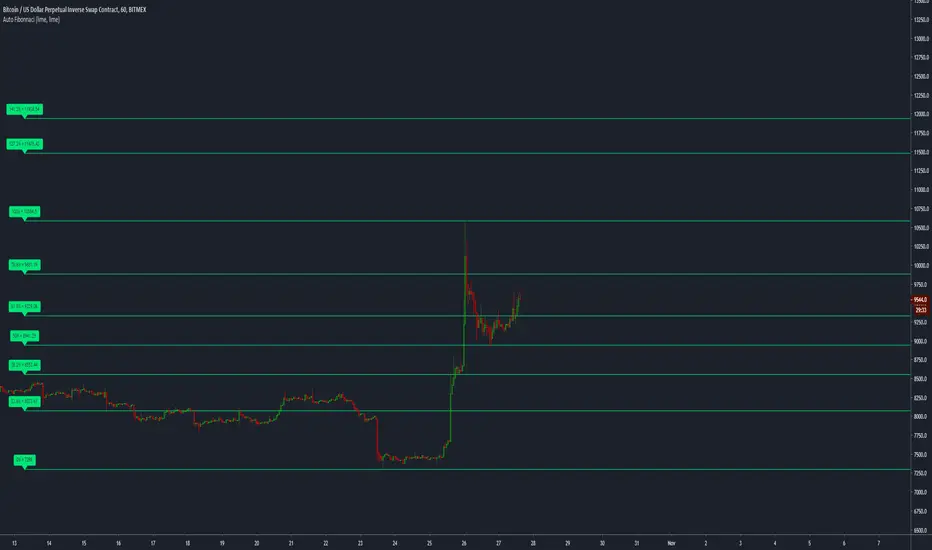
Auto Fibonacci Extension and Retracement with Visual AlertsThis indicator automatically calculates and plots Fibonacci retracement and extension levels based on recent swing highs and lows, making it a powerful tool for traders who use Fibonacci analysis in their strategies.
Key Features:
• Dynamic Fibonacci Levels: Automatically detects swing highs and lows over a user-defined lookback period to calculate key Fibonacci retracement (e.g., 0.236, 0.382, 0.618, etc.) and extension (e.g., 1.618, 2.618, etc.) levels.
• Visual Alerts: Displays intuitive visual alerts when the price crosses important Fibonacci levels.
• Blue dashed lines for retracement levels.
• Green dashed lines for extension levels.
• Labels with up or down arrows indicating price interactions with these levels.
• Swing High/Low Visualization: Marks recent swing highs and lows with crosses for better clarity.
• Customizable: Adjust the lookback period and Fibonacci levels to suit your trading style.
Who is it for?
This indicator is perfect for:
• Swing Traders: To identify potential reversal or continuation zones.
• Day Traders: For short-term setups based on Fibonacci levels.
• Fibonacci Enthusiasts: To automate the time-consuming process of manually plotting levels.
Usage Ideas:
1. Use retracement levels (e.g., 0.618) to identify areas of potential support or resistance.
2. Use extension levels (e.g., 1.618) to target potential breakout or continuation zones.
3. Combine this indicator with candlestick patterns, volume analysis, or other tools for confirmation.
Limitations:
• This is a standalone indicator and does not provide buy/sell signals. It’s recommended to combine it with other technical analysis tools for best results.
• The lookback period and swing detection rely on past data, so adjustments may be needed based on the asset or timeframe.
Whether you’re looking to streamline your Fibonacci analysis or explore new opportunities in your trading, this indicator is designed to save time, increase accuracy, and enhance your overall trading experience.
Fibonnaci

[volfgang] WAVE ScannerThe Wave Scanner helps you make more informed decisions about when to buy and sell.
This indicator operates on a series of inputs and global variable declarations. Based on the same parameters as the WAVE Indicator. It uses different parameters such as the closing price, Stochastic Momentum Index, and smoothing factors such as the EMA to calculate the potential trade signals.
The scanner allows you to adjust the thresholds for bullish and bearish counts, which can be tailored to your personal trading strategy.
The minimum value is 4 and maximum is 8.
In total you can use 8 different timeframes for your signals from the following;
3D
1D
12h
8h
4h
1h
15m
5m
The scanner's unique ability to scan across multiple timeframes is what makes this indicator unique. This multi timeframe analysis can be incredibly useful for identifying broader trends in the market.
The Wave Scanner settings also includes inputs for you to enter risk management settings, including your total capital and the risk percentage you are willing to take per trade. It uses this information to display data in a label on the chart including;
Position Size
Stop Loss Level
Potential Profit
Risk Reward Ratio
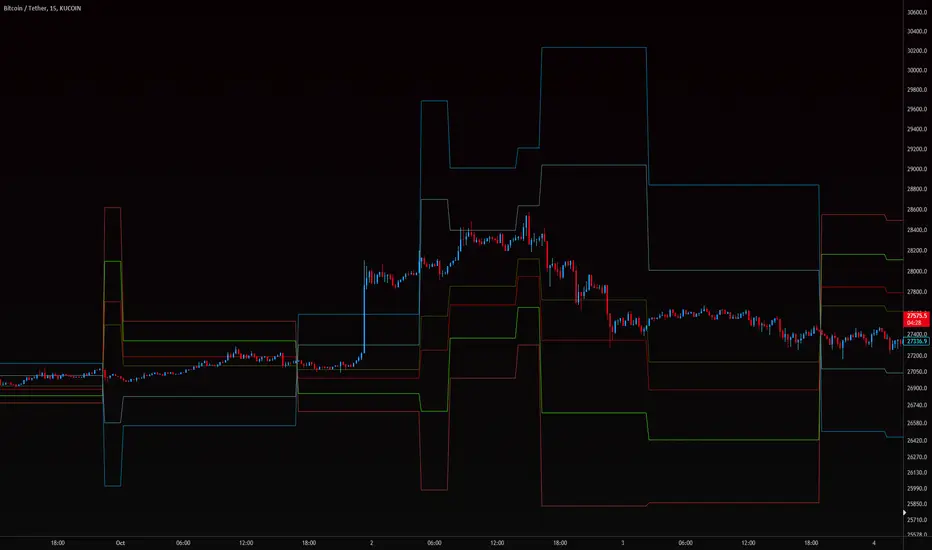
On your chart, the WAVE Scanner will plot the ideal Entry Levels, Stop Loss and Take Profit Levels by calculating Fibonacci Levels, which is a popular tool for identifying potential support and resistance levels.
These are marked as follows;
GREEN Lines: Entry Levels
PINK Line: Stop Loss (can be customized in the settings)
GREY Line: Breakeven Level (move SL to breakeven at this level)
BLUE Line: Take Profit Level
So, if you're a trader looking to level up your strategy, the Wave Scanner is a tool you won't want to miss out on.
3 Fib EMAs To Scalp Them AllThe "3 Fib EMAs To Scalp Them All" was made in order to clear up when we should look for shorts, longs, or walk away. Also it can alert you when a trend starts, or when there is a possible reversal. I use it for scalping/day trading in 5m-1h timeframes.
1. EMAs: By default, the indicator uses Fibonacci numbers (21, 55, 233), but you can change them.
2. Color Changes: The color of the Micro EMA line changes depending on its relation to the Mid and Macro EMAs.
When Micro EMA < Mid < Macro EMA, it turns red, indicating a potential bearish trend - that's when you should look for shorts
When Micro EMA > Mid > Macro EMA, it turns green, indicating a potential bullish trend - that's when you should look for longs
A white Micro EMA is when you need to take some rest, enjoy your coffee, and avoid overtrading.
3. Signals: The indicator provides visual signals in the form of diamonds and crosses and corresponding alert signals.
A red diamond above the bar signals a potential beginning of a downtrend
A red cross above the bar signals the end of the downtrend and can be used as a signal for a possible reversal up/breakout.
A green diamond below the bar signals a potential beginning of a downtrend,
A green cross below the bar signals the end of the uptrend and can be used as a signal for a possible reversal down/breakout.
4. Alerts: For algo traders and people who prefer to stay away from the monitor... there are alerts for every signal.
Friendly note: Don't blindly follow the signals for your long and short entries. The signals only pop up when the EMA cross value gets a confirmation. A smart move would be to wait for a retracement to the EMA line and use momentum indicators like market cipher B to pinpoint those ideal entry points.

Fib Percentage Previous Day CloseIntraday regulated markets move within their circuit range above or below which the market activity is halted.
These levels are protected by the MM to accumulate or distribute. These levels are mostly same for all markets i.e. 2%, 4% , 5%, 10% and 20% of previous day close, crossing which the market activity halts.
So, from here the expectation of turning or breaking increases.
This indicator automatically plots the levels and helps understanding the price behavior at these points. This in turn helps taking better RR trades.

MRP_DAILY_LEVELIntraday Indicator: #MRP_DAILY_LEVEL
This indicator plots support and resistance levels based on fibonnaci levels.
1. Understanding The Levels:
Intermediate Zone is two brown coloured lines.
Resistance is two red coloured lines.
Support is two green coloured lines.
Buy target and Sell Target are white coloured lines on both sides.
-Price is strong when it is above the Intermediate Zone.
-Price is weak when it is below the Intermediate Zone.
-Price remains range bound when it stays inside the Intermediate Zone.
-Price is very strong when it's above Resistance Zone
-Price is very weak when it's below Support Zone
-Buy Target & Sell Target are the zones where you should take or trail your profit.
2.For Buying/Selling:
-Buy only when 15min close above Resistance Zone. SL below Resistance Zone.
-If 15min close is in huge range, you can buy/sell after pullback to Resistance/Support Zone.
-Also you can buy/sell if 15min close is above/below Buy/Sell target zone if you missed the rally.
-Sell only when the 15min close below Support Zone. SL above Support Zone.

Bullback LLCAutomatically apply Fibonnaci levels from the monthly h4 m30. This script includes resistance bands and support bands which are located at the low and high of the fibonnaci. When price is at resistance we sell and tp is the pivot and when its at support we buy and TP is the pivot. We dont trade inside the dead zone (pivot) which is between the .50 and 0.618. We sell if price is below this zone and buy when it is above and tp is support ( sell) and resistance ( buy ). If you would like more information about how this work please message me I will get in the details.
Please PM if you would like access to this script. More updates coming soon. Enjoy

MA * Fibo levels (auto)A few updates to the previous post.
In order to catch more exact points of TP and SL, the scrypt takes "high" as the source of SMA if the percentage is greater than 0 ( > 0), and "low" as the source when the given percentage is less than 0 ( < 0).
So there are two basic SMA line ( one with "high", the other one with "low"), and the other lines would be results of multiplying either the higher base or the lower one.
Good luck in trading!
If the scrypt was useful let me know!
Any feedbacks and ideas are welcomed!