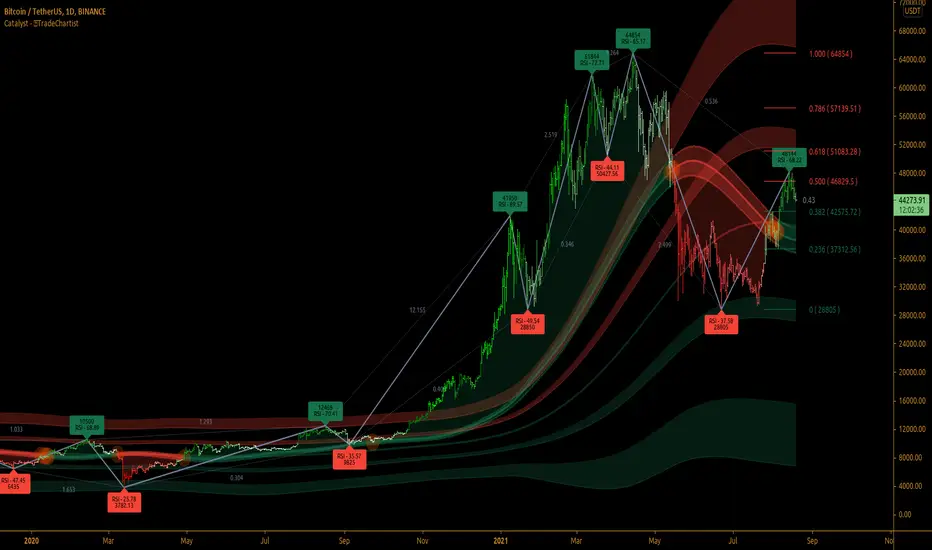
TradeChartist Catalyst™TradeChartist Catalyst is an elegant script that combines Catalyst Trade Bands and automatic ZigZag/Fibonacci plots using an original logic to help users interact in a visually engaging and meaningful way with the charts.
===================================================================================================================
™TradeChartist Catalyst features
=============================
1. Catalyst Trade Bands
Catalyst Trade Bands comprises Equilibrium or Mean Bands, Inner Bands, Outer Bands and a Overall Mean Line. Catalyst Trade Bands help visualize the price action in relation to the Equilibrium Bands and clearly show how far away from the mean the current price is. The Trade Bands are of two types - Normal and Weighted. Weighted Bands are very sensitive to price action and a higher Bands length is recommended.
Simple 144 vs Weighted 144 Trade Bands
2. Equilibrium Touch Points
Every time the price touches the Equilibrium, an orange touch point appears on the chart. Normally, the Equilibrium line, for an optimal sample, acts as support or resistance. Price breaching or failing this line usually signals a Pull Back, a Throw Back or a Trend Change based on how the price interacts with it. This can be used with a secondary confirmation like RSI, Stochastic etc. For example, if the price falls back significantly only to touch the Equilibrium Line and fails to test the Overall Mean Line when Stochastic is below 30, this could mean a strong Pull Back rather than a Trend Change as shown in the example chart below.
When price fails the Equilibrium Bands, the fill colour of the Equilibrium bands changes to Bearish colour. If the Overall Mean line is below the Equilibrium bands and is in a reasonable distance, Mean will act as support as shown in the example below. Price failing the mean will test Inner Bands and strong bear momentum could take price to Outer Bands and beyond.
All the components of the Catalyst Trade Bands including the Touch Points can be enabled or disabled from the settings.
3. ZigZag & Fibonacci
Catalyst automatically plots ZigZag and Auto Fibonacci Retracement based on an intelligent logic and can be tweaked by changing the Zigzag & Auto-Fibs Factor from the settings. It also plots Fib ratios and connectors along with price highs and lows of ZigZag. The ratios can be especially useful to visually detect harmonic patterns and also serves as a useful feature for Fibonacci traders.
4. Fibonacci Customisation
Catalyst users can customise Fibonacci type and levels, including levels colour from Catalyst settings. In addition to Auto-Fibs, users can also plot Fibonacci levels based on Days or Candles lookback. This is a very useful feature if the user wants to override Auto-Fibs to suit his/her needs. Users can also reverse the Fibonacci Levels by enabling Reverse from settings.
In the following example chart of OANDA:USDCAD , Fibonacci levels based on 10 days lookback is plotted.
===================================================================================================================
Best Practice: Test with different settings first using Paper Trades before trading with real money
===================================================================================================================
Fibonacci
Support and ResistanceThis indicator shows three types of support and resistance lines: Horizontal, Parallel (using linear regression) and Fibonacci Retracement. Lines can be adjusted or turned on and off in settings. A great tool for setting up entries, exits and locating pivot points.

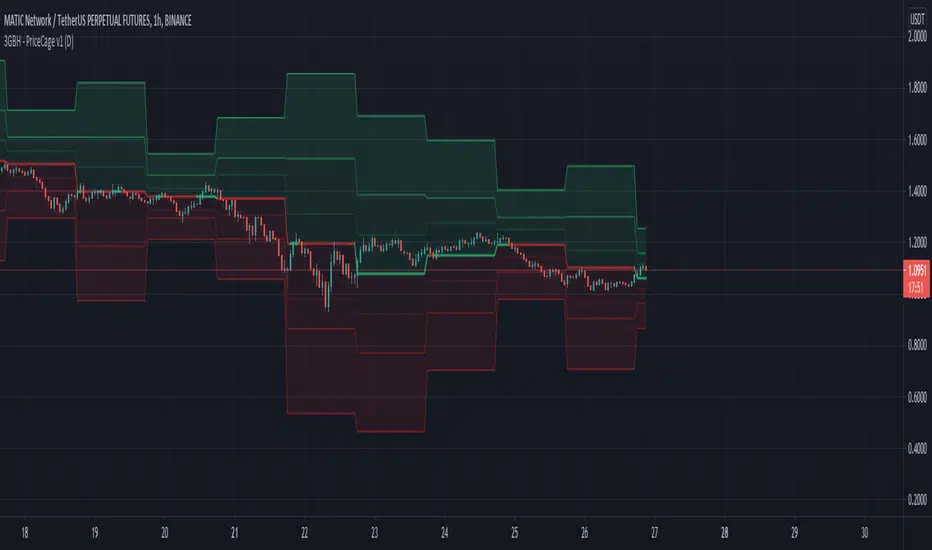
3GBH - Pivot Points & Fib LevelsThis indicator displays Pivot Points & Fib Levels based on the timeframe you select.
-----
There are 3-levels of support/resistance to the Pivot Points.
-----
Currently there are only Fib-Levels based on the 1st Pivot Levels .
Fibs will be added to the other 2 levels in the near future.
The Golden Ratio is highlighted by default.
-----
The Pivot Line is either green or red depending on whether the price is above or below.
-----
Fibonacci tools are quickly becoming a favorite of mine. This helps me to practice working with them,
and may help to be more efficient in doing analysis.
Martyv Auto Fib Extension with Logarithmic SupportSimilar to the Auto Fib Retracement tool - I took the out-of-the-box functionality and added Logarithmic support, as well as nicer colors and easier management of levels. I'm... 90% sure I got the Fib calculations correct. If you see something, say something! Would love any suggestions for improvement.
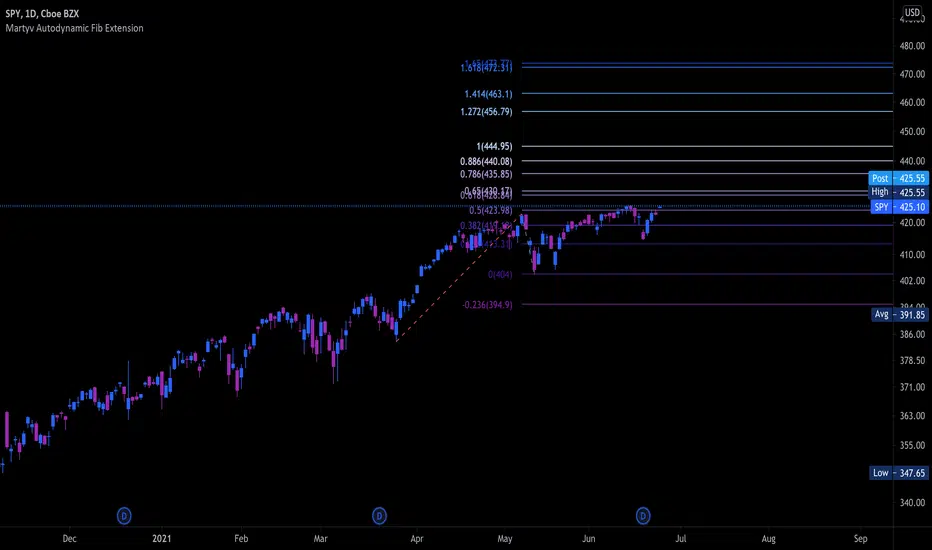
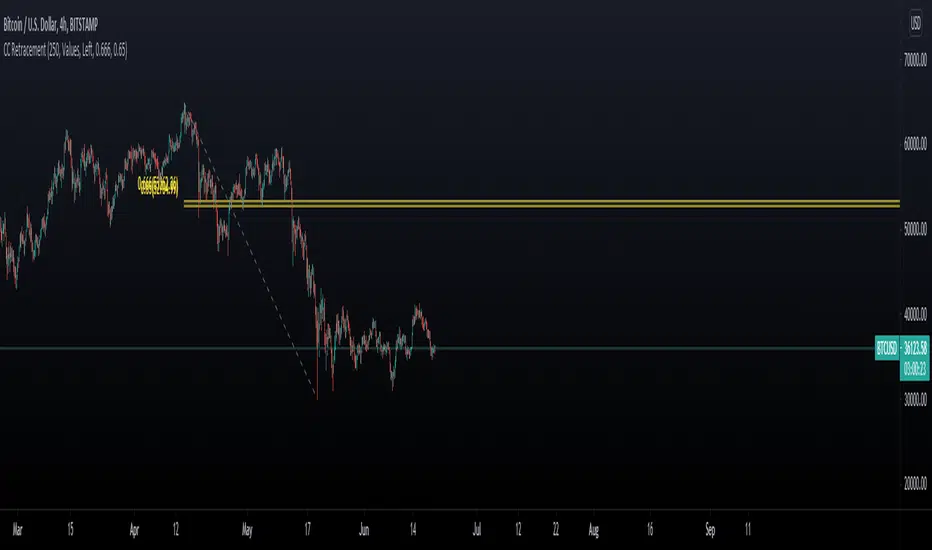
Chart Champions CC Pocket 0.65 -0.666 Fib levels or commonly know as the CC pocket
Marks Strong Support/Ressitance, Use with conflunce.
Lookback Length is adjustable
Let me know any suggestions or ideas which could help improve
[blackcat] L5 Zen MasterLevel: 5
Background
L5 Zen Master is my favorite main chart indicator. I have been studying Zen Theory for long and keeping improving related home-baked private indicators. Zen Theory is less known out side of China. This situation is very similar to when Nilson did not introduce Japanese candlesticks worldwide. At that time, traders in other parts of the world rarely heard of Japanese candlesticks. This situation occurs again. When most Chinese bookstores and libraries are full of books on Zen Theory trading techniques, the rest of the world may not know this trading technique based on mathematical derivation axioms.
As for the author of the theory, he/she is as mysterious as Satoshi Nakamoto who created Bitcoin. People don't even know his/her gender, because he/she likes to call himself/herself a "woman" when he/she publishes original trading techniques on his/her blog. No one knows his/her name, only his/her nickname: "Preaching Zen in Tangles" (缠中说禅). People respectfully call him/her "Zen Master" (缠师). Zen Theory is based on geometric structures like Bill Williams' Fractals and ZigZag, but it is very host to MTF applications. In addition, there are unique insights on moving averages, this moving average technology is called Zen Kiss (缠论吻).
Function
It combine several novel indicators together but mainly focus on Zen Theory(缠论主图), including Zen Strokes (自动画笔) 和 Zen Kiss (缠论均线) Moving Averages. To Better understand the market geometry structure, I developped featured Fibonacci Space Indicator which is based on Semi-LOG and Fibonacci Time Window Indicator to help juge trend movements independently. Also, I integrated Better Volume Indicator(BVI) and Range Action Verification Index (RAVI) as well for volume and bias monitoring.
Indicator Set
Zen Stroke (Auto ZigZag, 自动画缠论笔)
Zen Kiss Moving Averages (缠论均线)
Fibonacci Space Indicator with Golden Ratios based on Semi-LOG (黄崇半对数)
Fibnacci Time Window Indicator with red/green background colors
Dynamic Fibnacci Space Arrows to indicate support and resistance immediately
Better Volume Indicator (BVI) with painted bars to juge trend strength
Range Action Verfication Index (RAVI) for large time frame for exetreme conditions warning
Inputs
BVI lookback period --> 5 as default
EnableBVIBarColors --> True as default
Show Zen Stroke --> True as default
Show Fib Space based on Semi-LOG --> True as default
Zen Fractals Lookback Period --> 377 as default
Key Signal
Zen Stroke
Yellow line section for up stroke
Blue line section for down stroke
Zen Kiss MA
Yellow MA for fast line (Cowgirl line)
Fuchsia MA for slow line (Cowboy line)
Fib Space w/ Golden Ratios
Low, 11.4%, 23.6%, 38.2%, 50%, 61.8%, 78.6%, 88.6%, High
Fib Time Window
Green background color for top indicator based on time window
Red background color for bottom indicator based on time window
Dynamic Fib Space Arrows
Green arrows for support
Red arrows for resistance
Better Volume Indicator
Yellow bar color --> low volume --> trend ends, commonly before trend reversals
Red bar color --> climax up volume --> very bullish and next bar may continue to be bullish
White bar color --> climax down volume --> very bearish and next bar may continue to be bearish
Green bar color --> churn volume --> Long and short forces play fierce games within a small price range
Fuchisia bar color --> climax churn volume --> Long and short forces play fierce games within a large price range
Range Action Verfication Index
Yellow background color for extremely negative bias, indicating bottom zone
Fuchsia background color for extremely positive bias, indiacting top zone
Pros and Cons
ONLY suitable for discretionary trading, and does NOT support automatic trading system/bots with alerts.
Intuitive and effective, the output signal is more reliable after multi-indicator resonance
Remarks
My second L5 indicator published
Closed-source
Invite-only
Redeem Fee Life Lock Guarantee
Although I take the efforts to inform the script requesters that the best way to promote trading skills is to learn from the open source scripts I released by themself and to improve their PNIE script programming skills, there are still many people asking how to obtain or pay to use BLACKCAT L4/L5 private scripts. In fact, I do not encourage people to use Tradingview Coins ( TVC ) / Cryptocurrency to redeem the right to use BLACKCAT L4/L5 scripts. However, redeeming private script usage rights through TV Coins/ Cryptocurrency may be an effective way to force more people to learn PINE script programming seriously. And then I can concentrate on answering more valuable community questions instead of being overwhelmed by L4/L5 scripting permission reqeusts.
I would like to announce a ‘Redeem Fee Lock Guarantee’ program to further simplify the L4/L5 indicator/strategy utility offering and distinguish itself from the competition. ‘Redeem Fee lock guarantee’ is one of the major initiatives by BLACKCAT as a part of overall value packaging designed to guard BLACKCAT’s followers’ against cost-overruns and operational risks usually borne by them when it comes to PINE script innovation ecosystem. The TVCs redeemed for L4/L5 a follower signs up for with BLACKCAT is their guaranteed lifetime locked in TVC Quantity/ cryptocurrency, with no special conditions, exclusions and fine print whatsoever. Based on this scheme, I can constantly refine, expand, upgrade and improve PINE script publishing to ensure the very best experiences for my followers. The 'Redeem Fee Lock Guarantee' is a step in the direction of rewarding the valuable followers. NOTE: Every L4/L5 script redeeming service is ONLY limited to TVC or Cryptocurrency ("Win$ & Donate w/ This" Addresses displayed on script page) redeeming which the 1st signed up TVC Qty/ equivalent cryptocurrency is the lifetime offered TVC Qty/ equivalent crypto.
How to subscrible this indicator?
The script subscription period only has two options of one month or one year, and its price is floating. The latest price of the script subscription is proportional to the number of likes/agrees this script has already received. Therefore, the price of subscribing to this script shows an increasing trend, and the earliest subscribers can enjoy the price of lifetime lock to this script. As the number of likes / agrees of this script increases, the subscription fee for one month and one year will also increase linearly. Whatever, the first subscription price of the use will be locked for life.
Monthly subscription and annual subscription can be done either by tradingview coins ( TVC ) or by converting into equivalent cryptocurrency at the exchange rate (1TVC=0.01USD) for redeem.
TVC payment needs to pay TVC directly in the comments under this script. Every time I authorize a new user, I will update the latest number of subscribed users and latest price for next subscription under the script comment. If there are any conflicting scenario happened to the rules and my update. My updated price based on the rule will be the final price for next subscription. The following subscribers need to pay the corresponding amount of TVC or cryptocurrency in accordance with the latest number of users and price announced by me in accordance with the rules published.
TVC redemption is the method I strongly recommend, and I hope you can complete the redemption in the comment area of this script. This is like a blockchain structure, each comment is a block, each subscription is a chain, which is conducive to open and transparent publicity and traceability to avoid unnecessary disputes.
Monthly Subscription Charges
500TVC <50 Agrees (A)
50A<850TVC<100A
100A<1000TVC<150A
150A<1350TVC<200A
200A<1500TVC<250A
250A<1850TVC<300A
300A<2000TVC<350A
350A<2350TVC<400A
400A<2500TVC<450A
450A<2850TVC<500A
500A<3000TVC<550A
550A<3350TVC<600A
600A<3500TVC<650A
650A<3850TVC<700A
700A<4000TVC<750A
750A<4350TVC<800A
800A<4500TVC<850A
850A<4850TVC<900A
900A<5000TVC<950A
950A<5350TVC<1000A
1000A<5500TVC<1050A
And so on...
Annual Subscription Charges
5000TVC <50 Agrees (A)
50A<8500TVC<100A
100A<10000TVC<150A
150A<13500TVC<200A
200A<15000TVC<250A
250A<18500TVC<300A
300A<20000TVC<300A
350A<23500TVC<400A
400A<25000TVC<450A
500A<28500TVC<550A
500A<30000TVC<550A
550A<33500TVC<600A
600A<35000TVC<650A
650A<38500TVC<700A
700A<40000TVC<750A
750A<43500TVC<800A
800A<45000TVC<850A
850A<48500TVC<900A
900A<50000TVC<950A
950A<53500TVC<1000A
1000A<55000TVC<1050A
And so on...

LTB Zigzag CirclesHello All,
Today I am here with a new idea and script, " LTB Zigzag Circles ". The idea is to create Circles using last 2 zigzag waves and to catch the breakouts earlier than horizontal lines. if a circle is broken then the script shows entry for Long/Short positions. and if broken circle reappears again then the position is closed. You can change Zigzag period as you wish and see the different results.
Here you can see how the script calculates and draws the Circles:
Below you can see how the script draws part of the circle on each bar:
Optionally the script can show levels:
P.S. I haven't tested it as a strategy, Result and Performance may change by Zigzag period, you need to find best Zigzag period according to your strategy. By the way, my Zigzag Circles idea can be improved, if you have any recommendation let me know please ;)
Enjoy!

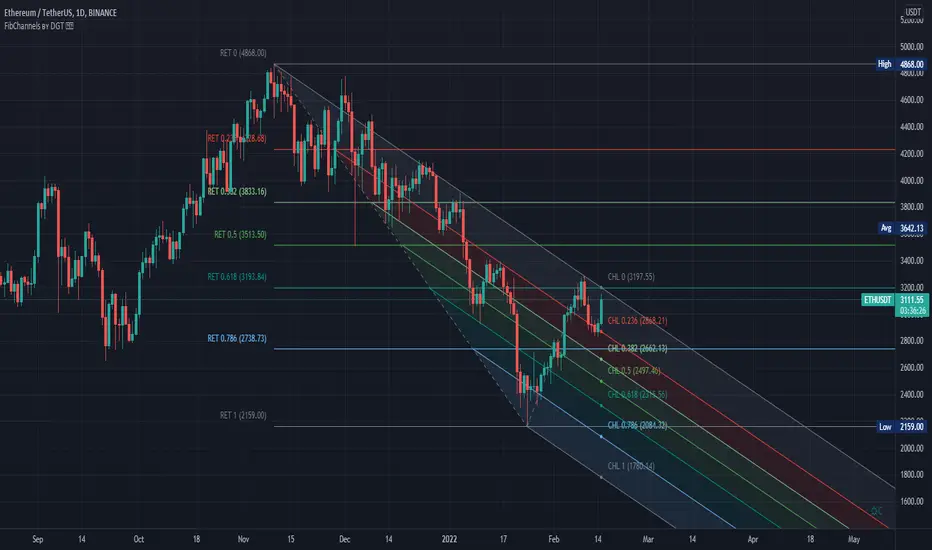
Auto PitchFan, Fib Extension/Retracement and ZigZag by DGT Aᴜᴛᴏ PɪᴛᴄʜFᴀɴ, Fɪʙ Exᴛᴇɴꜱɪᴏɴ/Rᴇᴛʀᴀᴄᴇᴍᴇɴᴛ ᴀɴᴅ ZɪɢZᴀɢ
This study aim to automate PitchFan drawing tool and combines it with Fibonacci Extentions/Retracements and ZigZag.
Common setting options, applied to all components of the study
Deviation , is a multiplier that affects how much the price should deviate from the previous pivot in order for the bar to become a new pivot. Increasing its value is one way to get higher timeframe Levels
Depth , affects the minimum number of bars that will be taken into account when building
Historical PitchFan / Fibonacci Levels option will allow plotting of PitchFan / Fibonacci Levels on previous Pivot Highs/Lows
█ PɪᴛᴄʜFᴀɴ — is a set of rays spreading out of the point of a trend's beginning. These rays inclined with the coefficients formed by a Fibonacci number sequence. It is recommended to adjust the Pitchfan plottings to fit after the first wave of the trend has passed and the correction has clearly begun.
PitchFan rays corresponding to Fibonacci levels appear on a chart and represent inclined lines of support and resistance. Price areas near these rays are estimated areas from which the price can turn around or make a significant rebound. The whole logic of working with a pitchfan is based on one simple idea - if the price has bounced off the level, then the correction is likely to end, and the trend will continue. If the price has broken the first resistance, you should wait for the next level test
- Automatically plots PitchFan Rays, based on Pivot Lows/Highs.
- Ability to set ALERTs for each PitchFan Ray Level
- PitchFan Labels displays the price of the line at the last bar, the price value will be recalculated in each new bar
Please check the link provided below with the educational post of how to apply pitchfork, application of pitchfan is same keeping in mind the recommendation stated above
█ Fɪʙ Rᴇᴛʀᴀᴄᴇᴍᴇɴᴛs / Exᴛᴇɴꜱɪᴏɴꜱ
Fibonacci retracements is a popular instrument used by technical analysts to determine support and resistance areas. In technical analysis, this tool is created by taking two extreme points (usually a peak and a trough) on the chart and dividing the vertical distance by the key Fibonacci coefficients equal to 23.6%, 38.2%, 50%, 61.8%, and 100%.
Fibonacci extensions are a tool that traders can use to establish profit targets or estimate how far a price may travel AFTER a retracement/pullback is finished. Extension levels are also possible areas where the price may reverse.
IMPORTANT NOTE: Fibonacci extensions option may require to do further adjustment of the study parameters for proper usage. Extensions are aimed to be used when a trend is present and they aim to measure how far a price may travel AFTER a retracement/pullback. I will strongly suggest users of this study to check the education post for further details where to use extensions and where to use retracements
- Automatically plots possible Support and Resistance levels, based on Pivot Lows/Highs.
- Ability to set ALERTs for each Fibonacci Extension/Retracement Level
- Labels displays the level and the level price
█ Zɪɢ Zᴀɢ — The Zig Zag indicator is used to help identify price trends and changes in price trends. The Zig Zag indicator plots points on a chart whenever prices reverse by a percentage greater than a Deviation variable. Straight lines are then drawn, connecting these points. The Zig Zag indicator serves base for PitchFan and Fibonacci Retracements / Extensions
█ OTHER
PitchFan is often used in combination with the other indicators and/or drawing tools such as Fibonacci Retracement, Fibonacci Channels, Fibonacci Time Zone and others. It allows identify the most powerful areas from which price can turn and to get more accurate trading signal
Andrews’ Pitchfork, how to apply pitchfork and automated pitchfork study
Fibonacci Fans, how to apply fibonacci fans and automated fibonacci speed and resistance fans study
Fibonacci Extension / Retracement, where to use extensions and where to use retracements and automated fibonacci extension / retracement / pivot points study
Others
Fibonacci Channels, how to apply fibonacci channels and automated fibonacci channels study
Linear Regression Channels, , what linear regression channels are? and linear regression channel/curve/slope study
Disclaimer :
Trading success is all about following your trading strategy and the indicators should fit within your trading strategy, and not to be traded upon solely
The script is for informational and educational purposes only. Use of the script does not constitute professional and/or financial advice. You alone have the sole responsibility of evaluating the script output and risks associated with the use of the script. In exchange for using the script, you agree not to hold dgtrd TradingView user liable for any possible claim for damages arising from any decision you make based on use of the script

Fibonacci Extension / Retracement / Pivot Points by DGTFɪʙᴏɴᴀᴄᴄɪ Exᴛᴇɴᴛɪᴏɴ / Rᴇᴛʀᴀᴄᴍᴇɴᴛ / Pɪᴠᴏᴛ Pᴏɪɴᴛꜱ
This study combines various Fibonacci concepts into one, and some basic volume and volatility indications
█ Pɪᴠᴏᴛ Pᴏɪɴᴛꜱ — is a technical indicator that is used to determine the levels at which price may face support or resistance. The Pivot Points indicator consists of a pivot point (PP) level and several support (S) and resistance (R) levels. PP, resistance and support values are calculated in different ways, depending on the type of the indicator, this study implements Fibonacci Pivot Points
The indicator resolution is set by the input of the Pivot Points TF (Timeframe). If the Pivot Points TF is set to AUTO (the default value), then the increased resolution is determined by the following algorithm:
for intraday resolutions up to and including 5 min, 4HOURS (4H) is used
for intraday resolutions more than 5 min and up to and including 45 min, DAY (1D) is used
for intraday resolutions more than 45 min and up to and including 4 hour, WEEK (1W) is used
for daily resolutions MONTH is used (1M)
for weekly resolutions, 3-MONTH (3M) is used
for monthly resolutions, 12-MONTH (12M) is used
If the Pivot Points TF is set to User Defined, users may choose any higher timeframe of their preference
█ Fɪʙ Rᴇᴛʀᴀᴄᴇᴍᴇɴᴛ — Fibonacci retracements is a popular instrument used by technical analysts to determine support and resistance areas. In technical analysis, this tool is created by taking two extreme points (usually a peak and a trough) on the chart and dividing the vertical distance by the key Fibonacci coefficients equal to 23.6%, 38.2%, 50%, 61.8%, and 100%. This study implements an automated method of identifying the pivot lows/highs and automatically draws horizontal lines that are used to determine possible support and resistance levels
█ Fɪʙᴏɴᴀᴄᴄɪ Exᴛᴇɴꜱɪᴏɴꜱ — Fibonacci extensions are a tool that traders can use to establish profit targets or estimate how far a price may travel AFTER a retracement/pullback is finished. Extension levels are also possible areas where the price may reverse. This study implements an automated method of identifying the pivot lows/highs and automatically draws horizontal lines that are used to determine possible support and resistance levels.
IMPORTANT NOTE: Fibonacci extensions option may require to do further adjustment of the study parameters for proper usage. Extensions are aimed to be used when a trend is present and they aim to measure how far a price may travel AFTER a retracement/pullback. I will strongly suggest users of this study to check the education post for further details, where to use extensions and where to use retracements
Important input options for both Fibonacci Extensions and Retracements
Deviation, is a multiplier that affects how much the price should deviate from the previous pivot in order for the bar to become a new pivot. Increasing its value is one way to get higher timeframe Fib Retracement Levels
Depth, affects the minimum number of bars that will be taken into account when building
█ Volume / Volatility Add-Ons
High Volatile Bar Indication
Volume Spike Bar Indication
Volume Weighted Colored Bars
This study benefits from build-in auto fib retracement tv study and modifications applied to get extentions and also to fit this combo
Disclaimer:
Trading success is all about following your trading strategy and the indicators should fit within your trading strategy, and not to be traded upon solely
The script is for informational and educational purposes only. Use of the script does not constitute professional and/or financial advice. You alone have the sole responsibility of evaluating the script output and risks associated with the use of the script. In exchange for using the script, you agree not to hold dgtrd TradingView user liable for any possible claim for damages arising from any decision you make based on use of the script

[blackcat] L5 Whales Jump Out of Ocean XLevel: 5
Background
I have been working on developing indicators on how to track the banker funds or whales. In my open source indicators published, you can search for the keywords "Banker" or "Whale" to find and use these indicators. After three years of development and hard work, I have perfectly combined the banker fund/whale mathematical model and the unique Fibonacci space-time indicators. This is named as "L5 Whales Jump Out of Ocean X" indicator that I will introduce today.
Function
This indicator introduces three independent judgment standards. They are whales & waves, Fibonacci time windows and dynamic Fibonacci retracement arrows. Whales and waves are banker fund/ whale behavior modeling based on my unique moving average technology. Fibonacci time and space indicators are a unique improvement I made to traditional indicators of the same kind to make them more powerful.
This indicator is basically applicable to all markets, but requires traders to choose the most suitable trading pair to operate. This indicator is used for multiple periods. Because the smaller the period, the more unstable the data, the larger the period, the more stable the Fibonacci space-time indicator. I use this indicator for the operation of cryptocurrency, commodities, forex, local stocks and ETFs. When this indicator is combined with the candle patterns of Japanese candlesticks, it will often produce higher quality signals, so I suggest that people who use this indicator should have the basic knowledge of Japanese candlesticks in order to better use this indicator.
Key Signal
Long Whales / Banker Pump--> fuchsia and red stick bars (Motive waves with fuchsia color; corrective waves with red color)
Short Whales / Banker Dump --> yellow and red green stick bars (Motive waves with yellow color; corrective waves with green color)
Long Waves --> fuchsia and red areas (Motive waves with fuchsia color; corrective waves with red color)
Short Waves --> yellow and red green areas (Motive waves with yellow color; corrective waves with green color)
Fibonacci Top Time Window --> red background color
Fibonacci Bottom Time Window --> green background color
Dynamic Fibonacci Retracement Support Arrows --> green arrows with "SUP" text; the brighter color, the stronger support.
Dynamic Fibonacci Retracement Resistance Arrows --> red arrows with "RES" text; the brighter color, the stronger resistance.
Ready for Support Cross --> green crosses with "*SUP" text on zero axis.
Ready for Resistance Cross --> red crosses with "*RES" text on zero axis.
Pros and Cons
ONLY suitable for discretionary trading, and does NOT support automatic trading system/bots with alerts.
Intuitive and effective, the output signal is more reliable after multi-indicator resonance
Remarks
My first L5 indicator published
Closed-source
Invite-only
Redeem Fee Life Lock Guarantee
Although I take the efforts to inform the script requesters that the best way to promote trading skills is to learn from the open source scripts I released by themself and to improve their PNIE script programming skills, there are still many people asking how to obtain or pay to use BLACKCAT L4/L5 private scripts. In fact, I do not encourage people to use Tradingview Coins (TVC) / Cryptocurrency to redeem the right to use BLACKCAT L4/L5 scripts. However, redeeming private script usage rights through TV Coins/ Cryptocurrency may be an effective way to force more people to learn PINE script programming seriously. And then I can concentrate on answering more valuable community questions instead of being overwhelmed by L4/L5 scripting permission reqeusts.
I would like to announce a ‘Redeem Fee Lock Guarantee’ program to further simplify the L4/L5 indicator/strategy utility offering and distinguish itself from the competition. ‘Redeem Fee lock guarantee’ is one of the major initiatives by BLACKCAT as a part of overall value packaging designed to guard BLACKCAT’s followers’ against cost-overruns and operational risks usually borne by them when it comes to PINE script innovation ecosystem. The TVCs redeemed for L4/L5 a follower signs up for with BLACKCAT is their guaranteed lifetime locked in TVC Quantity/ cryptocurrency, with no special conditions, exclusions and fine print whatsoever. Based on this scheme, I can constantly refine, expand, upgrade and improve PINE script publishing to ensure the very best experiences for my followers. The 'Redeem Fee Lock Guarantee' is a step in the direction of rewarding the valuable followers. NOTE: Every L4/L5 script redeeming service is ONLY limited to TVC or Cryptocurrency ("Win$ & Donate w/ This" Addresses displayed on script page) redeeming which the 1st signed up TVC Qty/ equivalent cryptocurrency is the lifetime offered TVC Qty/ equivalent crypto.
How to subscrible this indicator?
The script subscription period only has two options of one month or one year, and its price is floating. The latest price of the script subscription is proportional to the number of likes/agrees this script has already received. Therefore, the price of subscribing to this script shows an increasing trend, and the earliest subscribers can enjoy the price of lifetime lock to this script. As the number of likes / agrees of this script increases, the subscription fee for one month and one year will also increase linearly. Whatever, the first subscription price of the use will be locked for life.
Monthly subscription and annual subscription can be done either by tradingview coins (TVC) or by converting into equivalent cryptocurrency at the exchange rate (1TVC=0.01USD) for redeem.
TVC payment needs to pay TVC directly in the comments under this script. Every time I authorize a new user, I will update the latest number of subscribed users and latest price for next subscription under the script comment. If there are any conflicting scenario happened to the rules and my update. My updated price based on the rule will be the final price for next subscription. The following subscribers need to pay the corresponding amount of TVC or cryptocurrency in accordance with the latest number of users and price announced by me in accordance with the rules published.
TVC redemption is the method I strongly recommend, and I hope you can complete the redemption in the comment area of this script. This is like a blockchain structure, each comment is a block, each subscription is a chain, which is conducive to open and transparent publicity and traceability to avoid unnecessary disputes.
Monthly Subscription Charges
500TVC <50 Agrees (A)
50A<850TVC<100A
100A<1000TVC<150A
150A<1350TVC<200A
200A<1500TVC<250A
250A<1850TVC<300A
300A<2000TVC<350A
350A<2350TVC<400A
400A<2500TVC<450A
450A<2850TVC<500A
500A<3000TVC<550A
550A<3350TVC<600A
600A<3500TVC<650A
650A<3850TVC<700A
700A<4000TVC<750A
750A<4350TVC<800A
800A<4500TVC<850A
850A<4850TVC<900A
900A<5000TVC<950A
950A<5350TVC<1000A
1000A<5500TVC<1050A
And so on...
Annual Subscription Charges
5000TVC <50 Agrees (A)
50A<8500TVC<100A
100A<10000TVC<150A
150A<13500TVC<200A
200A<15000TVC<250A
250A<18500TVC<300A
300A<20000TVC<300A
350A<23500TVC<400A
400A<25000TVC<450A
500A<28500TVC<550A
500A<30000TVC<550A
550A<33500TVC<600A
600A<35000TVC<650A
650A<38500TVC<700A
700A<40000TVC<750A
750A<43500TVC<800A
800A<45000TVC<850A
850A<48500TVC<900A
900A<50000TVC<950A
950A<53500TVC<1000A
1000A<55000TVC<1050A
And so on...

Auto Fib Channels by DGTThe Fibonacci Channel is a technical analysis tool that is used to estimate support and resistance levels based on the Fibonacci numbers. It is a variation of the Fibonacci retracement tool, except with the channel the lines run diagonally rather than horizontally.
This study will automatically place the channels where the levels indicate future areas of support and resistance
For further details please refer to education post
Nobody appears to know whether Fibonacci tools work because markets exhibit some form of natural pattern or because many investors use Fibonacci ratios to predict price movements, making them a self-fulfilling prophecy.
█ Study OPTIONS
Auto Fibonacci Channels , the main aim of the study
- Pivot threshold can be adjusted via “Deviation” and “Depth” input options
- Historical Channels / Retracements option will allow plotting of Channels on previous pivot high/lows
- Ability to set ALERTs for the Channel Levels
- Channel Labels displays the price of the line at the last bar, the price value will be updated in each new bar
Auto Fib Retracement – This is the build-in study of TradingView, customized to be in-line with Fibonacci Channels
- Pivot threshold can be adjusted via “Deviation” and “Depth” input options
- Historical Channels / Retracements option will allow plotting of Retracements on previous pivot high/lows
- Ability to set ALERTs for the Retracement Levels
Zig Zag – Derived from build-in Auto Fib Retracement with some customization options.
Disclaimer :
Trading success is all about following your trading strategy and the indicators should fit within your trading strategy, and not to be traded upon solely
The script is for informational and educational purposes only. Use of the script does not constitute professional and/or financial advice. You alone have the sole responsibility of evaluating the script output and risks associated with the use of the script. In exchange for using the script, you agree not to hold dgtrd TradingView user liable for any possible claim for damages arising from any decision you make based on use of the script
Avatar trading indicatorIndicator description:
The Avatar indicator is to provide trading insights including trend and momentum, reversal points, Fibonacci retracement, and projections of future reversal or breakout levels.
Avatar is four indicators built into one.
Trend power: shows strength of trend and a change in momentum.
Red: The trend has been determined and is short
Lime: The trend has been determined and is long
Aqua: Continuation of the down trend, but showing down trend is in weakness.
Fuchsia: Continuation of the up trend, but showing up trend is in weakness
Yellow: Trend is reversing or trend is missing direction
Zig Zag: is used to help identify price trends. It plots points on a chart whenever prices reverse.
Major
The trend is graphed based on changes in price. The major trend should be used in deciding which way to enter the trade.
Minor
The minor trend is similar to the major but it is used to determine your entry point. It is easy to spot higher highs or lower lows. Take not when the minor trend fails to set a new high or a new low.
Channels : are price ranges that can provide useful trading information.
These dotted lines are provided as a quick guide to determine where the trend is headed. They show if price is getting squeezed and we should look for a break out using a flag or pennant pattern or is there an ever widening channel creating a broadening wedge . Look for hesitation or a reversal near the channel lines.
Fibonacci base on Zigzag
The Fibonacci retracement is created by taking two reverse points of major Zig Zag on a stock chart and dividing the vertical distance by the key Fibonacci ratios of 0%, 50%, and 100%.
Strategies for using the indicator
To be decided by traders. You are welcome to discuss trading strategies base on Avatar indicator, if your strategies are really good, we can write codes and do backtest on it.
Notes:
1) The code use 'valuewhen' feature which will cause repaint.
2) You can not use it to setup alerts.

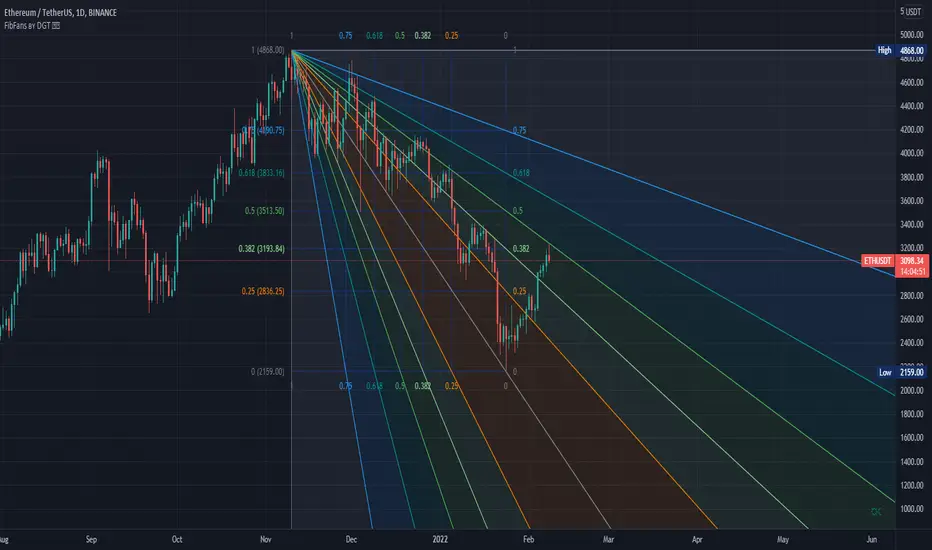
Auto Fib Speed Resistance Fans by DGTFibonacci Speed and Resistance Fan is an analytical drawing tool used to indicate the support and resistance levels of an existing trend and the price level at which possible changes in the trend may occur.
A Fibonacci Speed Resistance Fan consists of a trend line drawn between two extreme points - a trough and opposing peak or a peak and opposing trough - on which a set of sequential speed resistance lines are drawn above (which represents time) and below (which represents price). These lines are drawn based on time/price percentages of the distance between the beginning and the end of the trend line.
Speed resistance lines not only help to measure trend corrections but also measure the speed of a trend (the rate at which a trendline ascends or descends)
Traders can use the lines of the Fibonacci Speed and Resistance Fan to predict key points of resistance or support, at which they might expect price trends to reverse. Once a trader identifies patterns within a chart, they can use those patterns to predict future price movements and future levels of support and resistance. Traders use the predictions to time their trades. Key support and resistance levels tend to occur frequently at the 61.8-percent level on both uptrends and downtrends.
Please check for further details in the education post that I will share shortly after this publication :
Nobody appears to know whether Fibonacci tools work because markets exhibit some form of natural pattern or because many investors use Fibonacci ratios to predict price movements, making them a self-fulfilling prophecy.
█ Study OPTIONS
Auto Fibonacci Speed and Resistance Fan , the main aim of the study
- Pivot threshold can be adjusted via “Deviation” and “Depth” input options
- Historical Fans option will allow plotting of Speed and Resistance Fans on previous pivot high/lows
- Ability to set ALERTs for the Speed and Resistance Levels
- Price Grid Lines if extended it will result with Fib Retracement levels
- All lines, line levels are customizable, default values are set exactly to the same with the available Fib Speed and Resistance Fan drawing tool
Zig Zag – Derived from build-in Auto Fib Retracement with some customization options.
Example Usages :
Disclaimer :
Trading success is all about following your trading strategy and the indicators should fit within your trading strategy, and not to be traded upon solely
The script is for informational and educational purposes only. Use of the script does not constitute professional and/or financial advice. You alone have the sole responsibility of evaluating the script output and risks associated with the use of the script. In exchange for using the script, you agree not to hold dgtrd TradingView user liable for any possible claim for damages arising from any decision you make based on use of the script
Fibonacci levels alerted as Support and Resistance lvlsThis script is another Fibonacci script however this script gives select signals indicating when a resistance level is hit aswell as a support level.
A resistance level is calculated by price action failing to close or open above a fib level yet its high crossing the level. This essentially means price action was too weak to break this level.
The same goes for support levels where the price open and closes above the fib level yet the price low was below. This means the bears where unable to break the support level and may potentially rebound.
This script uses the 0.764, 0.618, 0.5, 0.382 and 0.236 levels. More can be added to script if asked.
From personal use I use the script to help guide the entry and exit for potential trades aswell as helping mark price targets and exit levels. However i never use this script alone and actively ensure it is used alongside other technical indicators.
Within the script there is also a plotted Fibonacci retracement chart which can help visually aid the trader.

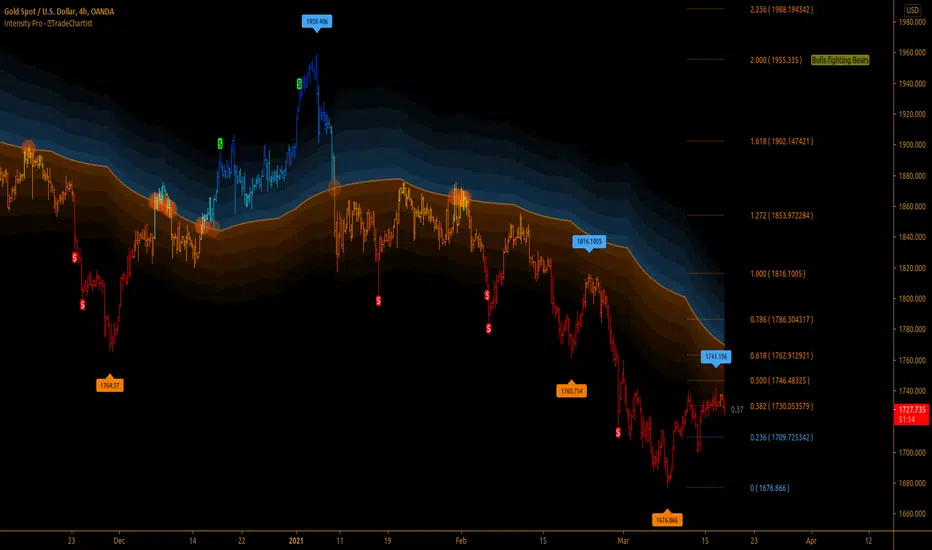
TradeChartist Intensity Pro™TradeChartist Intensity Pro is a visual indicator that comes with 5 Visual Themes and Auto-fibs feature that helps traders with Entry/Exit and levels confirmation based on where the price is, in relation to the Orange Price Equilibrium line and the 5 zones of Bull/Bear limits that fade into the top or bottom outer space.
™TradeChartist Intensity is an original Mean Reversion Model that requires no user input and Intensity Pro incorporates User adjustable Auto-Fibs and manual Fibonacci retracement feature and plots customisable Fib levels along with prices.
======================================================================================
Intensity Pro Features
Orange Mean Equilibrium Line
Bull and Bear Intensity Bands
5 Visual Themes
Trend based Bar Colours
Auto Fibonacci Levels
Custom Auto-Fib Levels
Fibonacci Levels based on Days or Bars Lookback
Current Fib Level label
High and Low Plots
Take Profit Bars
======================================================================================
Example Charts:
1. 4hr BTC-USDT
2. SPX Daily
3. EUR-USD 1hr
======================================================================================
Best Practice: Test with different settings first using Paper Trades before trading with real money
======================================================================================
This is not a free to use indicator. Get in touch with me (PM me directly if you would like trial access to test the indicator)
Premium Scripts - Trial access and Information
Trial access offered on all Premium scripts.
PM me directly to request trial access to the scripts or for more information.
======================================================================================
Auto Fibonacci ComboA combination of Fibonacci indicators including:
1- Moving Auto-calculated Fibo Retracement Levels
2- Dynamic Auto-calculated Fibo Extension Levels
3- Adjustable Auto-calculated Fibo Time Zones
4- ّFlexible Fibo Moving Averages Ribbon
The ribbon consists of 10 moving averages of selected source for different Fibonacci numbers count of bars which could be colorized for a better trend observation. Also the type of the moving averages could be picked up from 6 different types which are:
- SMA (Simple Moving Average)
- EMA (Exponential Moving Average)
- HMA (Hull Moving Average)
- LSMA (Least Squares Moving Average)
- TMA (Triangular Moving Average)
- MAEMA (My Personalized Momentum Adjusted EMA)
I think the latter one makes a nice conjunction with Fibonacci retracements.
Feel free to test the set and send me your thoughts.

NIBIRU DAILY FIBONACCINIBIRU DAILY FIBONACCI plots Fibonacci retracements and extensions for the selected period high-low range.
It is especially useful for range traders but also during trending price when looking for potential pullbacks level to enter a position and manage risk.
Default value is set to Daily time frame as i found it mostly useful for day trades. You can use it with many strategies using fib extensions especially looking for 382-618 levels as potential price action targets.
SETTINGS:
FIBONACCI LINES - turns on/off fibonacci retracement lines
FIBONACCI EXTENSION LINES - turns on/off fibonacci extension lines
FIBONACCI EXTENSION LINES RATIO - sets up the fibonacci extension value
RANGE TF - selects the reference timeframe
Script is free to use.

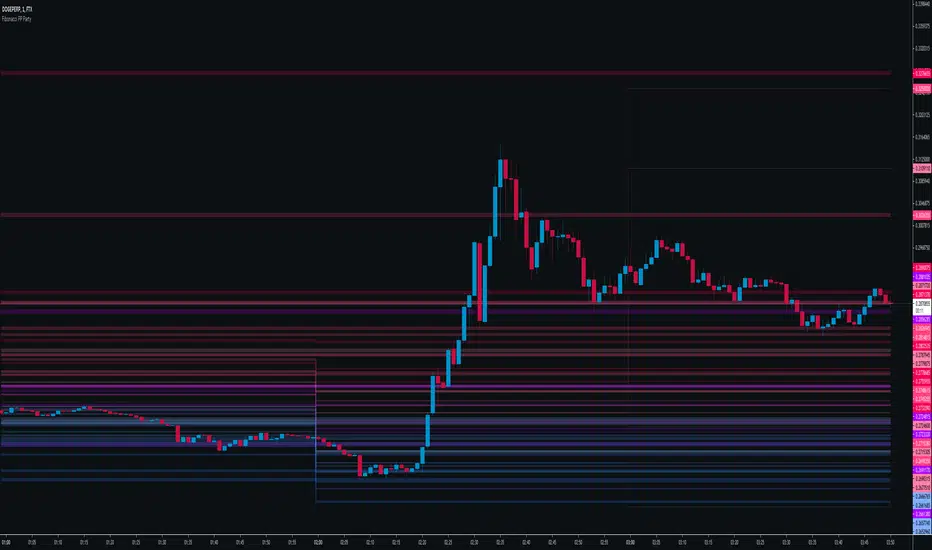
Fibonacci PP PartyMulti-timeframe fibonacci pivot point analysis with 38.2%, 61.8% and 100% retracement levels.
Select and agglomerate different fib timeframes on your single timeframe chart fren .
The following scopes made available and stackable to your heart's desire (toggle on or off timeframes within settings):
1 Week
3 Day
1 Day
12 Hour
6 Hour
4 Hour
3 Hour
2 Hour
1 Hour
Go ahead, hit up that 1m & keep major support and resistance levels in plain view.
Rid your self of narrow scope , ya dope.
Warning: slow performance due to enormous heaps of timeframes hitting the dome.
Let me know where the errors are.
Make Money
Ya dummy
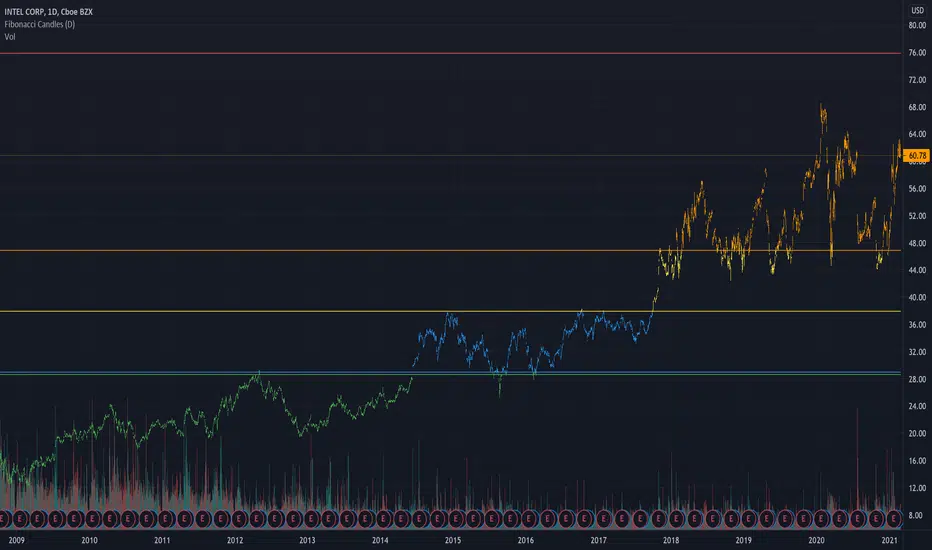
Simple Fibonacci Candles + LevelsThis is a simpler alternative to the auto-fibonacci indicators. Calculates the fibonacci levels based on the all-time high and all-time low prices. Candles are then colored based on the current closing price's relation to the 5 levels.
Auto Fib RetracementThis tool puts the killzone (61.8% to 88.6%) fibs on the last move automatically.
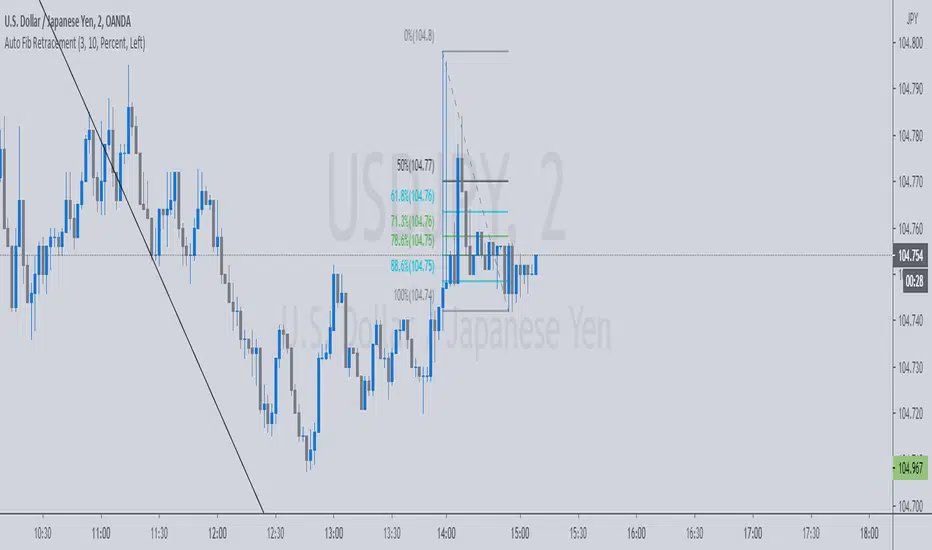
Auto Fib Retracement Modified by MrTuanDoan
This indicator is a modified version of TradingView builtin "Auto Fib Retracement".
It improves how the price is displayed with exact number instead of rounded number.

ZigZag Multi Time Frame with Fibonacci RetracementHello Traders,
This is ZigZag Multi Time Frame with Fibonacci Retracement script. It calculates the ZigZag using Higher Time Frame, draw Fibonacci Retracement lines and put labels accordingly. I already published Zigzag with Fibonacci Levels script but this one is Multi Time Frame and I didn't want to change/update it.
You can set ZigZag Period and Resolution as you wish. Zigzag is calculated using higher time frames (ex: 1day) so you better choose small numbers as Zigzag Period, such 2, 3 etc. you should choose higher time frame wisely, meaning that you should not set 1Day while chart resolution is 1min ;)
It draws Fibonacci levels between 0%-100% and If the price goes higher/lower than 100% level than the script draws Fibonacci Levels accordingly. This means it draws Fibonacci levels until this levels get higher/lower than the price.
"Show Zig Zag" is not enabled by default, you can enable it if you want to see ZigZag as well.
You have options to set Text Color, Line Color, Zigzag Up Color and Zigzag Down Color.
You can set the location of the Fibonnaci Levels -> Left or Right
You also have option to enable/disable following Fibonnaci Levels:
---> 0.236
---> 0.382
---> 0.500
---> 0.618
---> 0.786
I added "Colorful Fibonacci Levels" for fun. if you enable it then Fibonacci line colors will be different randomly on each move, see it for yourself :)
Some Screenshots:
if you enable "Show Zigzag Option":
how the script adjust levels automatically:
if you set Label Location as "Right":
if you enable "Colorful Fibonacci Levels" then Line colors will be changed on each move randomly ;)
Enjoy!
Beacon - Anthony Crudele's IndicatorBeacon uses the current volatility of the market based on your trading time frame to determine support and resistance levels, whether a trend is intact or ready to revert back in the range. One of the most difficult things I went through as a trader was determining whether we are in a trend day or if we are in grind up or grind down mode. I created Beacon to give me a simple look at the market to determine what type of environment we are in. I use Bollinger Bands (3 standard deviation) to determine the volatility cycle. Once the BB make peaks I took my Fibonacci Retracement tool and did a retracement from the peak high of the BB to the peak low. I use 70%, 50% and 30% for my support and resistance levels. I use those levels because I tested pretty much every percent level and those percentages averaged the highest performance on all tick charts and time charts. You can use Beacon on whatever time frame or tick chart you are trading on and it will determine that specific volatility cycle.
