Dynamic Trend-Based Fibonacci Extension💡 This indicator is a sophisticated, automated technical analysis tool designed to identify high-probability trend continuation setups using the principles of market structure and Fibonacci geometry. By algorithmically detecting "A-B-C" price structures (Pivot -> Impulse -> Retracement), it projects dynamic Fibonacci Extension levels to forecast potential price targets for the next impulsive move (Wave C to D). Unlike static drawing tools, this script adapts to market volatility and features an advanced invalidation engine to keep your charts clean and your risk managed.
✨ Originality and Utility
Traders often struggle with the subjectivity of drawing Fibonacci extensions manually. This script solves that by standardizing the identification of market structure using a proprietary ZigZag algorithm enhanced with Average True Range (ATR) for volatility-adjusted sensitivity.
Key unique features include:
Automated Structure Detection: Instantly spots Bullish (Higher High, Higher Low) and Bearish (Lower Low, Lower High) sequences without manual input.
Dynamic Invalidation: The script monitors price action in real-time. If price breaks the invalidation point (Point A), the structure is immediately "grayed out" or deleted, preventing you from trading based on broken setups.
Golden Zone Targeting: Highlights the high-probability reversal zone between the 1.5 and 1.618 extensions, often associated with the completion of a measured move.
JSON Alerting: Built-in support for algorithmic trading with structured JSON payloads (Entry, TP, SL) ready for webhook integration.
🔬 Methodology and Concepts
The core logic operates on a three-step algorithmic sequence:
1. Pivot Identification: The script uses a "ZigZag" approach to find significant swing highs and lows. It employs an ATR-based threshold (or fixed deviation) to filter out market noise, ensuring only significant structural points are considered.
2. Geometric Validation: It evaluates the last three pivot points (A, B, C) to confirm a valid trend structure.
Bullish Setup: Point C must be higher than Point A but lower than Point B (a valid retracement).
Bearish Setup: Point C must be lower than Point A but higher than Point B.
3. Projection Mathematics: Once a valid ABC structure is locked, the script calculates extension targets using the standard formula: Target = Price C + ((Price B - Price A) * Ratio) . It also supports Logarithmic Scale calculations for assets with exponential growth, such as cryptocurrencies, ensuring proportional accuracy over large price ranges.
🎨 Visual Guide
The indicator paints a clear, detailed roadmap on your chart. Here is how to interpret the visual elements:
● Structure Lines
Solid Line (A to B): Represents the initial "Impulse" leg of the move.
Dashed Line (B to C): Represents the "Retracement" or corrective leg.
Green Structures: Indicate Bullish setups (looking for long entries).
Red Structures: Indicate Bearish setups (looking for short entries).
Gray/Dimmed Structures: These are invalidated setups where the price has breached the Stop Loss level (Point A).
● Extension Levels (Targets)
The script projects the following key Fibonacci ratios extending from Point C:
0.618 (Wave 5): An early profit-taking level, often corresponding to a truncated 5th wave.
1.0 (Measured Move): Where the extension equals the length of the initial impulse (AB = CD pattern).
1.272 (Harmonic): A common extension level for corrective structures or deep pullbacks.
Golden Zone (1.5 - 1.618): A highlighted fill area. The 1.618 level (Solid Line) is the "Golden Ratio" and is statistically one of the most significant targets in trending markets, often labeled as "Wave 3".
● Labels
Points A, B, C: Clearly marks the swing points defining the structure.
Right-Side Labels: Display the Ratio (e.g., 1.618) and the exact Price Level for easy order placement.
📖 How to Use
This tool is best used as a trend-following system.
1. Trend Identification
Wait for a new Solid Colored Structure (Green or Red) to appear. This confirms that a valid ABC retracement has occurred.
2. Entry Strategy
The "Trigger" is generally the reversal from Point C. Aggressive traders enter near C, while conservative traders may wait for a breakout above B.
Stop Loss: Place your SL just beyond Point A . If price breaks A, the script will automatically gray out the structure, signaling invalidation.
3. Profit Taking
Use the projected extension lines as dynamic Take Profit (TP) zones:
TP1: 1.0 (The Measured Move).
TP2: The Golden Zone (1.5 to 1.618). This is often the strongest target for a Wave 3 impulsive move.
4. Automation
For automated traders, create an alert using the "Any alert() function call" option. The script outputs a JSON string containing the Action, Ticker, Entry Price, TP (1.618), and SL (Point A).
⚙️ Inputs and Settings
You can fully customize the script to fit your asset class and timeframe:
● ZigZag Detection
Pivot Lookback Depth: (Default: 5) Determines how many bars to check left/right for a pivot. Higher numbers find larger, more significant structures.
Use ATR-Based Threshold: (Default: True) Adapts the sensitivity to market volatility.
ATR Multiplier: (Default: 2.0) Adjusts how much price must reverse to form a new leg.
● Structure Invalidation
Enable Structure Invalidation: (Default: True) Toggles the logic that checks if Point A is breached.
Invalidation Action: Choose "Gray Out" to keep history visible but dimmed, or "Delete" to remove failed setups entirely.
● Fibonacci Settings
Use Logarithmic Scale: Essential for crypto or long-term timeframe analysis.
Show 0.618 / 1.0 / 1.272 / 1.618: Toggles individual levels on/off to declutter the chart.
Extend Lines Right: Extends the target lines into the future for better visibility.
● Display Settings
Keep Last N Structures: Controls how many historical structures remain on the chart to prevent visual clutter.
Show Elliott Wave Labels: Adds theoretical wave counts (e.g., "Wave 3") to the ratio labels.
🔍 Deconstruction of the Underlying Scientific and Academic Framework
This indicator is grounded in Fractal Market Geometry and Elliott Wave Theory .
1. The Golden Ratio (Phi - 1.618):
Mathematically derived from the Fibonacci sequence, the 1.618 ratio is omnipresent in natural growth patterns. In financial markets, it represents the psychological "tipping point" of crowd behavior during an impulsive trend. This script emphasizes the 1.618 extension as the primary target for a "Wave 3," which is academically cited as typically the longest and strongest wave in a 5-wave motive sequence.
2. Harmonic AB=CD Patterns:
The inclusion of the 1.0 extension validates the "Measured Move" concept. Statistically, markets often move in symmetrical legs where the secondary impulse (CD) equals the magnitude of the primary impulse (AB).
3. Volatility Normalization (ATR):
By utilizing the Average True Range (ATR) for pivot detection, the script adheres to statistical volatility normalization. This ensures that the structures identified are statistically significant relative to the asset's current volatility regime, rather than relying on arbitrary percentage moves which fail across different asset classes.
⚠️ Disclaimer
All provided scripts and indicators are strictly for educational exploration and must not be interpreted as financial advice or a recommendation to execute trades. I expressly disclaim all liability for any financial losses or damages that may result, directly or indirectly, from the reliance on or application of these tools. Market participation carries inherent risk where past performance never guarantees future returns, leaving all investment decisions and due diligence solely at your own discretion.
Fibonacci-signals

Fibonacci Extension Strt StrategyCore Logic and Steps:
Weekly Trend Identification:
Find the last significant Higher High (HH) and Lower Low (LL) or vice-versa on the Weekly timeframe.
Determine if it's an uptrend (HH followed by LL) or a downtrend (LL followed by HH).
Plot a Fibonacci Extension (or Retracement in reverse order) from the swing point determined to the other significant swing point.
Weekly Retracement Levels:
Display horizontal lines at the 0.236, 0.382, and 0.5 Fibonacci levels from the weekly extension.
Monitor price action on these levels.
Daily Confirmation:
When price hits the Fib levels, examine the Daily chart.
Look for a rejection wick (indicating the pull back is ending) on the identified weekly retracement levels.
Confirm that the price is indeed starting to continue in the direction of the original weekly trend.
Four-Hour Entry:
On the 4H timeframe, plot a new Fib Extension in the opposite direction of the weekly.
If it's an uptrend, the Fib is plotted from last swing low to its swing high. If the weekly trend was bearish the Fib will be plotted from last swing high to the swing low.
Generate an entry when price breaks the high of that candle.
Trade Management:
Entry is on the breakout of the current candle.
Stop Loss: Place the stop loss below the wick of the breakout candle.
Take Profit 1: Close 50% of the position at the 0.5 Fibonacci level. Move the stop loss to breakeven on this position.
Take Profit 2: Close another 25% of the position at the 0.236 Fib level.
Trailing Take Profit: Keep the last 25% open, using a trailing stop loss. (You'll need to define the logic for the trailing stop, e.g., trailing stop using the last high/low)
How to Use in TradingView:
Open a TradingView Chart.
Click on "Pine Editor" at the bottom.
Copy and paste the corrected Pine Script code.
Click "Add to Chart".
The indicator should now be displayed on your chart.

Fibonacci Buy /Sell SignalsHere is a Fibonacci-based Buy/Sell Indicator using retracement levels for potential support and resistance zones. This indicator plots Fibonacci levels and provides buy/sell signals based on price interaction with these levels.
Fibonacci Levels:
Highest high and lowest low over the lookback period.
Key levels: 38.2% (retracement), 50% (midpoint), 61.8% (strong retracement).
Buy Signal: When the price crosses above the 61.8% Fibonacci level (bullish).
Sell Signal: When the price crosses below the 38.2% Fibonacci level (bearish).

FiboSequFiboSequ: Fibonacci Sequence Marking
Leonardo Fibonacci was an Italian mathematician who lived in the 12th century. His real name was Leonardo of Pisa, but he is commonly known as "Fibonacci." Fibonacci is famous for introducing the Hindu-Arabic numeral system to the Western world. This system is the basis of the modern decimal number system we use today.
Fibonacci Sequence
The Fibonacci sequence is a series of numbers that frequently appears in mathematics and nature. The first two numbers in the sequence are 0 and 1, and each subsequent number is the sum of the two preceding numbers.
The sequence is as follows:
0, 1, 1, 2, 3, 5, 8, 13, 21, 34, 55, 89, 144, 233, 377, 610, 987, 1597, 2584, ...
Fibonacci Time Zones:
Fibonacci time zones are used to identify potential turning points in the market at specific time intervals. These time zones correspond to the Fibonacci sequence in terms of consecutive days or weeks.
The Fibonacci sequence has a wide range of applications in both mathematics and nature. Leonardo Fibonacci's work has had a significant impact on the development of modern mathematics and numeral systems. In financial markets, the Fibonacci sequence and ratios are frequently used by technical analysts to predict and analyze market movements.
Description:
Overview:
The FiboSequ indicator marks significant days on a price chart based on the Fibonacci sequence. This can help traders identify potential turning points or areas of interest in the market. The Fibonacci sequence is a series of numbers where each number is the sum of the two preceding ones, often found in nature and financial markets.
Fibonacci Sequence:
The sequence used in this indicator includes: 1, 3, 5, 8, 13, 21, 34, 55, 89, 144, 233, 377, 610, 987, 1597, and 2584.
These numbers represent the days to be marked on the chart, highlighting possible significant market movements.
How It Works:
User Input:
Users can input the starting date (Year, Month, and Day) from which the Fibonacci sequence will begin to be calculated.
This allows flexibility and customization based on the trader's analysis needs.
Calculation:
The starting date is converted into a timestamp in seconds.
For each bar on the chart, the number of days since the starting date is calculated.
The indicator checks if the current day matches any of the Fibonacci sequence days, the previous day, or the next day.
In this indicator, Fibonacci numbers can be displayed on the chart as plus and minus 2 days. For example, for the 145th day, signals start to appear as 143,144 and 145. This is due to dates that sometimes coincide with weekends and public holidays.
Marking the Chart:
When a match is found, a label is placed above the bar indicating the day number from the Fibonacci sequence.
These labels are colored blue with white text for easy visibility.
Usage:
This indicator can be used on any timeframe and market to help identify potential areas where price might react.
It is especially useful for those who employ Fibonacci analysis in their trading strategy.
Example:
If the starting date is January 1, 2020, the indicator will mark significant Fibonacci days (e.g., 1, 3, 5, 8 days, etc.) on the chart from this date onward.
Community Guidelines Compliance:
This indicator adheres to TradingView's Pine Script community guidelines.
It provides customizable user inputs and does not violate any terms of use.
By using the FiboSequ indicator, traders can enhance their technical analysis by incorporating time-based Fibonacci levels, potentially leading to better market timing and decision-making.
Frequently Asked Questions (FAQ)
Q: What is the FiboSequ indicator?
A: The FiboSequ indicator is a technical analysis tool that marks significant days on a price chart based on the Fibonacci sequence. This indicator helps traders identify potential turning points or areas of interest in the market.
Q: What is the Fibonacci sequence and why is it important?
A: The Fibonacci sequence is a series of numbers where each number is the sum of the two preceding ones. The first two numbers are 0 and 1. This sequence frequently appears in nature and financial markets and is used in technical analysis to identify important support and resistance levels.
Q: How do the Fibonacci time zones in the indicator work?
A: Fibonacci time zones are used to identify potential market turning points at specific time intervals. The indicator calculates days based on the Fibonacci sequence (e.g., 1, 3, 5, 8 days, etc.) from the starting date and marks them on the chart.
Q: How can users set the starting date?
A: Users can input the starting date by specifying the year, month, and day. This sets the date from which the indicator begins its calculations, providing flexibility for user analysis.
Q: What do the labels in the indicator represent?
A: The labels mark specific days in the Fibonacci sequence. For example, 1st day, 3rd day, 5th day, etc. These labels are displayed in blue with white text for easy visibility.
Q: Which timeframes can I use the FiboSequ indicator on?
A: The FiboSequ indicator can be used on any timeframe. This includes daily, weekly, or monthly charts, as well as shorter timeframes.
Q: Which markets can the FiboSequ indicator be used in?
A: The FiboSequ indicator can be used in various financial markets, including stocks, forex, cryptocurrencies, commodities, and more.
Q: How can I achieve better market timing with the FiboSequ indicator?
A: The FiboSequ indicator helps identify potential market turning points using time-based Fibonacci levels. This can lead to better market timing and more informed trading decisions for traders.
-Please feel free to write your valuable comments and opinions. I attach importance to your valuable opinions so that I can improve myself.

Fibonacci Step IndicatorThe Fibonacci Step Indicator assumes irregularity in calculating a moving average. It is measured as the mean of the previous lows and highs situated at Fibonacci past periods. For example, the mean of the lows from 2, 3, 5, 8, etc. periods ago form the Fibonacci step indicator.
The indicator uses the formula for the first twelve Fibonacci numbers on highs and lows so that it creates a moving support/resistance zone. Afterwards, the zone is stabilized by taking the highest highs of the upper indicator and the lowest lows of the lower indicator part.
The indicator is used as a trend following way. It can be compared to the Ichimoku Kinko Hyo cloud (without the future projection). The zone form a support and resistance area. During ranging periods, the market will fluctuate within the area which is a bad time to follow the trend (if any).

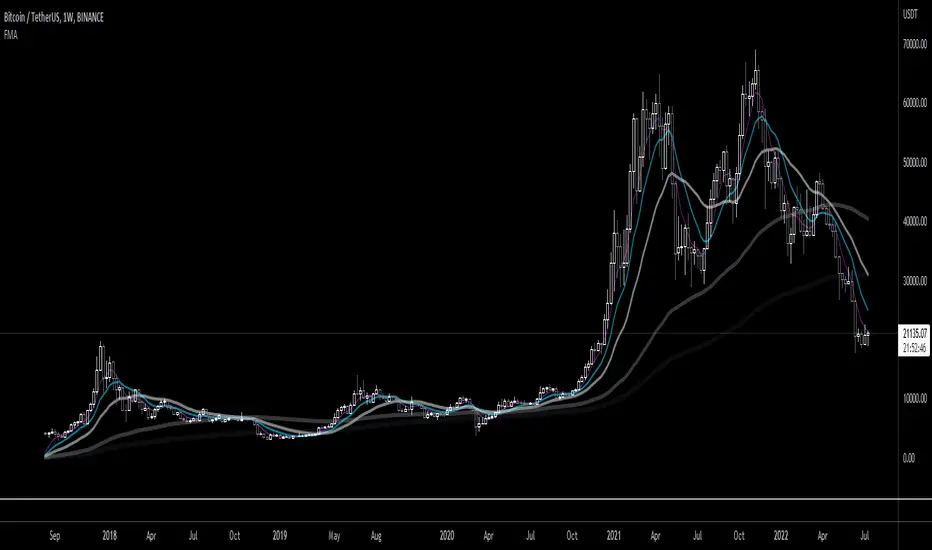
Fibonacci Moving AverageFibonacci moving averages are a more reactive form of EMA utilizing the Fibonacci sequence (1 2 3 5 8 13 ... etc) to weight values.
This method gives several advantages of EMAs: they respond much sooner to price action while still weighting for past values and longer MAs (200 candle, 800 candle) etc moving averages can be calculated from candle 1 - handy for newly listed cryptocurrencies, equities, ETFs, etc.
The script allows for up to 5 moving averages. They can also be set as WMAs which weight older values more than recent to create slow/fast MAs.
They can be used the same way regular EMAs/WMAs are used: crossovers give trade entry/exit points, can indicate trend by alignment with other MAs and by their angle up/down, and - less useful for FMAs since no one else uses them - they can provide resistance.