Golden PocketGolden Pocket
This marks up the fibonacci retracement levels of 0.65 and 0.618 by default, these levels are often referred to as the golden pocket.
They are known by this because when price has an impulse either to the up or downside, price will end up retracing at some point. This Golden pocket often lines up with other means of confluence where it's considered a good entry price from the retrace.
Unlike standard fib retracement indicators, these boxes will extend with current price until they are hit. As well as this, there is a moving average filter which you can set to higher timeframes meaning that you can choose to only look for golden pockets which are following the higher time frame trend. You can easily monitor all of your settings by setting up just 1 alert.
Settings
You have the option to enable/disable the line which marks out the pivot points the fib is being calculated from, you can also change the colour and style of the line.
Below this you have the option to choose what colour the fib boxes are and what colour they change to once price hits it. If you want them to disappear change the colours opacity to 0%.
If you want to change the golden pocket levels you can do that by changing the 0.618 or 0.65 levels in the settings.
The pivot distance controls what part defines a pivot high or low, it must be the highest/lowest to the left/right of the pivot candle count.
MA filter will only accept golden pockets which are trending with the Moving average.
You can change all the settings of the Moving average which acts as a filter including which timeframe it is calculated on.
Alerts
Simply toggle this on int the settings and then click on the 3 dots next to the indicators name, 'add alert', leave the top boxes as they are, you can name the alert anything you like but once you confirm this, it will monitor all golden pockets on the particular asset and timeframe you are looking at. The alerts are set up to trigger as soon as price touches one of the boxes.
Use Cases
We like setting are moving average up on the daily timeframe and using the Moving average filter so we know we are only trading with the higher timeframe trend. From there we can set up alerts on any lower timeframe.
Feel free to use any part of this script in your own code, please just give us a mention so we can check out your contributions to the community as well!
Happy to take in any suggestions or ways of improving
Fib-retracement

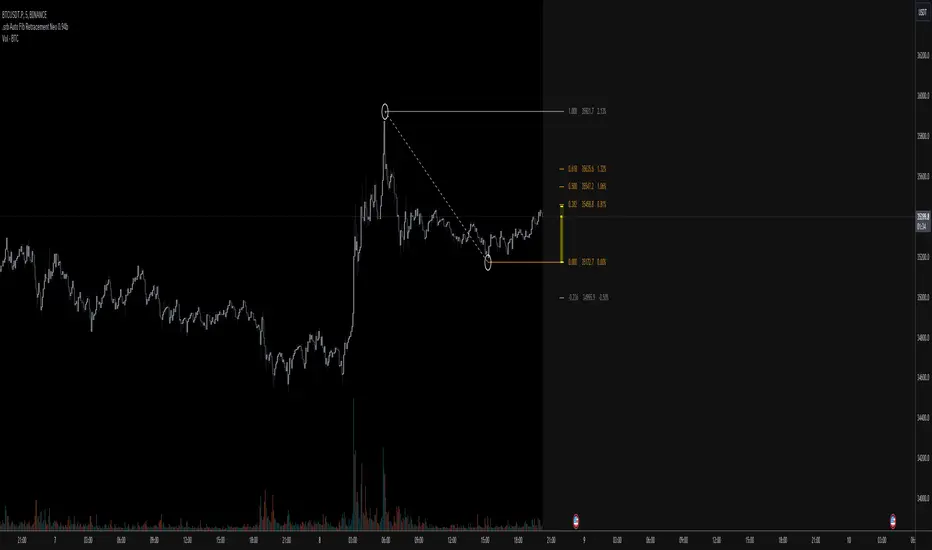
.srb suite Fib Retracement neoSPECIAL TOOLS - Auto Fibonacci Retracement neo - New GUI
designed for use with open-source indicator
'built-in auto FBR ' has been re-born
It shows - retracement Max top/ min bottom ; for higher visibility
It shows - current retracement position ; for higher visibility
The display of the Fib position that exceeds the regular range is auto-determined according to the price.
Fib.Retracement core is from tradingview built-in FBR ---> upgrade new-type GUI, and performance tuned.
.srb suiteThe essential suite Indicator.
that are well integrated to ensure visibility of essential items for trading.
it is very cumbersome to put symbol in the Tradingview chart and combine essential individual indicators one by one.
Moreover even with such a combination, the chart is messy and visibility is not good.
This is because each indicator is not designed with the others in mind.
This suite was developed as a composite-solution to that situation, and will make you happy.
designed to work in the same pane with open-source indicator by default.
Recommended visual order ; Back = .srb suite, Front = .srb suite vol & info
individually turn on/off only what you need on the screen.
BTC-agg. Volume
4 BTC-spot & 4 BTC-PERP volume aggregated.
It might helps you don't miss out on important volume flows.
Weighted to spot trading volume when using PERP+spot volume .
If enabled, BTC-agg.Vol automatically applied when selecting BTC-pair.
--> This is used in calculations involving volumes, such as VWAP.
Moving Average
1 x JMA trend ribbon ; Accurately follow short-term trend changes.
3 x EMA ribbon ; zone , not the line.
MA extension line ; It provide high visibility to recognize the direction of the MA.
SPECIAL TOOLS
VWAP with Standard Deviation Bands
VWAP ruler
BB regular (Dev. 2.0, 2.5)
BB Extented (Dev. 2.5, 3.0, 3.5)
Fixed Range Volume Profile ; steamlined one, performace tuned & update.
SPECIAL TOOLS - Auto Fibonacci Retracement - New GUI
'built-in auto FBR ' has been re-born
It shows - retracement Max top/ min bottom ; for higher visibility
It shows - current retracement position ; for higher visibility
The display of the Fib position that exceeds the regular range is auto-determined according to the price.
tradingview | chart setting > Appearance > Top margin 0%, Bottom margin 0% for optimized screen usage
tradingview | chart setting > Appearance > Right margin 57
.srb suite vol & info --> Visual Order > Bring to Front
.srb suite vol & info --> Pin to scale > No scale (Full-screen)
Visual order ; Back = .srb suite, Front = .srb suite vol & info
1. Fib.Retracement core is from tradingview built-in FBR ---> upgrade new-type GUI, and performance tuned.
2. Fixed-range volume-profile core is from the open-source one ---> some update & perf.tuned.
---------------------------------------------------------------------------------------------------------------------------------------
if you have any questions freely contact to me by message on tradingview.
but please understand that responses may be quite late.
Special thanks to all of contributors of community.
The script may be freely distributed under the MIT license.

Support and ResistanceThis indicator shows three types of support and resistance lines: Horizontal, Parallel (using linear regression) and Fibonacci Retracement. Lines can be adjusted or turned on and off in settings. A great tool for setting up entries, exits and locating pivot points.

Bollinger Bands Fibonacci Ratios (Automatic Timeframe)A Fibonacci Bollinger Bands indicator with automatic timeframe detection.
The timeframe reverts to the value specified in settings when viewing Daily, Monthly or seconds-based charts.
Based on: Bollinger Bands Fibonacci ratios by Shizaru (/script/bCy9urOG-Bollinger-Bands-Fibonacci-ratios/)
