Ticker Pulse Meter + Fear EKG StrategyDescription
The Ticker Pulse Meter + Fear EKG Strategy is a technical analysis tool designed to identify potential entry and exit points for long positions based on price action relative to historical ranges. It combines two proprietary indicators: the Ticker Pulse Meter (TPM), which measures price positioning within short- and long-term ranges, and the Fear EKG, a VIX-inspired oscillator that detects extreme market conditions. The strategy is non-repainting, ensuring signals are generated only on confirmed bars to avoid false positives. Visual enhancements, such as optional moving averages and Bollinger Bands, provide additional context but are not core to the strategy's logic. This script is suitable for traders seeking a systematic approach to capturing momentum and mean-reversion opportunities.
How It Works
The strategy evaluates price action using two key metrics:
Ticker Pulse Meter (TPM): Measures the current price's position within short- and long-term price ranges to identify momentum or overextension.
Fear EKG: Detects extreme selling pressure (akin to "irrational selling") by analyzing price behavior relative to historical lows, inspired by volatility-based oscillators.
Entry signals are generated when specific conditions align, indicating potential buying opportunities. Exits are triggered based on predefined thresholds or partial position closures to manage risk. The strategy supports customizable lookback periods, thresholds, and exit percentages, allowing flexibility across different markets and timeframes. Visual cues, such as entry/exit dots and a position table, enhance usability, while optional overlays like moving averages and Bollinger Bands provide additional chart context.
Calculation Overview
Price Range Calculations:
Short-Term Range: Uses the lowest low (min_price_short) and highest high (max_price_short) over a user-defined short lookback period (lookback_short, default 50 bars).
Long-Term Range: Uses the lowest low (min_price_long) and highest high (max_price_long) over a user-defined long lookback period (lookback_long, default 200 bars).
Percentage Metrics:
pct_above_short: Percentage of the current close above the short-term range.
pct_above_long: Percentage of the current close above the long-term range.
Combined metrics (pct_above_long_above_short, pct_below_long_below_short) normalize price action for signal generation.
Signal Generation:
Long Entry (TPM): Triggered when pct_above_long_above_short crosses above a user-defined threshold (entryThresholdhigh, default 20) and pct_below_long_below_short is below a low threshold (entryThresholdlow, default 40).
Long Entry (Fear EKG): Triggered when pct_below_long_below_short crosses under an extreme threshold (orangeEntryThreshold, default 95), indicating potential oversold conditions.
Long Exit: Triggered when pct_above_long_above_short crosses under a profit-taking level (profitTake, default 95). Partial exits are supported via a user-defined percentage (exitAmt, default 50%).
Non-Repainting Logic: Signals are calculated using data from the previous bar ( ) and only plotted on confirmed bars (barstate.isconfirmed), ensuring reliability.
Visual Enhancements:
Optional moving averages (SMA, EMA, WMA, VWMA, or SMMA) and Bollinger Bands can be enabled for trend context.
A position table displays real-time metrics, including open positions, Fear EKG, and Ticker Pulse values.
Background highlights mark periods of high selling pressure.
Entry Rules
Long Entry:
TPM Signal: Occurs when the price shows strength relative to both short- and long-term ranges, as defined by pct_above_long_above_short crossing above entryThresholdhigh and pct_below_long_below_short below entryThresholdlow.
Fear EKG Signal: Triggered by extreme selling pressure, when pct_below_long_below_short crosses under orangeEntryThreshold. This signal is optional and can be toggled via enable_yellow_signals.
Entries are executed only on confirmed bars to prevent repainting.
Exit Rules
Long Exit: Triggered when pct_above_long_above_short crosses under profitTake.
Partial exits are supported, with the strategy closing a user-defined percentage of the position (exitAmt) up to four times per position (exit_count limit).
Exits can be disabled or adjusted via enable_short_signal and exitPercentage settings.
Inputs
Backtest Start Date: Defines the start of the backtesting period (default: Jan 1, 2017).
Lookback Periods: Short (lookback_short, default 50) and long (lookback_long, default 200) periods for range calculations.
Resolution: Timeframe for price data (default: Daily).
Entry/Exit Thresholds:
entryThresholdhigh (default 20): Threshold for TPM entry.
entryThresholdlow (default 40): Secondary condition for TPM entry.
orangeEntryThreshold (default 95): Threshold for Fear EKG entry.
profitTake (default 95): Exit threshold.
exitAmt (default 50%): Percentage of position to exit.
Visual Options: Toggle for moving averages and Bollinger Bands, with customizable types and lengths.
Notes
The strategy is designed to work across various timeframes and assets, with data sourced from user-selected resolutions (i_res).
Alerts are included for long entry and exit signals, facilitating integration with TradingView's alert system.
The script avoids repainting by using confirmed bar data and shifted calculations ( ).
Visual elements (e.g., SMA, Bollinger Bands) are inspired by standard Pine Script practices and are optional, not integral to the core logic.
Usage
Apply the script to a chart, adjust input settings to suit your trading style, and use the visual cues (entry/exit dots, position table) to monitor signals. Enable alerts for real-time notifications.
Designed to work best on Daily timeframe.
Fear-indicator

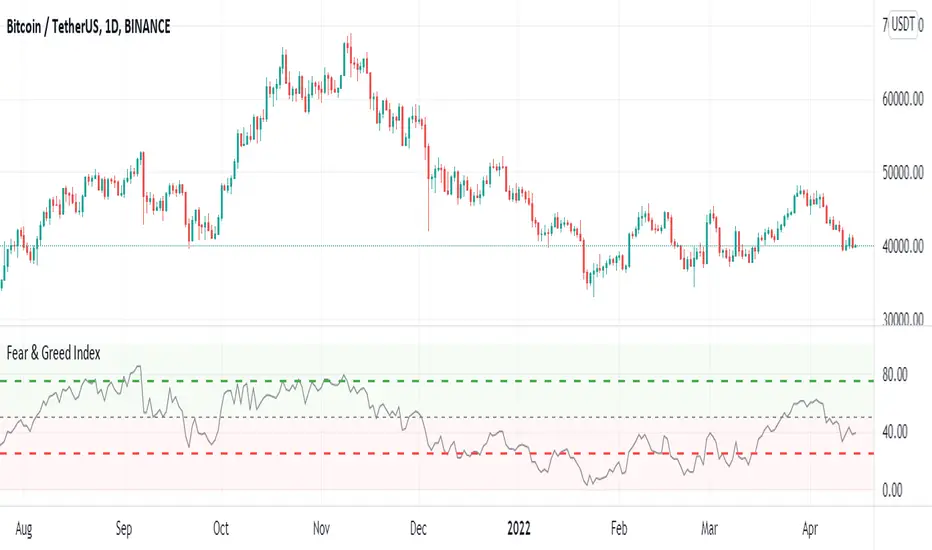
Fear and Greed Index (Crypto & Stock)The Fear and Greed Index utilizes various metrics to gauge the overall sentiment of the stock and crypto market.
It's divided into two categories:
Extreme Fear (0-25) -> Red background
Extreme Greed (75-100) -> Green background
When the index is in the Extreme Fear zone, the indicator background changes to red, while in the Extreme Greed zone, it changes to green.
The blue line represents the Fear and Greed Index for the overall stock or crypto market. The index automatically switches between the crypto and stock depending on the active chart, providing insights into both markets.
The histogram represents Price Momentum for the current active symbol on the chart.
How is the Crypto Fear and Greed Index calculated?
The index is calculated using three factors including momentum of stable coin (safe haven), momentum of major coins, and the balance of unique addresses holding the major coins. The index tracks how much these individual indicators deviate from their averages compared to how much they normally diverge. The index gives each factor equal weighting in calculating a score from 0 to 100, with 100 representing maximum greediness and 0 signaling maximum fear.
The main factors used in the calculation are:
1. Momentum of Stable Coins
The index calculates the momentum of three major stable coins, including USDT, USDC and DAI. The index looks at the stable coins’ levels compared to where they’ve been over the past two months. When the stable coin is below its moving average of the prior 60 trading days, that’s a sign of positive momentum. But if the index is above this average, it shows investors are getting skittish. The Fear & Greed Index uses the growing momentum of stable coin as a signal for Fear and a slowing momentum for Greed.
During a market sell-off, investors may anticipate a decline in the value of their cryptocurrency investments and may transition into stable coins as a safe haven. This is because stable coins are designed to maintain a stable value, often pegged to a fiat currency like the US Dollar.
By analyzing the overall trend of stable coins' movement, the index can help determine whether the market sentiment leans towards greed or fear. If stable coins are experiencing a significant increase in momentum, it may suggest that investors are moving away from riskier assets (like cryptocurrencies) and into safer assets (like stable coins), indicating a fear-driven market sentiment. Conversely, if stable coins are experiencing a decrease in momentum, it may suggest that investors are more confident in the market and are less concerned about potential declines in the value of their cryptocurrency investments, indicating a greed-driven market sentiment.
2. Momentum of major coins
The index calculates the momentum of 16 major cryptocurrencies, including Bitcoin, Ethereum, and BNB. This index assesses the overall trend of these cryptocurrencies' movement, which can provide insights into market sentiment. The index checks how many coins are doing well versus those that are struggling. This shows the number of coins on the market at 2-months highs compared to those at 2-months lows. When there are many more highs than lows, that’s a bullish sign and signals Greed.
By analyzing the momentum of these 16 major cryptocurrencies, the index can help determine whether there's more bullish or bearish sentiment prevailing in the market over the given period. If the overall momentum is positive, it may suggest that investors are more optimistic about the market, leading to increased buying activity and higher prices. Conversely, if the overall momentum is negative, it may suggest that investors are more pessimistic about the market, leading to increased selling activity and lower prices.
3. Balance of unique addresses holding major coins
The index is tracking the number of unique addresses holding Bitcoin and Ethereum. This measure looks at the amount of investors holding Bitcoin or Ethereum and compares the amount to its 2-month moving average.
The logic behind this assessment is that when there are more unique addresses holding Bitcoin and Ethereum, it suggests that more individuals are interested in holding these cryptocurrencies, which may indicate bullish sentiment. Conversely, when there are fewer unique addresses holding Bitcoin and Ethereum, it suggests that fewer individuals are interested in holding these cryptocurrencies, which may indicate bearish sentiment.
How is the Stock Fear and Greed Index calculated?
The Stock Fear & Greed Index is a compilation of two indicators that measure some aspect of stock market behavior. They are market momentum and stock price strength. The Stock Fear & Greed Index calculates how much these individual indicators deviate from their averages and compares this divergence to their typical variations. Both indicators receive equal weighting in calculating a score ranging from 0 to 100.
A score of 100 indicates maximum greediness, suggesting that market momentum and stock prices are significantly above their historical averages.
Conversely, a score of 0 signals maximum fear, indicating that market momentum and stock prices are significantly below their historical averages.
1. Market Momentum
The Stock Fear & Greed index looks at stock market levels compared to where they’ve been over the past few months. When the S&P 500, DJI and NASDAQ is above its moving average of the prior 180 trading days, that’s a sign of positive momentum. But if the index is below this average, it shows investors are getting skittish. The Fear & Greed Index uses slowing momentum as a signal for Fear and a growing momentum for Greed.
2. Momentum of major stocks
The index calculates momentum by analyzing the price levels of major stocks relative to their moving averages over the past six months. When a stock's price is above its moving average of the prior 180 trading days, it indicates positive momentum. Conversely, if the stock's price is below this moving average, it suggests that investors are becoming skittish, or there is a loss of momentum.
How to use the Fear and Greed Index?
The Fear & Greed Index ranges from 0 to 100, a reading of 0-25 indicates extreme fear, while a reading of 75-100 indicates extreme greed. The index can help investors and traders identify market trends and potential turning points. By understanding the sentiment of the market, investors can avoid making decisions based on emotions and biases.
When the Fear and Greed Index is at an extreme level of fear (0-25), it can indicate that investors are overly worried and selling their assets out of fear. This could present a buying opportunity for investors who believe in the long-term potential of the market.
Conversely, when the Fear and Greed Index is at an extreme level of greed (75-100), it can indicate that investors are overly optimistic and buying assets out of greed. This could be a sign that the market is due for a correction.
How is the Price Momentum (Histogram) calculated?
Momentum focuses on the rate of change in stock prices over a specific period. It assesses how quickly prices are moving in a particular direction, whether upward or downward. A momentum value above 50 indicates that prices are fueled by strength to move upward. This suggests that buying pressure is dominant in the market, driving prices higher. Conversely, a momentum value below 50 indicates that prices are fueled by strength moving downward. This suggests that selling pressure is dominant, pushing prices lower.
Our momentum indicator can help investors identify trends and potential turning points in the market. Rising momentum values may indicate an upward trend, while declining momentum values may suggest a weakening trend or a potential reversal.
Extreme momentum values may indicate overbought or oversold conditions in the market. Overbought conditions occur when momentum values are excessively high, suggesting that prices may be due for a correction. Conversely, oversold conditions occur when momentum values are excessively low, indicating potential buying opportunities.
How to use our Fear & Greed Indicator
Using price momentum and the Fear and Greed Index together can provide valuable confirmation signals for investors in the stock or crypto market. Here's how you can use them together:
Identify Trends: Start by identifying the overall trend in the market using price momentum. Rising momentum values often indicate an uptrend, while declining momentum values suggest a downtrend.
Monitor Fear and Greed Index: Simultaneously, monitor the Fear and Greed Index to gauge market sentiment. In an uptrend, high readings on the Fear and Greed Index (75-100) may indicate excessive greed among investors, potentially signaling that the uptrend is becoming overextended and due for a correction. Conversely, in a downtrend, low readings on the Fear and Greed Index (0-25) may indicate extreme fear, potentially signaling capitulation and a possible reversal.
Look for Confirmation Signals: Look for confirmation signals between price momentum and the Fear and Greed Index. For example:
In an uptrend, if momentum is declining while the Fear and Greed Index is at a high level, it may suggest weakening buying pressure and potential exhaustion in the uptrend.
In a downtrend, if momentum is reducing while the Fear and Greed Index is at a low level, it may indicate that selling pressure is subsiding, potentially signaling a reversal in the downtrend.

Stochastic Vix Fix SVIX (Tartigradia)The Stochastic Vix or Stochastic VixFix (SVIX), just like the Williams VixFix, is a realized volatility indicator, and can help in finding market bottoms as well as tops without requiring bollinger bands or any other construct, as the SVIX is bounded between 0-100 which allows for an objective thresholding regardless of the past.
Mathematically, SVIX is the complement of the original Stochastic Oscillator, with such a simple transform reproducing Williams' VixFix and the VIX index signals of high volatility and hence of market bottoms quite accurately but within a bounded 0-100 range. Having a predefined range allows to find markets bottoms without needing to compare to past prices using a bollinger band (Chris Moody on TradingView) nor a moving average (Hesta 2015), as a simple threshold condition (by default above 80) is sufficient to reliably signal interesting entry points at bottoming prices.
Having a predefined range allows to find markets bottoms without needing to compare to past prices using a bollinger band (Chris Moody on TradingView) nor a moving average (Hesta 2015), as a simple threshold condition (by default above 80) is sufficient to reliably signal interesting entry points at bottoming prices.
Indeed, as Williams describes in his paper, markets tend to find the lowest prices during times of highest volatility, which usually accompany times of highest fear.
Although the VixFix originally only indicates market bottoms, the Stochastic VixFix can also indicate good times to exit, when SVIX is at a low value (default: below 20), but just like the original VixFix and VIX index, exit signals are as usual much less reliable than long entries signals, because: 1) mature markets such as SP500 tend to increase over the long term, 2) when market fall, retail traders panic and hence volatility skyrockets and bottom is more reliably signalled, but at market tops, no one is panicking, price action only loses momentum because of liquidity drying up.
Compared to Hesta 2015 strategy of using a moving average over Williams' VixFix to generate entry signals, SVIX generates much fewer false positives during ranging markets, which drastically reduce Hesta 2015 strategy profitability as this incurs quite a lot of losses.
This indicator goes further than the original SVIX, by restoring the smoothed D and second-level smoothed D2 oscillators from the original Stochastic Oscillator, and use a 14-period ZLMA instead of the original 20-period SMA, to generate smoother yet responsive signals compared to using just the raw SVIX (by default, this is disabled, as the original raw SVIX is used to produce more entry signals).
Usage:
Set the timescale to daily or weekly preferably, to reduce false positives.
When the background is highlighted in green or when the highlight disappears, it is usually a good time to enter a long position.
Red background highlighting can be enabled to signal good exit zones, but these generate a lot of false positives.
To further reduce false positives, the SVIX_MA can be used to generate signals instead of the raw SVIX.
For more information on Williams' Vix Fix, which is a strategy published under public domain:
The VIX Fix, Larry Williams, Active Trader magazine, December 2007, web.archive.org
Fixing the VIX: An Indicator to Beat Fear, Amber Hestla-Barnhart, Journal of Technical Analysis, March 13, 2015, ssrn.com
For more information on the Stochastic Vix Fix (SVIX), published under Creative Commons:
Replicating the CBOE VIX using a synthetic volatility index trading algorithm, Dayne Cary and Gary van Vuuren, Cogent Economics & Finance, Volume 7, 2019, Issue 1, doi.org
Note: strangely, in the paper, the authors failed to mention that the SVIX is the complement of the original Stochastic Oscillator, instead reproducing just the original equation. The correct equation for the SVIX was retroengineered by comparing charts they published in the paper with charts generated by this pinescript indicator.
For a more complete indicator, see:

Crypto Fear & Greed IndexCrypto Fear & Greed Index
Crypto Fear & Greed Index is a metric to gauge sentiment levels in the crypto market.
The index starts from 0 to 100, with 0 meaning “Extreme Fear” (a potential bottom signal as investors are overly worried), and 100 meaning “Extreme Greed” (a potential top signal as investors are overly bullish).
Why Measure Fear and Greed?
In most markets, participants tend to be emotional with their behavior. Market participants often get overly greedy and FOMO when prices are on a euphoric rise, whilst they also tend to be overly fearful when prices are down and irrationally selling their positions at a loss.
Using the Crypto Fear and Greed Index
The Crypto Fear and Greed Index is commonly used to time entry into the market. As such, the Index is seen as less of an investment research tool and more of a market-timing tool. As stated by Warren Buffet, “Be fearful when others are greedy, and greedy when others are fearful.”
Calculation of the Crypto Fear and Greed Index
The Crypto Fear and Greed Index is based on three different factors – each factor is gauged from 0 to 100 and equally weighted to generate the index value.
The three factors are:
1. Stable coin flows
If there is a market sell-off and investors are expecting the value of their crypto investment to decline, they may rotate into stable coins as a safe haven.
As such, we look at the general trend of stable coins volume and activity to measure if the market is greedy or fearful.
2. Market Momentum
The performance of the top 18 coins relative to its 30-day average. A greater relative performance indicates greed and vice versa.
3. Top 18 Coins Price Strength
The number of coins of the top 18 coins hitting 90-days highs relative to those hitting 90-days lows. A greater number of coins hitting 90-days highs versus 90-days lows indicates greed and vice versa.
FEAR & GREED INDICATORBINANCE:BTCUSDTPERP
Hello
The crypto index, which is currently only for Bitcoin, captures bearish and bullish trends by gauging investor sentiment for the coin. As the name suggests, the market trend is identified based on two emotions – fear and greed.
This configurations are set for 1D BTC charts
This is simple script, based on cheatcountry script
Enjoy ;)

VIX MTF MomentumSweet little momentum gadget to track the VIX Index.
What is the VIX?
The CBOE S&P 500 Volatility Index (VIX) is known as the 'Fear Index' which can measure how worried traders are that the S&P 500 might suddenly drop within the next 30 days.
When the VIX starts moving higher, it is telling you that traders are getting nervous. When the VIX starts moving lower, it is telling you that traders are gaining confidence.
VIX calculation?
The Chicago Board of Options Exchange Market Volatility Index (VIX) is a measure of implied volatility (Of the S&P 500 securities options), based on the prices of a basket of S&P 500 Index options with 30 days to expiration.
How to use:
If VIX Momentum is above 0 (RED) traders are getting nervous.
If VIX Momentum is below 0 (GREEN) traders are gaining confidence.
Follow to get updates and new scripts: www.tradingview.com

Fearzone & Greedzone Levels - Contrarian & Breakout (Expo)"Be fearful when others are greedy, and greedy when others are fearful" - Warren Buffett. Fearzone & Greedzone Levels - Contrarian & Breakout (Expo) is a contrarian and breakout indicator that gives us an indication when fear and greed begins to take over in the market. Traders should be prepared for increased volatility and good trading opportunities.
This indicator can both be used to identify potential reversal points and be used to identify breakouts from previous Fear and Greed Levels.
The Fearzone and Greedzone can be visualized with candlesticks or with circles depending on what you prefer.
Alert conditions are added.
HOW TO USE
1. Use the indicator to identify when investors are fearful and greedy.
2. Use the indicator to identify potential reversal points.
3. Use the indicator to identify potential breakouts.
INDICATOR IN ACTION
4 hour chart
4 hour chart
I hope you find this indicator useful , and please comment or contact me if you like the script or have any questions/suggestions for future improvements. Thanks!
I will continually work on this indicator, so please share your experience and feedback as it will enable me to make even better improvements. Thanks to everyone that has already contacted me regarding my scripts. Your feedback is valuable for future developments!
-----------------
Disclaimer
Copyright by Zeiierman.
The information contained in my scripts/indicators/ideas does not constitute financial advice or a solicitation to buy or sell any securities of any type. I will not accept liability for any loss or damage, including without limitation any loss of profit, which may arise directly or indirectly from the use of or reliance on such information.
All investments involve risk, and the past performance of a security, industry, sector, market, financial product, trading strategy, or individual’s trading does not guarantee future results or returns. Investors are fully responsible for any investment decisions they make. Such decisions should be based solely on an evaluation of their financial circumstances, investment objectives, risk tolerance, and liquidity needs.
My scripts/indicators/ideas are only for educational purposes!

Fearzone (Expo) - Contrarian Indicator"Be fearful when others are greedy, and greedy when others are fearful" - Warren Buffett. Fearzone is a contrarian indicator that gives us an indication when fear begins to take over in the market. Traders should be prepared for increased volatility and good trading opportunities.
The Fearzone is visualized with red candlesticks below the price.
This version of the FearZone indicator is slightly different from the one ©kruskakli has published.
HOW TO USE
1. Use the indicator to identify when investors are fearful.
2. Use the indicator to identify potential reversal points.
INDICATOR IN ACTION
1 hour chart
5 min chart
I hope you find this indicator useful , and please comment or contact me if you like the script or have any questions/suggestions for future improvements. Thanks!
I will continually work on this indicator, so please share your experience and feedback as it will enable me to make even better improvements. Thanks to everyone that has already contacted me regarding my scripts. Your feedback is valuable for future developments!
-----------------
Disclaimer
Copyright by Zeiierman.
The information contained in my scripts/indicators/ideas does not constitute financial advice or a solicitation to buy or sell any securities of any type. I will not accept liability for any loss or damage, including without limitation any loss of profit, which may arise directly or indirectly from the use of or reliance on such information.
All investments involve risk, and the past performance of a security, industry, sector, market, financial product, trading strategy, or individual’s trading does not guarantee future results or returns. Investors are fully responsible for any investment decisions they make. Such decisions should be based solely on an evaluation of their financial circumstances, investment objectives, risk tolerance, and liquidity needs.
My scripts/indicators/ideas are only for educational purposes!

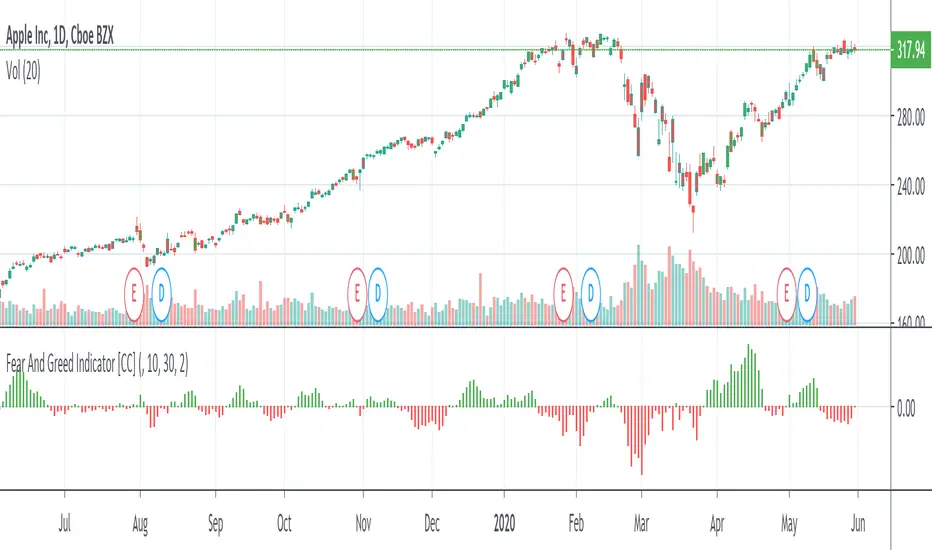
Fear And Greed IndicatorThe Fear And Greed Indicator is a very popular indicator on the Bloomberg platform and since I didn't have actual source code to work with, this is a very close approximation of that indicator. Let me know if you spot any discrepancies with the original and I will do my best to fix them.
For buy and sell signals it is pretty straightforward. Just buy when the green (greed) is in control and sell when the fear (red) is in control
This was a special request so let me know if you want to see more scripts from me or if you want something custom!