Altcoins Exit Executor: 3Commas-Integrated [SwissAlgo]Title: Altcoins Exit Executor: 3Commas-Integrated
Plan and Execute your Altcoins Exits via 3Commas Integration
------------------------------------------------------------------
1. Facing These Struggles?
You're holding a portfolio of altcoins, and the question keeps nagging you: when should you exit? how?
If you're like many crypto traders, you might recognize these familiar struggles:
The Planning Problem : You know you should have an exit strategy, but every time you sit down to plan it, you get overwhelmed. Should you sell at 2x? 5x? What about that resistance level you spotted last month? You end up postponing the decision again and again.
The Execution Headache : You use 3Commas (or an Exchange directly) for your trades, but setting up Smart Trades for multiple coins means endless manual data entry. Price levels, percentages, quantities - by the time you finish entering everything, the market may have already moved.
The Portfolio Scale Problem : Managing 5 altcoins is challenging enough, but what about 15? Or 30? The complexity grows exponentially with each additional position. What started as a manageable analysis for a few coins becomes an overwhelming juggling act that may lead to rushed decisions or complete paralysis.
The Consistency Challenge : You approach each coin differently. Maybe you're conservative with one position and aggressive with another, without any systematic reasoning. Your portfolio becomes a patchwork of random decisions rather than a coherent strategy. With dozens of positions, maintaining any consistent approach becomes nearly impossible.
The "What If" Anxiety : What happens if the market crashes while you're sleeping? You know you should have stop-losses, but setting them up properly across multiple positions feels overwhelming. The more coins you hold, the more potential failure points you need to monitor.
The Information Overload : You collect multiple data points, but how do you synthesize all this information into actionable exit points? Multiply this analysis across 20+ different altcoins, and the task becomes nearly impossible to execute consistently.
This indicator may help address these challenges by providing you with:
A systematic approach to analyzing potential resistance levels across multiple technical frameworks. All potential resistances (including Fibonacci levels) are calculated automatically
Tools to structure your exit plan with clear take-profit levels and position sizing
Automated generation of 3Commas 'Smart Trades' that match your exit strategy exactly, without manual entry
Optional emergency exit protection that could potentially guard against sudden market reversals (exit managed within the 3Commas 'Smart Trade' itself)
A consistent methodology you can apply across your entire altcoin portfolio, regardless of size
The goal is to transform exit planning from a source of stress and procrastination into a structured, repeatable process that may help you execute your trading plan in a consistent fashion, whether you're managing 3 coins or 30.
------------------------------------------------------------------
2. Is this for You?
This indicator is designed for cryptocurrency traders who:
Hold a portfolio of multiple altcoins (typically 5+ positions)
Are actively seeking a systematic solution to plan and execute exit strategies
Have an active 3Commas account connected to their exchange
Understand 3Commas basics: Smart Trades, API connections, and account management
Have an account tier that supports their portfolio size (3Commas Free Plan: up to 3 trades/alts, Pro Plan: up to 50+ trades/alts)
Important: This tool provides analysis and automation assistance, not trading advice. All exit decisions require your individual judgment and proper risk management.
If you don't use 3Commas, you may still find value in the resistance analysis components, though the automated execution features require a 3Commas account and basic platform knowledge.
------------------------------------------------------------------
3. How does it work?
This indicator streamlines your exit planning process into four steps:
Step 1: Analyze Your Coin & Define Exit Plan
The indicator automatically calculates multiple types of resistance levels that may act as potential exit points:
Fibonacci Extensions (projected resistance from recent price swings)
Fibonacci Retracements (resistance from previous cycle highs)
Major Pivot Highs (historical price rejection points)
Volume Imbalances (PVSRA analysis showing institutional activity zones)
Price Multipliers (2x, 3x, 4x, 5x psychological levels)
Market Trend Analysis (bull/bear market strength assessment)
You can view all resistance types together or focus on specific categories to identify potential exit zones.
Step 2: Enter Your Exit Plan.
Define your sequential take-profit strategy:
Set up to 5 take-profit levels with specific prices
Assign percentage of coins to sell at each level
Add your total coin quantity and average entry price
Optionally enable emergency exit (stop-loss) protection. The indicator validates your plan in real-time, ensuring percentages sum to 100% and prices follow logical sequences.
Step 3: Connect with 3Commas
Relay Secret
3Commas API keys (Public and Private)
Account ID (your exchange account on 3Commas)
Step 4: Generate Smart Trade on 3Commas
Create a TradingView alert that automatically:
Sends your complete exit plan to 3Commas
Creates a Smart Trade with all your take-profit levels
Includes stop-loss protection if enabled
Requires no manual data entry on the 3Commas platform
The entire process is designed to streamline the time required to move from analysis to execution, providing a standardized methodology across your altcoin positions.
User Experience Features:
Step-by-step guided workflow
Interactive submission helper with status tracking
Exit plan table with detailed projections
Comprehensive legend and educational tooltips
Dark/light theme compatibility
Organized visual presentation of all resistance levels
------------------------------------------------------------------
4. Using the Indicator
Complete the 4-step guided workflow within the indicator to set up an Exit Plan and submit it to 3Commas.
At the end of the process, you will see a Smart Trade created on 3Commas reflecting your custom Exit Plan (inclusive of Stop Loss, if enabled).
Recommended Settings
Analyze your Exit Plan on the 1-Day timeframe
Use the Tradingview's Dark-Theme for high visual contrast
Set candles to 'Bar-Type' to view volumr-based candle colors (PVSRA analysis)
Use desktop for full content visibility
Analyzing Resistance Levels
Enable "Show all Resistance Levels" to view comprehensive analysis across your chart
Focus on resistance clusters where multiple resistance seem to converge - these may indicate stronger potential exit zones
Note the color-coded system: gray lines indicate closer levels, red lines suggest stronger resistance or potentially "out-of-reach" targets
Pay attention to the Golden Zone (Fibonacci 0.618-0.786 area) highlighted in green, it might act as a significant price magnet for average altcoins
Decide how many Take Profit Steps to use (min. 1 - max- 5)
Setting up your Plan
Enter the total number of coins you want to sell with the script
Enter your average entry price, if known (otherwise the script will use the current price as backup)
Enter the TP levels you decided to activate (price, qty to sell at each TP level)
Decide about the Emergency Exit (the price that, when broken, will trigger the sale of 100% of your coins with a close limit order)
Setting Up Your 3Commas Connection
Generate API keys in your 3Commas account with (User Profile→3Commas API→New API Access Token→System Generated→Permission: "Smart Trades Only" (leave all other permissions unchecked) + Whitelisted IP→Create→Save API public/private key securely)
Find your Account ID in the 3Commas exchange URL (My Portfolio→View Exchange→Look at the last number in the url of the webpage - should be a 8-digit number)
Enter all credentials in the indicator's connection section
Verify the green checkmarks appear on the Exit Table, confirming that plan and connection are validated
Deploying Your Plan
Check box "Step 1: Check and confirm Exit Plan" in section 4 of User Settings
Create a TradingView alert (Alert→Select Altcoins Exit Planner PRO→Any alert() function call→Interval Same as Chart→Open Ended→Message: coin name→Notifications: enable Webhook→save and exit
Your Smart Trade appears automatically in 3Commas within minutes
IMPORTANT: Delete the alert after successful deployment to prevent duplicated Smart Trades
To modify the Exit Plan: Delete the Smart Trade on 3Commas and repeat the process above
Monitor your Smart Trade execution through your 3Commas dashboard
Important Notes
Always verify your plan in the Exit Table before deployment
Test with smaller positions initially to familiarize yourself with the process
The indicator provides analysis - final trading decisions remain yours
Manage your API keys and Relay secret with caution: do not share with third parties, store them securely, use malware protection on your PC
Your API keys, trading data, and credentials are transmitted securely through direct API connections and are never stored, logged, or accessible to the indicator author - all communication occurs directly between your browser and the target platforms that support the service.
------------------------------------------------------------------
5. Understanding the Resistance Analysis
Fibonacci Extensions: Calculated from three key points: 2022 bear market bottom → early 2024 bull market high → 2025 retracement low. These project where price might encounter resistance during future rallies based on mathematical ratios (0.618, 1.0, 1.618, 2.0, etc.).
Fibonacci Retracements: For established altcoins: calculated from 2021 cycle peak to 2022 bottom. For newer altcoins: from all-time high to subsequent major low. These show potential resistance zones where price may struggle to reclaim previous highs.
Major Pivot Highs: Historical price levels where significant reversals occurred. These act as potential resistance because traders may remember these levels and place sell orders near them.
Volume Imbalances (PVSRA) : Areas where price moved rapidly on abnormal volume, creating gaps that may attract future price action or orders. The indicator uses volume-to-price-range analysis (PVSRA candles or "Vector Candles") to identify these zones.
Price Multipliers: Reference lines showing 2x, 3x, 4x, 5x current price to help you assess the feasibility of your exit targets. These serve as a "reality check" - if you're setting a take-profit at 4x current price, you can quickly evaluate whether that level seems reasonable given current market conditions and your risk tolerance.
Market Trend Analysis: Uses EMA combined with ADX/DMI indicators to assess current market phase (bull/strong bull, bear/strong/bear, weakening trend)
This technical foundation helps explain why certain price levels appear as potential exit zones, though market conditions ultimately determine actual price behavior.
------------------------------------------------------------------
6. FAQs
GENERAL FAQS
Can I use one indicator for multiple altcoins?
Answer: No, each altcoin needs its own chart layout with a separate indicator installation. Resistance levels are calculated from each coin's unique price history, and your exit plan will be different for each position. When you deploy an alert, it creates one Smart Trade on 3Commas for that specific coin only.
To manage multiple coins, create separate TradingView layouts for each altcoin, configure the indicator individually on each chart, then deploy one alert per coin when ready to execute. This ensures each position gets personalized analysis and allows different exit strategies across your portfolio.
EXIT PLAN ANALYSIS/RESISTANCE LEVELS
Are resistance lines calculated automatically by the script?
Answer: Yes, all resistance lines are calculated automatically based on your coin's price history and market data. You don't need to manually identify or draw any levels. The script analyzes historical pivots, calculates Fibonacci ratios from key price swings, identifies volume imbalance zones, and plots everything on your chart.
Simply enable "Show all Resistance Levels" in the settings and the indicator will display all potential resistance zones with color-coded lines and labels showing the exact price levels and their significance.
What's the difference between Fibonacci Extensions and Fibonacci Retracements?
Answer: Fibonacci Retracements look at completed moves from the past and show where price might struggle to reclaim previous highs. For established coins, they're calculated from 2021 peaks down to 2022 bottoms.
Fibonacci Extensions project forward from recent price swings to estimate where ongoing rallies might encounter resistance. They use three points: 2022 bottom, 2024 high, and 2025 retracement low.
Retracements ask "where might recovery stall based on old highs" while Extensions ask "where might this current rally run into trouble." Both use the same mathematical ratios but different reference points to give you complementary resistance perspectives.
Why are some resistance lines gray and others red?
Answer: The color coding helps you assess the potential difficulty of reaching different resistance levels. Gray lines represent closer resistance levels, while red lines indicate stronger resistance or potentially "out-of-reach" targets that may require exceptional market conditions to break through.
This visual system helps you prioritize your exit planning by distinguishing between near-term targets and more ambitious longer-term objectives when setting your take-profit levels.
What is the resistance from major pivot highs?
Answer: Major pivot highs are historical price levels where significant reversals occurred in the past. These levels often act as resistance because traders remember these previous "ceiling" points where price failed to break higher and may place sell orders near them again.
The indicator automatically identifies these pivot points from your coin's price history and draws horizontal lines at those levels. When price approaches these areas again, it may struggle to break through due to psychological resistance and clustered sell orders from traders who expect similar rejection patterns.
What is the resistance from abnormal volumes?
Answer: Volume imbalances occur when price moves rapidly on abnormally high volume, creating gaps or zones where institutions moved large amounts quickly. These areas often act as resistance when price returns to them because institutional traders may want to "fill" these gaps or add to their positions at those levels.
The indicator uses PVSRA analysis to identify candles with abnormal volume-to-price ratios and marks these zones on your chart. When price approaches these imbalance areas again, it may encounter resistance from institutional activity or algorithmic trading systems programmed to react at these levels.
What are price multipliers?
Answer: Price multipliers are reference lines showing 2x, 3x, 4x, and 5x the current price. They serve as a reality check when setting your take-profit targets. If you're considering a take-profit at $10 and current price is $2, you can quickly see that's a 5x target and evaluate whether that seems realistic given current market conditions.
These lines help you assess the feasibility of your exit goals and avoid setting unrealistic expectations. They're not resistance levels themselves, but visual aids to help you gauge whether your planned targets are conservative, aggressive, or somewhere in between
How is the EMA calculated and why does it represent bull/bear market intensity?
Answer: The indicator uses a 147-period EMA (1D tf) combined with ADX and DMI indicators to assess market phases. The EMA provides the basic trend direction - when price is above the EMA, it suggests bullish conditions, and when below, bearish conditions.
The intensity comes from the ADX/DMI analysis. Strong bull markets occur when price is above the EMA, ADX is above 25 (indicating strong trend), and the positive directional indicator dominates. Strong bear markets show the opposite pattern with negative directional movement dominating.
The system also uses weekly ADX slope to confirm trend strength is increasing rather than fading. This combination helps distinguish between weak sideways markets and genuine strong trending phases, giving you context at the time of exit planning.
EXIT PLAN
Why does my exit plan show errors?
Answer: The indicator validates your plan in real-time and shows specific error messages to help you fix issues. Common problems include take-profit percentages that don't sum to exactly 100%, price levels set in wrong order (TP2 must be higher than TP1), or gaps in your sequence (you can't use TP3 without filling TP1 and TP2 first).
Check the Exit Plan Validation section in the table - it will show exactly what needs fixing with messages like "TP percentages must sum to exactly 100%" or "Fill TPs consecutively starting from TP1." Fix the highlighted issue and the error will clear automatically, turning your validation checkmark green when everything is correct.
Why do I need to provide my coin quantity and average entry price?
Answer: The coin quantity is essential because the indicator calculates exact amounts to sell at each take-profit level based on your percentages. If you set TP1 to sell 25% of your position, the script needs to know your total quantity to calculate that 25% means exactly X coins in your 3Commas Smart Trade.
The average entry price helps calculate your projected gains and portfolio performance in the Exit Table. If you don't know your exact entry price, leave it at zero and the indicator will use current price as a fallback for calculations. Both pieces of information ensure your Smart Trade matches your actual position size and gives you accurate profit projections.
What is the emergency exit price?
Answer: The emergency exit price is an optional stop-loss feature that automatically sells 100% of your coin position if price falls to your specified level. This is critical to understand because once triggered, 3Commas will execute the sale immediately without further confirmation.
When price hits your emergency exit level, 3Commas places a limit sell order at 3% below that price to avoid poor market execution. However, execution is not guaranteed because limit orders may not fill during extreme volatility or if price gaps below your limit level. Use this feature cautiously and set the emergency price well below normal support levels to account for typical market fluctuations.
This sells your entire position regardless of your take-profit plan, so only enable it if you want automated crash protection and understand the risks of potential false breakdowns triggering unnecessary exits.
3COMMAS CONNECTION
How do I get my 3Commas API keys and Account ID?
Answer:
For API Keys: Log into 3Commas, go to User Profile → 3Commas API → New API Access Token → System Generated. Set permissions to "Smart Trades Only" (leave all other permissions unchecked) and add your IP to the whitelist for security. Save both the public and private keys securely after creation.
For Account ID: Go to My Portfolio → View Exchange in 3Commas. Look at the URL in your browser - the Account ID is the 8-digit number at the end of the webpage address (example: if the URL shows "/accounts/12345678" then your Account ID is 12345678).
Important: Never share these credentials with anyone. The indicator transmits them directly to 3Commas through secure API connections without storing or logging them. If you suspect your keys are compromised, revoke them immediately in your 3Commas account and generate new ones.
ALERTS
I have set up my exit plan, what's next?
Answer: Once your exit plan is configured and shows green checkmarks in the validation section, follow the 4-step workflow in the indicator. Check "Step 1: Check and confirm Exit Plan" to enable alert firing, then create a TradingView alert using the Altcoins Exit Planner PRO condition with "Any alert() function call" trigger.
The alert fires immediately and sends your plan to 3Commas. Within minutes, you should see a new Smart Trade appear in your 3Commas dashboard matching your exact exit strategy. After confirming the Smart Trade was created successfully, delete the TradingView alert to prevent duplicate submissions.
From that point, 3Commas manages your exit automatically according to your plan. Monitor execution through your 3Commas dashboard and let the platform handle the sequential take-profit levels as price moves.
How do I create the TradingView alert?
Answer: Click the "Alert" button in TradingView (bell icon in the top toolbar). In the alert setup window, set Condition to "Altcoins Exit Planner PRO" and Trigger to "Any alert() function call." Keep Interval as "Same as Chart" and Expiration as "Open Ended."
In the Message section, you can name your alert anything you want. In the Notifications section, enable the webhook option (leave the URL field as you'll handle that separately). You can also enable email or sound notifications if desired.
Click "Create" to activate the alert. If Step 1 is already checked in your indicator, the alert will fire immediately and send your exit plan to 3Commas. Remember to delete this alert after your Smart Trade appears to prevent duplicates.
I got the Smart Trade on 3Commas, what's next?
Answer: Congratulations! Your exit plan is now active and automated. Delete the TradingView alert immediately to prevent duplicate Smart Trades from being created. You can now monitor your Smart Trade's progress through your 3Commas dashboard.
3Commas will automatically execute your take-profit levels as price reaches each target, selling the specified percentages of your position according to your plan. If you enabled emergency exit protection, that stop-loss is also active and monitoring for downside protection.
Your job is essentially done - let 3Commas handle the execution while you monitor overall market conditions. You can view trade progress, modify the Smart Trade if needed, or manually close it early through your 3Commas interface. The platform will manage all the sequential selling according to your original exit strategy.
Can I cancel my exit plan and resubmit to 3Commas?
Answer: Yes, you can modify your exit strategy by first deleting the existing Smart Trade in your 3Commas dashboard, then resubmitting a new plan through the indicator.
To cancel and resubmit: Go to your 3Commas Smart Trades section and delete the current trade. Return to the TradingView indicator, modify your exit plan settings (prices, percentages, emergency exit, etc.), then repeat the deployment process by checking Step 1 and creating a new alert.
This creates a fresh Smart Trade with your updated parameters. Always ensure you delete the old Smart Trade first to avoid having multiple conflicting exit plans running simultaneously. The new deployment will overwrite nothing automatically - you must manually clean up the old trade before submitting the revised plan.
Why did I get a second Smart Trade after the first one?
Answer: This happens when you forget to delete the TradingView alert after your first Smart Trade was created successfully. The alert remains active and continues firing, creating duplicate Smart Trades each time it triggers.
Always delete your TradingView alert immediately after confirming your Smart Trade appears in 3Commas. Go to your TradingView alerts list, find the alert you created for this exit plan, and delete it completely. Also delete any duplicate Smart Trades in your 3Commas dashboard to avoid confusion.
To prevent this in future deployments, remember the workflow: create alert → Smart Trade appears → delete alert immediately. Each exit plan should only generate one Smart Trade, and keeping alerts active will cause unwanted duplicates.
------------------------------------------------------------------
7. Limitations and Disclaimer
Limitations:
Doesn't provide trading signals or entry points
Doesn't guarantee resistance levels will hold
Requires manual monitoring of 3Commas execution
Works for exit planning only, not position building
Disclaimer
This indicator is for educational and informational purposes only. It does not constitute financial, investment, or trading advice.
The indicator:
Makes no guarantees about future market performance
Cannot predict market movements with certainty
May generate false indications
Relies on historical patterns that may not repeat
Should not be used as the sole basis for trading decisions
Users are responsible for:
Conducting independent research and analysis
Understanding the risks of cryptocurrency trading
Making their own investment/divestment decisions
Managing position sizes and risk exposure appropriately
Managing API keys and secret codes diligently (do not share with third parties, store them securely, use malware protection on your PC)
Cryptocurrency trading involves substantial risk and may not be suitable for all investors. Past performance does not guarantee future results. Users should only invest what they can afford to lose and consult qualified professionals before making financial decisions.
The indicator’s assumptions may be invalidated by changing market conditions.
By using this tool, users acknowledge these limitations and accept full responsibility for their trading decisions.
Exitstrategy

Altcoins Exit Planner [SwissAlgo]Altcoins Exit Planner
Navigating Altcoin Exits: A Strategic Approach: Planning your exits before emotions take over
------------------------------------------------------------------
✅ THE PSYCHOLOGY OF ALTCOIN TRADING
Many traders face recurring challenges when managing altcoin positions:
The Greed Trap : Holding through euphoric rallies, hoping for unrealistic targets, only to watch gains evaporate during market reversals.
The Paralysis Problem : Sitting on large unrealized profits but unsure which assets to exit, when, or how much — leading to inaction.
The FOMO Cycle : Rotating into trending coins too early or too late, often abandoning solid positions prematurely.
Analysis Overload : Consuming endless opinions and indicators without ever forming a clear, actionable exit strategy.
These patterns often stem from a lack of structure and planning . Emotional decision-making in volatile markets can be costly — especially with altcoins.
Developing a systematic framework can help define exit levels in advance , aiming to reduce emotional bias and improve decision clarity. The goal is to build disciplined exit strategies based on predefined logic rather than reactive impulses.
------------------------------------------------------------------
✅ FEATURES & FUNCTIONALITY
This indicator is designed to provide traders with a structured framework for exit planning. It aims to reduce decision-making under pressure by offering a visual roadmap on the chart.
The tool provides an analysis of key data points, including:
Structured Analysis : The indicator evaluates asset strength, identifies potential market phases, and derives potential exit levels from historical price behavior. This analysis may help traders assess whether an asset shows characteristics of strength (e.g., potential for extended targets) or weakness (e.g., early exit signals).
Actionable Information : It generates specific price levels and quantities for consideration as part of a predefined exit strategy.
Proactive Alerts : The system includes configurable alerts that can notify users as prices approach these key levels, allowing time for preparation. This feature is intended to support a shift from reactive trading toward systematic, criteria-based exit planning.
------------------------------------------------------------------
✅ HOW IT WORKS - AUTOMATED ANALYSIS & PLANNING
This indicator is designed to automate key aspects of exit planning that would otherwise require manual effort:
Fibonacci Level Calculation & Plotting : Automatically identifies key historical cycle points (e.g., bear market lows, bull market highs, recent pullbacks) and calculates relevant Fibonacci levels (both "Fib Retracments" from previous cycle ATH to bear market bottom, and "Fib. extensions" - considering major price impulses/waves in current bull market). This may help reduce manual drawing errors and streamline target identification.
Automated Calculation and Plotting of "Fib. Retracement "Levels
(from ATH of previous cycle to bottom in bear market)
Fibonacci retracement levels are a popular tool used in technical analysis to identify potential support and resistance levels in a market. After a significant price move, traders look for the price to "retrace" or pull back to one of several key Fibonacci ratios of the original move before continuing in its original direction. The most common retracement levels are 23.6%, 38.2%, 50%, 61.8%, and 78.6%. These levels are static horizontal lines on a chart, and their predictive power is based on the idea that they are "areas of interest" where a trend might pause or reverse.
Automated Calculation and Plotting of "Fib. Extension" Levels
(Price Impulses/Waves within current Bull Market)
Fibonacci extension levels are used to identify potential price targets or profit zones once a market has moved past its previous high or low. Unlike retracements, which measure a pullback, extensions project how far a trend might continue in the direction of its impulse move. They are typically used to anticipate where a wave or a rally might end and are based on ratios like 127.2%, 161.8%, 261.8%, and sometimes even higher. Extensions are a key tool for traders looking to set price targets for taking profits.
Coin Strength Assessment: Evaluates recovery performance relative to previous cycle peaks and classifies assets into four categories (Weak, Average, Strong, Outlier). Strength ratings may adjust dynamically based on momentum conditions — all derived from price data.
Market Phase Detection : Continuously monitors trend indicators, volume behavior, and altseason dynamics to estimate the current market phase. This may assist in contextualizing exit decisions without requiring manual phase analysis.
Exit Level Generation : Based on the asset’s strength classification and selected strategy (Conservative, Balanced, Aggressive), the system generates sequential exit levels with suggested percentages and quantities. Designed to support structured planning across three stages.
Signal Detection : Tracks multiple conditions — including price extensions, volume surges, momentum shifts, and cycle patterns — to generate alerts when predefined criteria are met.
Emergency Exit Detection : Scans for rare but high-risk scenarios (e.g., cycle top formations with multiple confluences) that may warrant immediate attention. Alerts are designed to highlight potential overextension during volatile phases.
Transfer Alerts : Calculates proximity to key exit zones and may issue early warnings to prepare for execution (e.g., moving assets from cold storage to exchanges), aiming to reduce last-minute decision pressure.
The script operates in two distinct modes:
Coin Analysis Mode Displays automatically-calculated Fibonacci levels, asset strength classification, market phase estimation, and contextual risk factors — designed to support structured analysis.
Exit Plan Mode Generates a customizable exit strategy with calculated price levels, suggested quantities, and potential outcome scenarios — aiming to assist with disciplined planning and reduce emotional bias.
------------------------------------------------------------------
✅ SETUP & INSTALLATION
Step 1: Chart Setup
Add the indicator to your altcoin USD chart (e.g., spot market pairs).
Recommended timeframe: 3 days for signal clarity.
Dark theme suggested for visual contrast.
Step 2: Configure Your Exit Strategy
Open Settings → “Setup Your Exit Plan”
Choose your strategy: Conservative: Prioritizes earlier exits for stricter risk control; Balanced: Combines early and late exits for a mixed approach; Aggressive: Targets later exits, accepting potentially higher volatility.
Input your asset quantity.
(Optional) Set a minimum sell price to block exit signals below your defined threshold.
(Optional) Set a sell-now price to trigger a sell alert when your exit target is reached, bypassing intermediate levels.
Step 3: Choose Display Mode
Coin Analysis Mode: View market conditions, strength classification, Fibonacci levels, and contextual risk insights. Designed to support monitoring and signal validation.
Exit Plan Mode: Displays your structured exit roadmap with suggested price levels, quantities, and visual chart overlays. Focuses on execution and planning.
Step 4: Set Up Alerts (Recommended)
Click the “Alert” button on the chart.
Select “Altcoins Exit Planner” as the condition.
Choose alert type: Planned Exit, Emergency Exit, Transfer Alert, Local Top, Trend Change
Set expiration to “Open-ended”
Configure your preferred notification method.
Alert Types Include:
Planned Exit Alerts: Triggered when suggested exit levels are reached (Exit #1, #2, #3).
Emergency Exit Alerts: Highlight potential cycle tops or full-exit conditions.
Transfer Alerts: Advance notice to prepare for execution (e.g., moving assets to exchanges).
Local Top Alerts: Short-term pullback signals for tactical decisions.
Trend Change Alerts: Indicate potential market phase transitions.
Once configured, the indicator begins analyzing and may notify you when exit conditions align with your selected strategy.
------------------------------------------------------------------
✅ USER INTERFACE
The interface is organized into two primary modes:
1) Coin Analysis Mode
Analysis Table Includes:
Fibonacci levels with price targets and percentage differentials
Market trend status (e.g., Strong Bull, Weakening Bull, Bear Market)
Volume behavior (Normal / Abnormal)
Price extension status (Overextended / Within range)
Altseason detection
Coin strength classification
Reversal risk assessment (Low / Average / High)
Suggested action based on current conditions
Visual Elements:
Bull/Bear trend EMA line
Volume-based candle coloring (overrides default chart candles)
Pivot points for key structural levels
Selectable Fibonacci extension/retracement lines
Background highlighting during altseason periods (potential cycle peak phase)
2) Exit Plan Mode
Exit Plan Table Displays:
Suggested quantity to sell at each exit level
Estimated portfolio value in USD
Structured exit plan with Fibonacci levels, percentages, quantities, and projected amounts
Average exit price calculation
Potential outcome scenarios if all exit levels are reached
Price Lines:
Individual exit level markers with contextual details
Average exit price reference line
Minimum sell price line (if enabled)
Sell-now price line (if enabled)
Signal Indicators:
Blue diamonds: Planned exit levels reached
Red triangles: Cycle top warnings
Orange triangles: Local top signals
These elements are designed to assist with visual interpretation and structured decision-making. All outputs are derived from price data and user-defined settings.
------------------------------------------------------------------
✅ LIMITATIONS
Market Cycle Dependency: This indicator is designed for cryptocurrency market cycles and will not perform similarly in other asset classes or market conditions. Its logic is based on historical crypto behavior, which may not repeat.
Assumption-Based Framework: The methodology relies on assumptions about market cycles, Fibonacci relationships, and altcoin behavior patterns. These assumptions may not hold under future conditions.
User Responsibility
All signals require user interpretation and decision-making.
The indicator provides information, not investment advice.
Signals should be validated with additional analysis.
Position sizing and risk management remain the user's responsibility.
Technical Requirements
Intended for use on the 3-day timeframe.
Designed for altcoin/USD trading pairs.
Requires sufficient historical data for Fibonacci calculations.
May not function properly on newly listed assets with limited price history.
Risk Management Guidelines. Recommended practices include:
Use with limited portions of your portfolio.
Combine with other technical and fundamental tools.
Consider broader market context beyond indicator signals.
Maintain independent stop-loss levels.
Review and adjust settings as market conditions evolve.
Signal Interpretation
Emergency signals highlight conditions that may warrant immediate review.
Planned exits support gradual, structured position reduction.
Transfer alerts provide preparation time before potential execution.
Local top signals may assist short-term tactical decisions.
------------------------------------------------------------------
✅ DISCLAIMER
This indicator is for educational and informational purposes only . It does not constitute financial, investment, or trading advice.
The indicator:
Makes no guarantees about future market performance.
Cannot predict market movements with certainty.
May generate false signals or miss key developments.
Relies on historical patterns that may not repeat.
Should not be used as the sole basis for trading decisions.
Users are responsible for:
Conducting independent research and analysis.
Understanding the risks of cryptocurrency trading.
Making their own investment/divestment decisions.
Managing position sizes and risk exposure appropriately.
Cryptocurrency trading involves substantial risk and may not be suitable for all investors. Past performance does not guarantee future results. Users should only invest what they can afford to lose and consult qualified professionals before making financial decisions.
The indicator’s assumptions may be invalidated by changing market conditions.
By using this tool, users acknowledge these limitations and accept full responsibility for their trading decisions.

Relative Risk MetricOVERVIEW
The Relative Risk Metric is designed to provide a relative measure of an asset's price, within a specified range, over a log scale.
PURPOSE
Relative Position Assessment: Visualizes where the current price stands within a user-defined range, adjusted for log scale.
Logarithmic Transformation: Utilizes the natural log to account for a log scale of prices, offering a more accurate representation of relative positions.
Calculation: The indicator calculates a normalized value via the function Relative Price = / log(UpperBound) − log(LowerBound) . The result is a value between 0 and 1, where 0 corresponds to the lower bound and 1 corresponds to the upper bound on a log scale.
VISUALIZATION
The indicator plots three series:
Risk Metric - a plot of the risk metric value that’s computed from an asset's relative price so that it lies within a logarithmic range between 0.0 & 1.0.
Smoothed Risk Metric - a plot of the risk metric that’s been smoothed.
Entry/Exit - a scatter plot for identified entry and exit. Values are expressed as percent and are coded as red being exit and green being entity. E.g., a red dot at 0.02 implies exit 2% of the held asset. A green dot at 0.01 implies use 1% of a designated capital reserve.
USAGE
Risk Metric
The risk metric transformation function has several parameters. These control aspects such as decay, sensitivity, bounds and time offset.
Decay - Acts as an exponent multiplier and controls how quickly dynamic bounds change as a function of the bar_index.
Time Offset - provides a centering effect of the exponential transformation relative to the current bar_index.
Sensitivity - controls how sensitive to time the dynamic bound adjustments should be.
Baseline control - Serves as an additive offset for dynamic bounds computation which ensures that bounds never become too small or negative.
UpperBound - provides headroom to accomodate growth an assets price from the baseline. For example, an upperbound of 3.5 accommodates a 3.5x growth from the baseline value (e.g., $100 -> $350).
LowerBound - provides log scale compression such that the overall metric provides meaningful insights for prices well below the average whilst avoiding extreme scaling. A lowerbound of 0.25 corresponds to a price that is approx one quarter of a normalised baseline in a log context.
Weighted Entry/Exit
This feature provides a weighted system for identifying DCA entry and exit. This weighting mechanism adjusts the metric's interpretation to highlight conditions based on dynamic thresholds and user-defined parameters to identify high-probability zones for entry/exit actions and provide risk-adjusted insights.
Weighting Parameters
The weighting function supports fine-tuning of the computed weighted entry/exit values
Base: determines the foundational multiplier for weighting the entry/exit value. A higher base amplifies the weighting effect, making the weighted values more pronounced. It acts as a scaling factor to control the overall magnitude of the weighting.
Exponent: adjusts the curve of the weighting function. Higher exponent values increase sensitivity, emphasizing differences between risk metric values near the entry or exit thresholds. This creates a steeper gradient for the computed entry/exit value making it more responsive to subtle shifts in risk levels.
Cut Off: specifies the maximum percentage (expressed as a fraction of 1.0) that the weighted entry/exit value can reach. This cap ensures the metric remains within a meaningful range and avoids skewing
Exit condition: Defines a threshold for exit. When the risk metric is below the exit threshold (but above the entry threshold) then entry/exit is neutral.
Entry condition: Defines a threshold for entry. When the risk metric is above the entry threshold (but below the exit threshold) then entry/exit is neutral.
Weighting Behaviour
For entry conditions - value is more heavily weighted as the metric approaches the entry threshold, emphasizing lower risk levels.
For exit conditions - value is more heavily weighted as the metric nears the exit threshold, emphasizing increased risk levels.
USE-CASES
Identifying potential overbought or oversold conditions within the specified logarithmic range.
Assisting in assessing how the current price compares to historical price levels on a logarithmic scale.
Guiding decision-making processes by providing insights into the relative positioning of prices within a log context
CONSIDERATIONS
Validation: It's recommended that backtesting over historical data be done before acting on any identified entry/exit values.
User Discretion: This indicator focus on price risk. Consider other risk factors and general market conditions as well.

ATR Range Pivot LinesDescription:
This Pine Script calculates and plots pivot lines based on ATR (Average True Range) value and closing price. It uses the previous trading day's ATR value to set static pivot levels for the current trading day. These pivot lines help traders identify potential support and resistance levels based on historical volatility. The script includes two main pivot lines—ATR High and ATR Low —and two midpoint lines between them for additional context. Labels are added to show the exact pivot values, with options to customize label positions.
Intended Use:
The script is designed to help traders forecast potential price ranges for the current trading day based on the previous day’s volatility. By adding and subtracting the previous day's ATR from the prior close, the script identifies key levels where price action may encounter support or resistance. It is useful for setting realistic price targets or entry/exit points. Since the ATR-based pivot lines are static for the entire day, they provide a reliable range for intraday trading strategies.
Disclosure:
This script was generated using AI. It is recommended to review and test the script thoroughly before applying it in live trading scenarios.

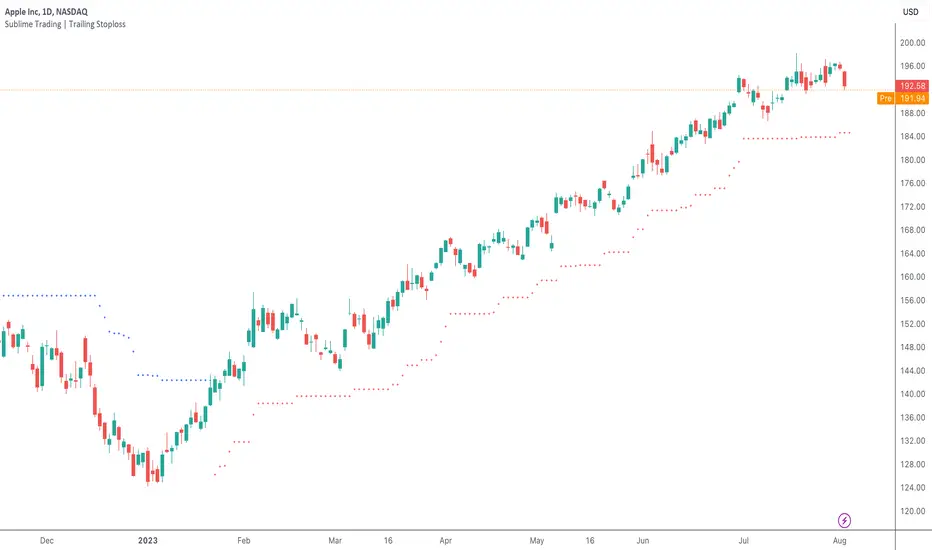
Sublime Trading | Trailing StoplossWhat kind of traders/investors are we?
We are trend followers. Our scripts are designed to be used on the higher timeframes (weekly/daily) to catch the large moves/trends in the market.
Most have heard of long-term trend following. Few know how to execute the strategy.
Our scripts are designed specifically to identify and invest in long-term market trends.
What does this script do?
The exit from a position is arguably more important than the entry.
Traders/Investors will regularly find themselves in an asset based on some logic, but the exit management is very much an afterthought.
Hence why traders often take profit too early and hold onto losing positions. It is emotionally driven.
The Trailing Stoploss script is designed to remove the guesswork and show you precise levels you will want to consider exiting a position when an asset reverses.
How is the trailing stoploss produced?
The script uses the formula ATR 15 x 4.
We use ATR as it produces a stoploss which is unique to the volatility of the asset. The more volatile the asset, the wider the stoploss.
We use ATR 15 as it brings an average reading across half a month, incorporating days of extreme volatility.
The multiplier 4 works well to avoid positions being stopped out prematurely on pullbacks.
When the trailing stoploss is hit, this is where you will want to consider taking profit.
What is the best timeframe to use the script?
We recommend the daily timeframe as this is where trend followers enter assets to maximise the potential of long-term trends.
The higher timeframes are where traders and investors take fewer positions and hold for longer time periods.
The trailing stoploss follows the price of the asset a distance away to give the trend structure enough space and time to develop.
A trend is ultimately a function of time. If you eliminate time, you eliminate the trend. If you eliminate the trend, you eliminate profit.
The Trailing Stoploss script is necessary for investors who appreciate that profit is accumulated by letting winning positions run and not taking profit too early.
What makes this script unique?
Exit management and knowing when to let go of an asset is one of the main struggles budding investors face. This script has been coded specifically for the daily timeframe to:
Create a trailing stoploss that is unique to the volatility of the asset.
Allow investors to stay in positions for the duration of the trend over many months.
To distinguish between a pullback and a market reversal, allowing for discretion.
This TSL script is designed to manage positions investors take in line with long-term market trends.
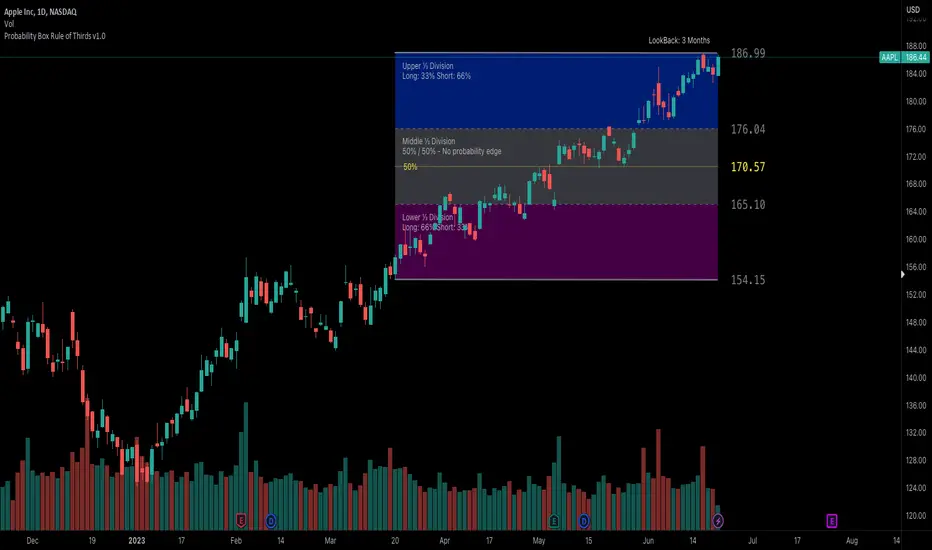
Probability Box Rule of Thirds [PPI]█ Probability Box Rule of Thirds
The Probability Box Rule of Thirds , is a visual indicator that helps traders identify possible overbought and oversold conditions. It does this by dividing the price range – highest high minus the lowest low of a given lookback period or date range – into thirds. Each third has distinct probability characteristics and when combined represent a probability box.
We have spent years refining the probability box concept, and have previously published a How To on Trading View – "How to Trade Probability Ranges – The Critical Rule of 1/3" which can be found here:
To quickly summarize the How To – when using the Rule of Thirds , you are using a combination of statistics, probabilities of success, and prior price action to determine when to enter a trade. The visual range division helps remove subjectivity and clearly shows when the trading odds are stacked in your favor. By identifying and taking higher probability trades, you have a higher chance of success as trading is all about probability and risk management.
Implementing the Rule of Thirds starts with finding an instrument that is consolidating and identifying the nearest important support and resistance levels based on your targeted trading timeframe or lookback period.
The range between the support and resistance levels is divided into thirds to form three zones within the consolidation range.
When going LONG , you want to BUY in the bottom third of the range. Once you buy, your objective is to hold during the middle third and sell when the price enters the top third.
When you buy in the lower third, there's a 66.6% probability of success. If you buy in the middle third, you only have a 50% / 50% chance of success. Going long in the top third of the range gives you a 33.3% chance of success as you are already close to the identified resistance level.
When going SHORT , the sequence and odds are reversed. You want to SELL in the top third of the range, hold the middle third and exit in the bottom third of the range. This gives you a 66.6% chance of success when entering in the top third, a 50% / 50% chance when entering in the middle third, and a 33.3% chance in the bottom third given you are already close to the identified support level.
When the price lies in the middle third, the even 50% / 50% odds provide no probability edge and a trader is better off waiting until the price reaches the upper or lower thirds of the price range.
The Rule of Thirds allows us to quickly visually evaluate trades based on probabilities, selectively enter trades that have the highest odds of success, and avoid likely losing trades. The Rule of Thirds gives you confidence to hold trades based on prior trading ranges and provides clear levels where the prices are likely to either reverse or start trending.
The Probability Box Rule of Thirds automatically implements the first two steps of the Rule of Thirds by using the highest high and lowest low of a given lookback period to identify the support and resistance levels, and automatically divides the range into thirds. The rest of the Rule of Thirds rules remain the same.
Just having the price within the bottom thirds or top thirds, however, does not mean the price will immediately reverse. The GE chart below is an example of a stock that remained 'stuck' in the upper thirds of the price range for an extended amount of time:
And the CVS chart below is an example where the price is 'stuck' in the lower thirds of the price range:
While the price is in the upper or lower thirds, it is very important that the trader should use other indicators to identify when a significant trend reversal occurs. Once a trend reversal event happens, the trader either enters a trade AND/OR exits a trade if already in one.
When the price exceeds the bounds of the probability box, there are three possible outcomes – a strong continuation trend, the price consolidates around the probability box edge, or a trend reversal. Your favorite indicators will help determine which event is happening.
The CVS chart above is a good example of the probability box being exceeded with the last bar. The price exceeding the price range is temporary event as the price range will expand to encompass the revised price range on the next trading day.
█ Indicator Features
Each supported timeframe – Monthly, Weekly, and Daily – allows the selection of an appropriate lookback period for your trading style. The defaults are a good starting point for swing trading and long-term investing. You many need to experiment to find the optimal lookback period for your trading style.
Even if you only day trade, the Probability Box Rule of Thirds with the appropriate lookback periods can help you visualize the bigger picture of where the instrument is heading.
When viewing the charts, you can find the currently selected lookback period above the upper edge of the price range.
The indicator will display a dotted yellow line at 50% of the price range and show the line's value when requested.
The visibility of the actual thirds and border price values are controlled by the " Show Probability Box Values " checkbox. You may need to expand the chart's right margin to see the values.
The " Show Internal Labels " checkbox controls the display of the internal ⅓ Division labels and the percentage odds, along with the 50% label. This option by default is set to off.
The " Show Error Messages " checkbox controls the display of error messages and by default is turned on. Turn off to prevent error messages from being shown on intraday timeframes. Save as indicator default to prevent having to turn off this setting each time added to chart.
The color and transparency controls allow the user to modify the colors used for each third. The default settings are optimized for use with a DARK background.
█ Implementation Notes
IMPORTANT - the Probability Box Rule of Thirds is set up to only handle Monthly, Weekly and Daily charts. This is intentional as the indicator is designed to be used for safer multiple day and longer swing trades. When viewed on intraday charts, the indicator will be hidden.
The Probability Box Rule of Thirds uses a rolling window of the equivalent number of bars for the lookback period rather than relying on the bar starting and ending dates. This allows the use of a standard number of days in the selected lookback window across various instruments and ensures fast, efficient calculations.
The lookback periods are adjusted when non-standard timeframe multipliers are used – e.g., a 12M chart timeframe and a 3-year lookback period will result in a 3 bar lookback. Fractional bars in this calculation are rounded up and any incompatible lookback period and chart timeframe combination will generate a runtime error.
In summary, the Probability Box Rule of Thirds automates and visually identifies overbought and oversold areas, which combined with the Rule of Thirds probability risk profiles, increases your odds of success through better trade selections and higher confidence in your trades.
█ Disclaimer
There is substantial risk in trading. Losses incurred in trading can be significant. Only trade with money you can afford to lose. We make no claims whatsoever regarding the impact of past or future performance on your trading results.
RSI of Zero Lag MA (ValueRay)The RSI of a Zero Lag Moving Average a powerful tool for for reliable exit signals.
The Relative Strength Index (RSI) is a widely recognized momentum oscillator that measures the speed and change of price movements. It provides valuable insights into overbought and oversold conditions, enabling traders to identify potential reversal points and take advantage of market inefficiencies.
The RSI of a Zero Lag Indicator takes this concept a step further by incorporating the Zero Lag Moving Average. The Zero Lag Moving Average is a cutting-edge indicator that minimizes lag and provides a smoother representation of price action, allowing for quicker and more precise responses to market movements.
By combining the RSI with the Zero Lag Moving Average, this indicator offers traders a superior exit strategy. When the RSI reaches extreme levels of overbought or oversold conditions, it indicates a potential reversal in the market. The Zero Lag Moving Average further enhances this signal by reducing delays and providing timely exit points.
Moreover, the RSI of a Zero Lag Indicator is not limited to mean reversion strategies. While it excels in identifying mean reversion opportunities, it can also be used in conjunction with other trading approaches. Traders can take advantage of its objective signals to exit trades profitably, regardless of their chosen strategy.
With its ability to accurately pinpoint overbought and oversold conditions, the RSI of a Zero Lag Indicator offers traders a competitive edge in the market. By providing timely exit signals and minimizing lag, it helps traders optimize their trading decisions and increase their chances of success.

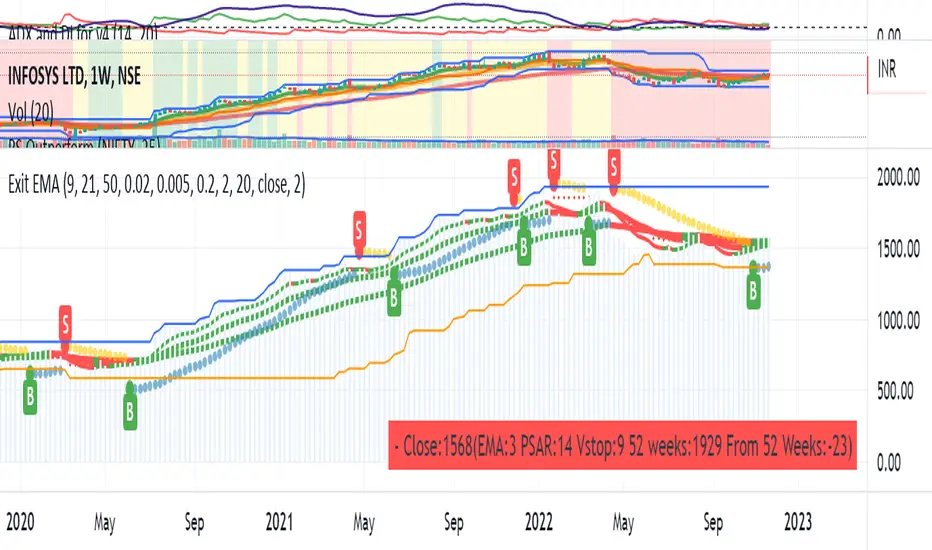
Consolidated IndicatorI have attempted to combine all the parameters to decide on the entry and exit points for stocks. The indicator combines
1) EMAs
2)PSAR
3)ATR
The script also attempts to show the risk-reward
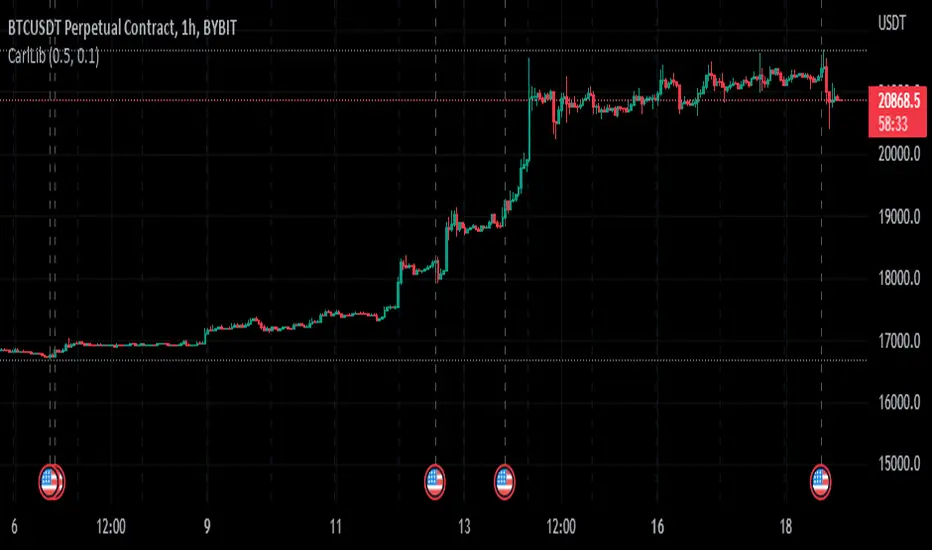
CarlLibLibrary "CarlLib"
LastLowRedHighGreen(open, close, high, close, reqChangePerc) returns values representing the high of the most recent green and the low of the most recent red
Parameters:
open : open series
close : close series
high : high series
close : close series
reqChangePerc : the minimum require change percentage for the values to switch to new ones.
Returns:
DCA RSI Add funds exit simulatorThis script helps with planning on how to exit DCA deals that are in the negative.
The following deal information is required
- Current average position price
- Funds invested
- Required take profit
Additional indicator settings are
- The date/time on which to start the simulator
- Minimum deviation % to start adding funds
- Expected bounceback from when funds are added
The RSI trigger
Adding funds is triggered when the selected RSI settings yield a value that is at or beyond the selected threshold.
How it works
The amount of funds needed are calculated based on the supplied settings, such that the new average price matches the expected bounceback.
It will also show if the exit strategy has failed to hit the TP (this happens when the RSI threshold is hit again)
