Ranked Exchange Volume (REV)📊 Ranked Exchange Volume (REV) - Multi-Venue Volume Distribution Visualizer
## Stop Guessing Where the Real Volume Is. See It.
Most traders look at aggregate volume and miss the critical story: **where** that volume actually traded. Ranked Exchange Volume (REV) solves this by revealing the complete liquidity landscape across multiple trading venues in a single, elegant visualization.
This isn't just another volume indicator—it's a **dynamic stratified histogram** that automatically reorganizes exchange layers by magnitude on every bar, showing you **instant market dominance** at a glance.
---
## 🎯 The Core Innovation: Self-Organizing Volume Layers
REV displays volume from up to 10 different exchanges as **stacked, color-coded bars** where the largest volume source literally rises to the top. Watch as exchanges compete for dominance in real-time:
- **Largest volume = Top of the bar** (most visible position)
- **Smallest volume = Bottom of the bar** (foundation layer)
- **Everything in between = Automatically sorted on every candle**
This visual hierarchy makes it instantly obvious which venues are leading the market—no mental math required.
---
## ✨ Key Features
### 🔄 **Dynamic Layer Sorting**
Unlike static stacked charts, REV uses real-time stratification. If Binance had 60% of volume last bar but Coinbase takes 70% this bar, you'll see Coinbase jump to the top. The hierarchy reflects current reality, not a fixed order.
### 🎨 **10 Fully Customizable Exchange Slots**
Each exchange slot offers complete control:
- **Enable/Disable toggle** - Turn exchanges on/off without losing your configuration
- **Custom prefix** - Track ANY exchange on TradingView (BINANCE, KRAKEN, OANDA, FXCM, etc.)
- **Custom suffix** - Specify quote currency (USDT, USD, EUR, or leave blank for stocks/forex)
- **Display name** - Control how exchanges appear in the rankings table
- **Color selection** - Match your chart theme or use brand colors for instant recognition
### 📊 **Live Rankings Table**
A real-time leaderboard shows:
- **Rank** - Current position (1 = highest volume)
- **Exchange name** - With color-coded background
- **Volume** - Intelligently formatted with K/M/B units
- **Percentage** - Exact market share
**Table positioning:** Choose from 9 screen positions (top/middle/bottom × left/center/right) to keep your chart clean.
### 🧮 **Intelligent Volume Formatting**
REV automatically detects volume magnitude and applies the appropriate scale:
- **Billions** - Displays as "1.5B" for readability
- **Millions** - Displays as "342.8M"
- **Thousands** - Displays as "45.2K"
- **Full numbers option** - Toggle to see complete values (23,456,789)
The scale adjusts per-bar, so you always see the clearest representation.
### 🚨 **Three Built-In Alert Conditions**
1. **Exchange Dominance Alert (>50%)**
- Triggers when a single venue controls majority of volume
- Signals potential liquidity concentration risk or exchange-specific events
2. **Volume Spike Alert (>2x average)**
- Detects unusual aggregate activity across all venues
- Catches breakouts, news events, or institutional flow
3. **Liquidity Migration Alert**
- Fires when market leadership shifts between exchanges
- Reveals arbitrage opportunities or changing market structure
### 📈 **Optional Total Volume Line**
Display aggregate volume from all exchanges as a reference overlay with customizable color.
---
## 🌍 Market Compatibility: Beyond Crypto
While optimized for cryptocurrency (its primary design), REV works across multiple asset classes:
### ✅ **Cryptocurrency (Perfect Fit)**
**Why it excels:** Crypto trades 24/7 across dozens of global exchanges simultaneously. REV reveals true price discovery.
**Example configurations:**
- **BTC/USDT:** Compare Binance, Coinbase, OKX, Bybit, Kraken, Bitget
- **ETH/USD:** Track institutional venues (Coinbase, Kraken, Gemini) vs retail (Binance, Gate.io)
- **Altcoins:** Identify which exchanges have the deepest liquidity before placing large orders
**Trading applications:**
- **Arbitrage detection** - Spot when volume migrates between venues (price differential opportunities)
- **Exchange risk** - Don't trade on exchanges with suspiciously low volume
- **Whale tracking** - Sudden Coinbase dominance often signals institutional activity
- **Market maker identification** - Consistent Binance leadership suggests MM concentration
### ✅ **Forex (Excellent Fit)**
**Why it works:** Forex doesn't have centralized exchanges—it trades OTC across multiple broker feeds. REV shows which data providers are seeing the action.
**Example configurations:**
- **EUR/USD:** Compare OANDA, FXCM, FOREX.COM, FX_IDC, CAPITALCOM
- **GBP/JPY:** Track volatility across broker feeds
- **Exotics:** Verify liquidity before trading thin pairs
**Setup notes:**
- Leave **suffix field blank** for forex
- Use broker prefixes: OANDA, FXCM, FOREXCOM, FX_IDC, SAXO
- Symbol constructs as "OANDA:EURUSD"
**Trading applications:**
- **Spread verification** - Higher volume feeds typically offer tighter spreads
- **News event tracking** - See which brokers capture the most flow during announcements
- **Session analysis** - Watch London/NY volume shifts across different providers
### ⚠️ **Stocks (Limited But Useful)**
**Where it works:**
- **Dual-listed stocks** - Canadian companies on TSX and NYSE
- **International ADRs** - Same company, different exchanges
- **ETF arbitrage** - Compare volume across regional listings
**Example configurations:**
- **Shopify (SHOP):** Compare TSX vs NYSE volume
- **Alibaba (BABA):** NYSE vs HKEX volume
- **European stocks:** Compare primary exchange vs secondary listings
**Setup notes:**
- Leave **suffix field blank**
- Use exchange prefixes: NYSE, NASDAQ, TSX, LSE, XETRA
- Note: TradingView doesn't show per-venue volume for U.S. equities (NYSE vs BATS vs ARCA all aggregate)
**Limitations:** Most stocks trade primarily on one exchange, so REV is less valuable than in crypto/forex.
### ❌ **Futures (Not Recommended)**
Futures contracts differ by exchange (CME's ES ≠ EUREX's FESX), so volume isn't comparable.
---
## 📚 Practical Use Cases
### 1. **Pre-Trade Liquidity Analysis**
Before entering a large position, check which exchanges have sufficient volume to fill your order without slippage.
**Example:** You want to sell 50 BTC. REV shows Binance has 2,340 BTC volume this hour while a smaller exchange has only 87 BTC. Route your order to Binance for better execution.
### 2. **Exchange Risk Management**
Identify "fake volume" or wash trading by comparing venues.
**Red flag pattern:** An exchange consistently shows 10x the volume of competitors but with minimal price impact—likely artificial.
### 3. **Arbitrage Opportunity Detection**
When volume suddenly concentrates on one exchange, price premiums/discounts often appear.
**Alert pattern:** Liquidity Migration alert fires → Check price differences → Execute arb if spread exceeds fees.
### 4. **Institutional Flow Tracking**
In crypto, institutions typically use regulated exchanges (Coinbase, Kraken, Gemini).
**Pattern to watch:** Coinbase volume spikes to 60%+ dominance → Often precedes directional moves as institutions position.
### 5. **Market Structure Analysis**
Watch long-term trends in exchange dominance to understand market evolution.
**Example insight:** "Binance's market share has dropped from 70% to 45% over 6 months as traders diversify to OKX and Bybit."
### 6. **Event Response Comparison**
During major news events, see which exchanges react first.
**Analysis:** If one exchange shows volume spike 5 minutes before others, that feed may have faster news incorporation.
---
## ⚙️ Technical Specifications
- **Maximum exchanges:** 10 simultaneous venues
- **Sorting algorithm:** Bubble sort (O(n²) but optimal for n=10, prioritizes stability)
- **Update frequency:** Real-time, every bar
- **Data handling:** Gracefully ignores invalid symbols, treats NA as zero
- **Chart type:** Non-overlay (separate pane below price)
- **Performance:** Lightweight, no lag on any timeframe
---
## 🚀 Getting Started
### Quick Setup (5 Minutes)
**For Crypto Traders (Default Configuration):**
1. Add indicator to any crypto chart (BTC, ETH, SOL, etc.)
2. Works immediately—top 10 exchanges pre-configured
3. Customize colors if desired
4. Position table to your preference
**For Forex Traders:**
1. Open any forex pair (EUR/USD, GBP/JPY, etc.)
2. Go to Exchange 1 settings
3. Change prefix to "OANDA" (or your preferred broker)
4. **Clear the suffix field** (leave it blank)
5. Repeat for other exchanges (FXCM, FOREXCOM, FX_IDC, etc.)
6. Disable any unused exchange slots
**For Stock Traders (Dual-Listed):**
1. Open a dual-listed stock (e.g., SHOP on TSX)
2. Exchange 1: Prefix = "TSX", Suffix = blank, Name = "Toronto"
3. Exchange 2: Prefix = "NYSE", Suffix = blank, Name = "New York"
4. Disable exchanges 3-10
5. Compare volume distribution
### Advanced Customization
**Tracking Regional Markets:**
Want to compare Korean vs Japanese crypto exchanges?
- Exchange 1: UPBIT (Korean)
- Exchange 2: BITHUMB (Korean)
- Exchange 3: BITFLYER (Japanese)
- Exchange 4: COINCHECK (Japanese)
**Isolating Institutional Volume:**
Focus only on regulated U.S. exchanges:
- Enable: Coinbase, Kraken, Gemini
- Disable: All others
- Watch for >50% dominance alerts
---
## 👥 Who Is This For?
### ✅ **Perfect for:**
- **Crypto day traders** - Need to know where liquidity actually is
- **Arbitrage traders** - Spot cross-exchange inefficiencies
- **Institutional traders** - Validate execution venues before large orders
- **Forex scalpers** - Compare broker feeds for best execution
- **Market structure analysts** - Track long-term exchange dominance trends
### ❌ **Less useful for:**
- **Long-term investors** who don't care about short-term liquidity
- **Single-exchange traders** who never compare venues
- **Futures traders** (contracts differ by exchange)
---
## 🎓 Understanding the Visualization
**What each colored segment means:**
Each horizontal stripe represents one exchange's volume contribution. The **height** of each stripe shows that exchange's volume relative to others.
**Reading the pattern:**
- **Dominant top layer** (50%+ of bar) = Clear market leader
- **Evenly distributed layers** (10-15% each) = Fragmented liquidity
- **Sudden layer reorganization** = Liquidity migration event
- **Shrinking bottom layers** = Exchanges losing market share
**Color coding strategy:**
The indicator defaults to exchange brand colors for instant recognition:
- Yellow = Binance (their signature gold)
- Blue = Coinbase (their brand blue)
- Purple = Kraken (their brand purple)
- etc.
You can customize all colors to match your chart theme.
---
## 🔧 Configuration Tips
### **Best Practices:**
1. **Start with defaults** - Test on BTC/USDT to understand behavior
2. **Disable unused exchanges** - Cleaner visualization, faster computation
3. **Match your trading venues** - Only track exchanges you actually use
4. **Use brand colors initially** - Helps build visual pattern recognition
5. **Enable alerts strategically** - Don't spam yourself; focus on actionable signals
### **Common Mistakes to Avoid:**
❌ Tracking too many irrelevant exchanges (creates visual noise)
❌ Forgetting to clear suffix for forex/stocks (symbol won't construct properly)
❌ Using the same color for multiple exchanges (defeats instant recognition)
❌ Hiding the table permanently (you lose the percentage data)
---
## 📊 Performance Notes
- **Lightweight computation** - No impact on chart performance
- **Works on all timeframes** - 1-minute to monthly
- **Historical analysis** - Full bar history available (max_bars_back=5000)
- **Multi-monitor friendly** - Table positioning adapts to any screen layout
---
## 🆕 Future Enhancements (Planned)
While the current version is feature-complete, potential additions include:
- Volume-weighted average price (VWAP) overlay per exchange
- Historical dominance charts (which exchange led most this week/month)
- Correlation matrix (do exchanges move together or independently?)
**User feedback shapes development** - Comment with your requests!
---
## 💡 Pro Tips
### **Tip 1: The "Whale Exchange" Filter**
In crypto, institutions use Coinbase/Kraken. Enable ONLY these two exchanges to isolate professional flow and ignore retail noise.
### **Tip 2: The "Arbitrage Scanner"**
Set Liquidity Migration alert on 1-minute timeframe. When it fires, check price across exchanges—often there's a temporary premium/discount.
### **Tip 3: The "Liquidity Gauge"**
Before placing a large market order, switch to 5-minute timeframe and check last 10 bars. If your target exchange consistently has <20% of volume, you'll face slippage.
### **Tip 4: The "Market Structure Tracker"**
Take screenshots of the table weekly. Over time, you'll see exchange market share trends that reveal fundamental shifts in trader preferences.
### **Tip 5: The "News Event Validator"**
During major announcements (Fed decisions, earnings, etc.), watch which exchange shows volume first. That's where informed traders are positioned.
---
## 🎯 Summary
**Ranked Exchange Volume (REV) transforms volume analysis from a single number into a complete market microstructure view.**
Instead of seeing "1.2M volume," you see:
- Binance: 640K (53%)
- Coinbase: 280K (23%)
- OKX: 180K (15%)
- Bybit: 100K (9%)
**That's actionable intelligence.**
Whether you're executing a large crypto trade, arbitraging forex across brokers, or validating liquidity before buying a dual-listed stock, REV shows you **where the market actually is**—not where you assume it is.
---
## 📖 Quick Reference Card
| Feature | What It Does | Why It Matters |
|---------|-------------|----------------|
| **Dynamic Sorting** | Largest volume rises to top | Instant dominance identification |
| **10 Custom Slots** | Track any exchanges | Works for YOUR trading venues |
| **Live Rankings** | Real-time leaderboard | Precise market share data |
| **Smart Formatting** | Auto K/M/B scaling | Always readable, never cluttered |
| **Dominance Alert** | Warns at >50% concentration | Risk management for large orders |
| **Migration Alert** | Fires on leadership change | Arbitrage opportunity signal |
| **Spike Alert** | Detects 2x volume surges | Breakout/news confirmation |
| **Total Line** | Shows aggregate volume | Reference for overall activity |
| **Table Positioning** | 9 screen locations | Adapts to your layout |
| **Full/Short Toggle** | Complete vs abbreviated numbers | Flexibility for different assets |
---
## ✅ Installation & Support
**Install:** Add to your TradingView favorites, apply to any chart
**Updates:** Automatic through TradingView
**Support:** Comment with questions—active developer community
**Like this indicator?** Leave a ⭐ rating and share with fellow traders who need better volume intelligence.
---
**🚀 Start seeing the complete volume picture. Add Ranked Exchange Volume to your charts today.**
Exchange

ATR or % Based Trailing Stop for Delta Exchange (trade_crush)This indicator calculates and visually displays a dynamic trailing stop line on the chart based on either the Average True Range (ATR) or a fixed percentage of the current close price. Designed especially for futures or crypto traders using Delta Exchange, it helps determine where to place trailing stop loss orders to manage risk effectively.

EMA + RSI Autotrade Webhook - VarunOverview
The EMA + RSI Autotrade Webhook is a powerful trend-following indicator designed for automated crypto futures trading. This indicator combines the reliability of Exponential Moving Average (EMA) crossovers with RSI momentum filtering to generate high-probability buy and sell signals optimized for webhook integration with crypto exchanges like Delta Exchange, Binance Futures, and Bybit.Key Features
Simple & Effective: Uses proven EMA 9/21 crossover strategy
RSI Momentum Filter: Eliminates low-probability trades in ranging markets
Webhook Ready: Two clean alerts (LONG Entry, SHORT Entry) for seamless automation
Exchange Compatible: Works with Delta Exchange, 3Commas, Alertatron, and other webhook platforms
Zero Lag Signals: Real-time alerts on crossover confirmation
Visual Clarity: Clean chart markers for easy signal identification
How It Works
Entry Signals:
LONG Entry: Triggers when EMA 9 crosses above EMA 21 AND RSI is above 52 (bullish momentum confirmed)
SHORT Entry: Triggers when EMA 9 crosses under EMA 21 AND RSI is below 48 (bearish momentum confirmed)
Technical Components:
Fast EMA: 9-period (tracks short-term price action)
Slow EMA: 21-period (identifies primary trend)
RSI: 14-period (confirms momentum strength)
RSI Long Threshold: 52 (filters weak bullish signals)
RSI Short Threshold: 48 (filters weak bearish signals)
Best Use Cases
Crypto Futures Trading: Bitcoin, Ethereum, Altcoin perpetual contracts
Automated Trading Bots: Integration with Delta Exchange webhooks, TradingView alerts
Timeframes: Optimized for 15-minute charts (works on 5min-1H)
Markets: Trending crypto markets with clear directional moves
Risk Management: Best used with 1-2% stop loss per trade (managed externally)
Webhook Automation Setup
Add indicator to your TradingView chart
Create alerts for "LONG Entry" and "SHORT Entry"
Configure webhook URL from your exchange (Delta Exchange, Binance, etc.)
Use alert message: Entry LONG {{ticker}} @ {{close}} or Entry SHORT {{ticker}} @ {{close}}
Exchange automatically reverses positions on opposite signals
Advantages
✅ No manual trading required - fully automated
✅ Eliminates emotional trading decisions
✅ Catches trending moves early with EMA crossovers
✅ RSI filter reduces whipsaws in choppy markets
✅ Works 24/7 without monitoring
✅ Simple two-alert system (easy to manage)
✅ Compatible with multiple exchanges via webhooksStrategy Philosophy
This indicator follows a trend-following with momentum confirmation approach. By waiting for both EMA crossover AND RSI confirmation, it ensures you're entering trades with genuine momentum behind them, not just random price noise. The tight RSI thresholds (52/48) keep you aligned with the prevailing trend.Recommended Settings
Timeframe: 15-minute (primary), 5-minute (scalping), 1-hour (swing)
Markets: BTC/USDT, ETH/USDT, high-liquidity altcoin perpetuals
Position Sizing: 100% capital per signal (exchange manages reversals)
Stop Loss: 2% (managed via exchange or external bot)
Leverage: 1-2x for conservative approach, up to 5x for aggressive
Important Notes
⚠️ This indicator generates entry signals only - position reversals are handled automatically by your exchange
⚠️ Always backtest on historical data before live trading
⚠️ Use proper risk management and position sizing
⚠️ Best performance in trending markets; may generate false signals in tight ranges
⚠️ Requires TradingView Premium or higher for webhook functionalityTags
cryptocurrency futures automated-trading ema-crossover rsi webhook delta-exchange tradingview-alerts trend-following momentum bitcoin ethereum crypto-bot algo-trading 15-minute-strategy

Aggregated Open Interest Multi-Exchange (USD)This indicator aggregates Open Interest (OI) data from multiple major cryptocurrency exchanges into a single unified view in USD, using data available on TradingView. It automatically adapts to the asset you're viewing on the chart.
Features:
Aggregates OI from 7 major exchanges: Binance, Bybit, OKX, Bitget, Deribit, HTX, and Coinbase
All values converted to USD - unlike native OI which shows contracts/coins
Uses only data available on TradingView platform
Automatically detects the asset from your chart (BTC, ETH, SOL, etc.)
True apples-to-apples comparison across exchanges
Displays as candlesticks showing OI open, high, low, and close
Toggle exchanges on/off individually
Handles different contract types per exchange automatically
Why USD conversion matters:
Traditional OI indicators show values in contracts or crypto units, making it difficult to compare across exchanges. This indicator converts everything to USD, giving you the real dollar value of open positions across all exchanges.
How it works:
Simply add the indicator to any crypto perpetual futures chart. It will automatically fetch and aggregate OI data from all supported exchanges for that asset using TradingView's built-in data feeds, converting everything to USD.
Supported Exchanges:
Binance, Bybit, Bitget, HTX: USDT perpetuals
Deribit: BTC/ETH use USD contracts, others use USDC
OKX: Contract-based (automatically converted)
Coinbase: USDC perpetuals
Perfect for traders who want a comprehensive view of total market Open Interest in USD across exchanges using reliable TradingView data.

STOCK EXCHANGE + SILVER BULLET FRAMESThis script is an updated version of the " NY/LDN/TOK Stock Exchange Opening Hours " script.
Objective
Displays global stock exchange sessions (New York, London, Tokyo) with session frames, highs/lows, and opening lines. Includes ICT Silver Bullet windows (NY, London, Tokyo) with configurable shading. Past sessions are frozen at close, ongoing sessions update dynamically until closure, and upcoming sessions are pre-drawn. Fully customizable with options for weekends, labels, padding, opacity, and individual session toggles.
It is designed to help traders quickly interpret market context, liquidity zones, and session-based price behavior.
Main Features
Past sessions (historical data)
• Session Frames:
• Each box is frozen at the session’s close.
• The left edge aligns with the opening time, while the right edge is fixed at the closing time.
• The top and bottom reflect the highest and lowest prices during the session.
• Session Labels:
• Names (NY, LDN, TOK) displayed above the frame, aligned left, in the same color as the frame.
• Opening Lines:
• Vertical dotted lines mark the start of each session.
Ongoing and upcoming sessions (live market)
• Dynamic Session Frames:
• The right edge is locked at the future close time.
• The top and bottom update in real time as new highs and lows form.
• Labels and Lines:
• The session label is visible above the active frame.
• Opening lines are drawn as soon as the session begins.
Silver Bullet Time Windows (ICT concept)
• Highlights key liquidity windows within sessions:
• New York: 10:00–11:00 and 14:00–15:00
• London: 08:00–09:00
• Tokyo: 09:00–10:00
• Silver Bullet zones are shaded with configurable opacity (default 5%).
Customization and Options
• Enable or disable individual sessions (NY, London, Tokyo).
• Toggle weekend display (frames and Silver Bullets).
• Adjust label size, padding, and text visibility.
• Control frame opacity (default 0%).
• Optimized memory management with automatic pruning of old graphical objects.

Exchange PrefixAllows users to show the exchange name of your currently-viewed ticker on the latest bars.
For example, viewing BTCUSDT on BINANCE would provide "BINANCE".
Similarly, viewing BTCUSDT on CRYPTO.COM would provide "CRYPTOCOM".
What is the purpose of this?
- Sometimes pine script coders would like to know the exact names of the exchanges. This script does the job.

Open Interest All ExchangesThe indicator collects data from available exchanges based on open interest. The indicators are calculated in the amount of Bitcoin.
Below are the tickers of the exchanges that provide the data:
- BITFINEX:BTCUSD
- BITFINEX:BTCUST
- KRAKEN:BTCUSDPERP
- BITMEX:XBTUSD
- BITMEX:XBTUSDT
- BINANCE:BTCUSDTPERP
- BINANCE:BTCUSDPERP (due to low volumes and limitations of 40 requests of the request.security function, the code contains data without using the calculation)
For me, Open Interest indicators play an important role in the trading system, for this reason I share with you. I am not a financial advisor.
**Open for cooperation**
.b BTC-Exchange volumeBINANCE:BTCUSDT
It's tool to check exchange trading status.
You can see "BTC-exchange's realtime trading volume, previous closed volume" at once.
You can switch to see 'Previous close volume' on script's panel.
Timeframe recommended ; 15m, 1H, 4H, D, W, whatever.
Each exchange may have a different volume display unit, so I converted it into roughly BTC units. (using hl2 price)
This indicator aims to recognize the difference in the trading volume of the exchange at once.
It's not for the purpose of check the exact trading volume.
All data come from tradingview.
The comparison target exchanges refer to the ranking of CoinMarketCap.
if you have any questions freely contact to me by message on tradingview, or telegram @sr_bt
but please understand that responses may be quite late.

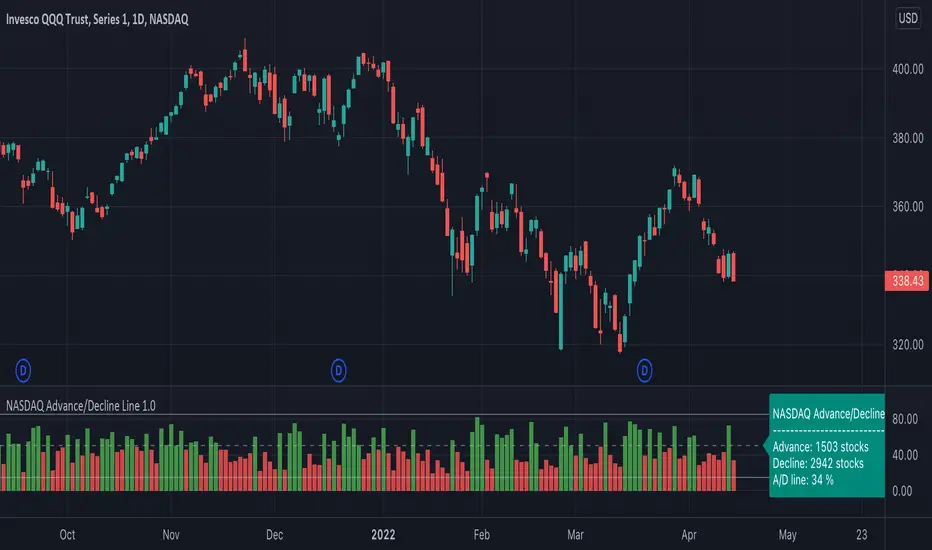
NASDAQ Advance/Decline Line 1.0NASDAQ Advance/Decline Line is a Market Breath indicator.
Brought to you by IQ-trading (Andrei Bogdan) via Trading View Pine script. If you find this helpful in anyway, please leave a like!
A/D line calculates a ratio between total number of NASDAQ stocks advancing and total number of NASDAQ stocks in one day, providing another way to grasp the market breath at any moment.A
Green columns mean more than 50% of NASDAQ stocks are advancing, red columns mean more than 50% of NASDAQ stocks are declining.
Green values above the top band mean correlation to the upside, red values bellow the low band mean correlation to the downside.
Correlation means rising probability of capitulation (to the upside or to the downside).
For a better interpretation, NASDAQ Advance/Decline Line should be used in conjunction with other indicators (volatility, volume, etc.).
--------------------
NASDAQ here refers to the totality of assets listed on the NASDAQ exchange, not to the Nasdaq Composite index or the Nasdaq100 index.
NASDAQ is the second-largest stock exchange on earth, and operates the two major stock indexes based on companies that trade on its exchange: the Nasdaq Composite and the Nasdaq 100.
The Nasdaq Composite tracks the performance of more than 3,000 stocks listed on the Nasdaq while the Nasdaq 100 captures the performance of the exchange’s largest non-financial companies.
Exchange Down / Up Volume RatioI attended some workshop yesterday and I noticed that one of the presenters had an indicator titled 'price ratio' and had DVOL and UVOL as the inputs.
From some deduction, I see that it was basically looking at the ratio of down by up volume on the NYSE exchange; he had a few levels marked as well (which I've also marked on this indicator).
Seems like an interesting metric to consider, basically used to get a rough idea of the short term sentiment of the masses; allowing one to see when selling is outpacing buying in pure volume traded on an exchange.
I've added a few other exchanges to allow for quick switch between the majors with this info readily available on TradingView.
Supported inputs are: AMEX, NYSE, NASDAQ, ALL (must be in caps)
All is the sum of the NYSE, AMEX, and NASDAQ exchange volume.
The standard trading view disclaimer applies to this post -- please consult your own investment advisor before making investment decisions. This post is for observation only and has no warranty etc. www.tradingview.com
Best,
JM

EMA Multi Currency RadarA simple indicator that illustrates where close price is in comparison to an MA. Just click the configure box and type in the EMA you want to monitor. The default is the 8 EMA .
To read the indictor:
- Green Line - Close price is above the EMA
- Red Line - Close price is below the EMA .
If you wish to have this indicator customised, please do not hesitate to contact me.
Volume ValueInstead of the Volume this plots the closure price times volume, hence the Value.
Useful in study of long term phenomenons.
Crypto Multi Exchange Volume (CMEV)Crypto Multi Exchange Volume (CMEV) aggregates and plots trading volumes for supported cryptoasset pairs over multiple different cryptoasset exchanges. For developers looking for more information and for those who want to compile their own version of CMEV, please check out my GitHub (jakobpredin/crypto-multi-exchange-volume).
Configuration
CMEV comes with two configurable settings - whether base volume or quote volume is plotted and the length of the volume's EMA. By default, the base volume is used for plotting and the length of the EMA is set to 12 periods.
Use cases
The indicator was primarily developed in order to be able to chart using the trading pair with the longest available trading history. Due to the fast-changing preferences of where cryptoassets are traded, volumes tend to be very inconsistent and can give a distorted picture of a pairs history. For illustration, check out the SC-BTC pair from Poloniex using their native volume and compare it to the CMEV volume.
The other use case is to be able to spot divergences in volume. A great example here is bitcoin's 2019 rally where volumes from derivatives exchanges are at all time highs but volumes from retail/spot exchanges are not.
Supported exchanges
CMEV currently supports asset pairs from the following exchanges:
Binance
Bitfinex
Bitstamp
Bittrex
Coinbase
Gemini
Kraken
Poloniex
Limitations
Because of the fact that CMEV is pulling data from from multiple different exchanges and is computationally intensive it can take a couple of seconds to load while charting certain cryptoasset pairs.
Additionally, due to Tradingview's various limitations only a certain number of pairs can be supported at a time. By default, only pairs with a BTC or USD quote are supported and many non-unique pairs with consistently low trading volumes have been removed. For a full explanation, please refer to the docs in my GitHub (jakobpredin/crypto-multi-exchange-volume).
Future of the project
I plan on supporting pairs from more exchanges in the future as I see fit and as they become available for charting on Tradingview. Further, I may develop a strategy script using CMEV as its core indicator.
I welcome everybody from the community to help me extend the functionality of CMEV in order to make investing in cryptoassets more transparent for everybody.

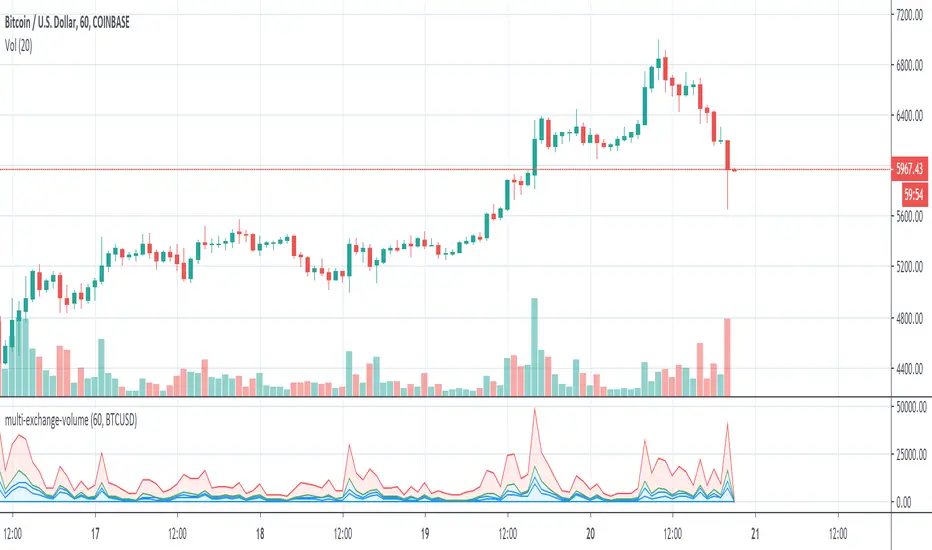
Multi-Exchange-VolumeHere you can easily see the volume on many large crypto exchanges , you can change the coin by entering the ticker id but be aware that not all exchanges list the same coins and some have different ticker names.
Known to work:
BTCUSD
ETHUSD
LTCUSD
XRPUSD
Volume ExternalShows the volume of a specified exchange and pair. They should be entered in the format EXCHANGE:PAIR, e.g. BINANCE:ETHUSDT.
You can add multiple indicators of this to do volume analysis of multiple pairs on the same chart.

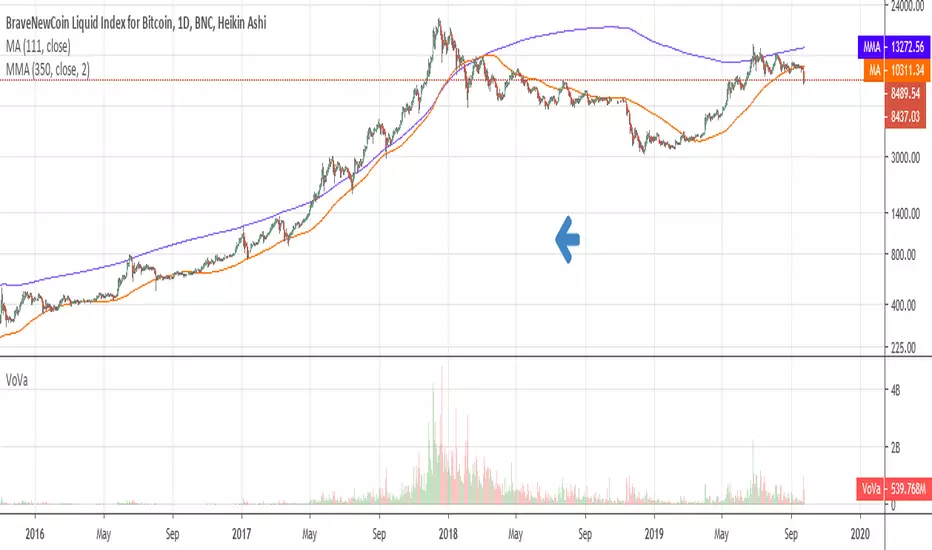
BTC World Volume (Multi-Exchange)Release: 2018-03-29
__________________________
WHAT IT DOES
Bitcoin is listed on multiple exchanges. Many people have called for a single global index that would quote BTC volume across all exchanges: this script is such a virtual volume aggregate of the 17 largest fiat exchanges on TradingView (listed in the script comments, and in Format > Inputs for you to select). It includes USD, EUR, JPY, KRW and USDT sources.
It will, independently for each tick, quote the volume from all selected exchanges and display a stacked representation, freely inspired from CoinMarketCap charts; also a Moving Average. Each fiat/continent has its own general color, to be able to quickly glance at where volume is coming from, e.g. BitMEX or Asia. (colors are based on Google's Material Design).
By default:
Grey: BitMEX
Green: USD
Yellow: Tether (USDT)
Red: Asia (JPY, KRW)
Blue: Europe (EUR)
No more "on Coinbase this" or "on Bitstamp that", you've now got a global overview! It becomes easy to debunk a few common myths.
See CoinMarketCap for reference.
Note: Bitmex is not taken into account in CoinMarketCap (afaik) since it's trading a derivative asset (XBTUSD contracts), but it usually amounts to ~50% of the overall BTC volume in USD value. The 16 other exchanges quote their volume in BTC, and they represent 30~40% of the overall BTC volume. I believe the whole is good enough to smooth out exchanges variations, and get a fair representation of real-time activity.
__________________________
HOW TO USE IT
Just add it to your chart, it will appear as a separate indicator. By default, it appears as stacked colored "areas". There is also a total volume Histogram, which is transparent by default: you can tweak that in Format > Style.
The darker and lighter backgrounds are respectively indicative of a downward price candle (open > close), or an upward price candle (close > open). They are unrelated to volume and simply help interpreting the indicator.
You can check/uncheck exchanges in the Format > Inputs tab to remove/add some of them from computation. All are enabled by default.
You can check/uncheck exchanges in the Format > Style tab to hide them (usually you would hide all or none).
You can edit colors and transpareny as well for each exchange.
You can edit "Volume histogram" transparency to have it show (it's a simpler representation than areas).
Moving Average: You can select the type (SMA, EMA, DEMA or TEMA) and length.
__________________________
Please leave feedback below or pm me directly for bugs and suggestions.

BTC World Price: Multi-Exchange VWAPBTC World Price: Multi-Exchange VWAP
__________________________
WHAT IT DOES
What you see above are not Bitmex candles, but this indicator's.
Bitcoin is listed on multiple exchanges. Many people have called for a single global index that would quote BTC price and volume across all exchanges: this script is such a virtual aggregate (formerly: Multi-Listed , Volume-Weighted Average Price ).
It will, independently for each tick, for any time-frame:
- Quote the price (O, H, L, C) and volume from Bitfinex (USD), Binance (USDT), bitFlyer (Yen), Bithumb (S. Korean Won), Coinbase (USD), Kraken (EUR) and even Bitmex (USD Contracts).
- Weight each price with the corresponding volume of the exchange.
- Quote the FOREX conversion rate in USD for each currency (USDJPY etc.)
- Finally return global average price (candles) in USD.
- Additionally provide (H+L)/2 etc. values.
No more "on Coinbase this" or "on Bitstamp that", you've now got a global overview!
See CoinMarketCap: Markets for reference. I've included alternative exchanges in the comments at the top of the script.
__________________________
HOW TO USE IT
Basically just add it to your chart and use the indicator's candles instead of the chart's main ticker.
By default, BTC World Price will display candles only, but you can also display OHLC & averages (in whichever style you want).
You may indeed want to hide the main symbol (top-left corner, click the 'eye' button next to its name), or switch it to something else than candles/bars (e.g. line).
Make sure "Scale Price Chart Only" is disabled if you want to use the auto-zoom feature. (if other indicators are messing your zoom, you can try to select "Line with Breaks" or "Area with Breaks" to allow these to overflow from the main window)
By clicking the triangle next to the indicator's name, you can select "Visual Order" (e.g "Bring to Front").
You can select regular Candles or Heikin-Ashi in Options.
In the Format > Inputs tab, you can select which exchanges to quote. By default, all of them are enabled.
The script also exposes the following typical values to the backend, which you can use as Price Source for other indicators: (e.g. MA, RSI, in their "Format > Input" tab)
Open Price (grey)
High Price (green)
Low Price (red)
Close Price (white)
(H + L)/2 (light blue)
(H + L + C)/3 (blue)
(O + H + L + C)/4 (purple)
They are all hidden by default (by means of maximum transparency).
In the Format > Style tab, you can change their color, transparency and style (line, area, etc), as well as uncheck Candles and Wicks to hide these.
If you are using "Indicator Last Value" and want to clear the clutter from all these values, simply uncheck them in Style. They will still be available as Price Source for other indicators.
You can also choose to scale it to the left, right (default) or "screen" (no scaling).
Once you're satisfied with your Style, you may click "Default"> "Save as default" in the botton-left. Everytime you load the indicator, it will look the same. ("Reset Settings" will reset to the script's defaults)
__________________________
Please leave feedback below in comments or pm me directly for bugs and suggestions.

Simple Spread Simple spread between two tickers. Click format to set inputs for tickers. ex: "COINBASE:BTC:USD"

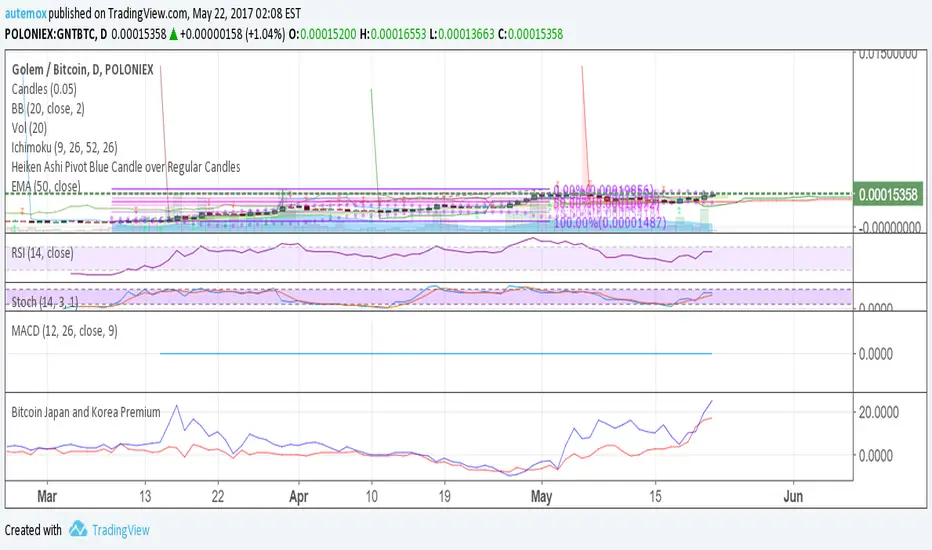
Bitcoin Japan and Korea PremiumRed line is the % premium to buy bitcoin in Japan. Blue is the % premium to buy bitcoin in korea.
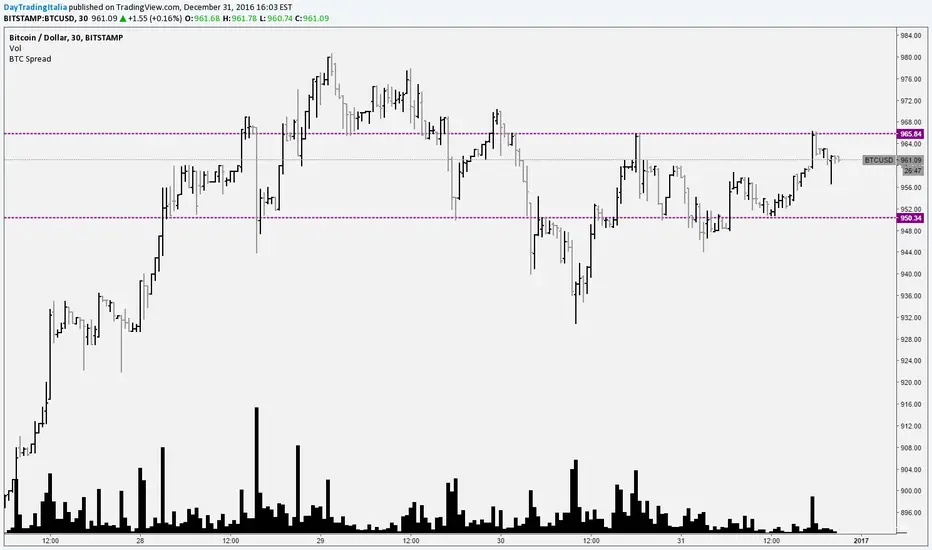
Bitcoin SpreadIt selects the min/max price for btc/usd from a set of exchanges and shows them on the chart. It is possible to add or remove exchanges by editing the source code
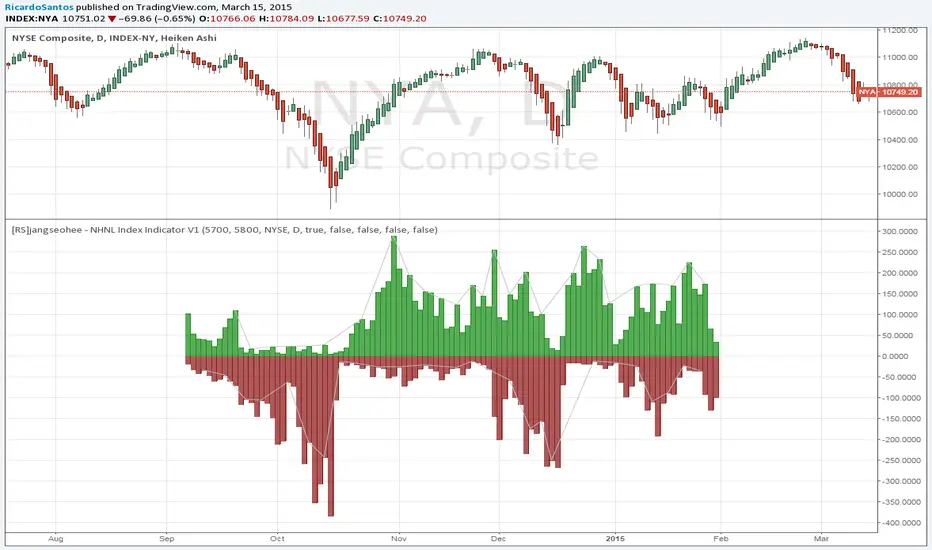
[RS]jangseohee - NHNL Index Indicator V1request for jangseohee: added option for different exchanges, added option to remove data before X point and after Y point in time using candle numbers.