Even vs Odd Days Performance█ OVERVIEW
The Even vs Odd Days Performance indicator is designed to visualise and compare the performance of even-numbered days versus odd-numbered days. This indicator explores one of the many calendar based anomalies that exist in financial markets.
In the context of financial analysis, a calendar based anomaly refers to patterns or tendencies that are linked to specific time periods, such as days of the week, weeks of the month, or months of the year. This indicator helps explore whether such a calendar based anomaly exists between even and odd days.
By calculating cumulative daily performance and counting the number of days with positive returns, it provides a clear snapshot of whether one set of days tends to outperform the other, potentially highlighting a calendar based anomaly if a significant difference is observed.
█ FEATURES
Customisable time window through input settings.
Tracks cumulative returns for even and odd days separately.
Easily adjust table settings like position and font size via input options.
Clear visual distinction between even and odd day performance using different colours.
Built-in error checks to ensure the indicator is applied to the correct timeframe.
█ HOW TO USE
Add the indicator to a chart with a Daily timeframe.
Choose your start and end dates in the Time Settings.
Enable or disable the performance table in the Table Settings as needed.
View the cumulative performance, with even days in green and odd days in red.
Even

Even vs Odd Weeks Performance█ OVERVIEW
The Even vs Odd Weeks Performance indicator is designed to visualise and compare the performance of even-numbered weeks versus odd-numbered weeks. This indicator explores one of the many calendar based anomalies that exist in financial markets.
In the context of financial analysis, a calendar based anomaly refers to patterns or tendencies that are linked to specific time periods, such as days of the week, weeks of the month, or months of the year. This indicator helps explore whether such a calendar based anomaly exists between even and odd weeks.
By calculating cumulative weekly performance and counting the number of weeks with positive returns, it provides a clear snapshot of whether one set of weeks tends to outperform the other, potentially highlighting a calendar based anomaly if a significant difference is observed.
█ FEATURES
Customisable time window through input settings.
Tracks cumulative returns for even and odd weeks separately.
Easily adjust table settings like position and font size via input options.
Clear visual distinction between even and odd week performance using different colours.
Built-in error checks to ensure the indicator is applied to the correct timeframe.
█ HOW TO USE
Add the indicator to a chart with a Weekly timeframe.
Choose your start and end dates in the Time Settings.
Enable or disable the performance table in the Table Settings as needed.
View the cumulative performance, with even weeks in green and odd weeks in red.

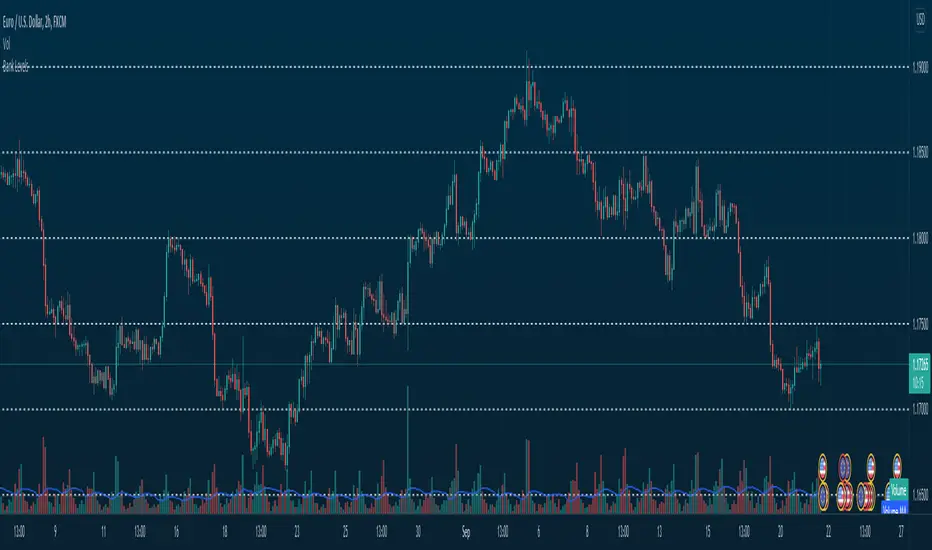
Bank Levels - Psychological Levels - Bitcoin, Indices, ForexThis got removed so I'm publishing it again.
What it is:
- This script draws in levels refereed to as bank levels. They are basically psychological/even numbers(40000, 45000, 150, 1850..)
Why doesn't it work on some charts?
- Each pair has a different tick value. You will have to edit the code to make it work on certain pairs. It's pretty simple, take a look.