Smart WhaleOverview The Smart Whale Breakout System is a pure momentum strategy designed for Swing Traders who want to capture high-probability breakouts while managing risk with a mechanical trailing stop.
Unlike indicators that try to guess "bottoms," this system follows the "Smart Money" approach: buying strength when institutional volume enters, and riding the trend until the momentum breaks.
How it Works
1. The Entry (The Hunter) The system identifies a valid BREAKOUT signal only when four specific conditions align:
Trend Filter: Price must be above the 150 SMA. We only trade with the long-term trend.
Momentum: RSI > 50. Ensuring bulls are in control.
Volume Spike (Whale Activity): Current volume must be significantly higher than the average (Default: 1.5x). This filters out weak retail moves.
Price Action: A bullish candle closing higher than it opened.
2. The Exit (The Manager) Once in a trade, the system activates a dynamic Trailing Stop line. You never have to guess when to sell. You can choose between two exit logic modes in the settings:
ATR Trailing (Default): Adapts to volatility. The stop moves up based on a multiple of the Average True Range (ATR). Great for volatile stocks (e.g., TSLA, NVDA).
Percent Trailing: A fixed percentage drop from the highest high. (e.g., "Sell if price drops 10% from peak").
3. The Context (Optional Filter)
Squeeze Filter: Includes a built-in Bollinger/Keltner squeeze detection. If enabled in settings, the system will only signal a buy if the price recently broke out of a consolidation (squeeze). Default is OFF to catch all momentum moves.
Key Features
NO Repainting: Signals are confirmed at candle close.
Visual Risk Management: A Red Trailing Stop line clearly shows where your invalidation point is.
Fully Customizable: Adjust the Volume multiplier, ATR sensitivity, or Percentage drop to fit your asset class (Crypto/Stocks/Forex).
Clean Visuals: Only colors the Breakout and Sell candles to keep your chart clean.
Settings Guide
Trend SMA Length: Define the long-term trend baseline (Default: 150).
Volume Spike (xAvg): How much volume is needed to trigger a buy? (1.5 = 150% of average).
Exit Method: Choose between "ATR Trailing" or "Percent Trailing".
ATR Multiplier: Tighter stop (2.0) vs Looser stop (3.0).
Require Squeeze?: Check this to filter for breakouts that only happen after a consolidation period.
Disclaimer This tool is for educational purposes only. Always use proper risk management.
Educational

VX-Session-Boxes-(AM/PM Split)(Customizable) by Ikaru-s-VX-Session-Boxes-(AM/PM Split) is a session-based visualization tool for TradingView that highlights major market sessions directly on the chart using dotted range boxes and an optional AM/PM split.
The indicator allows traders to visually separate market behavior across different sessions while keeping the chart clean and readable.
🔹 Key Features
Custom Session Definitions
Define up to 4 independent sessions using TradingView’s session format (HHMM-HHMM + weekdays).
Timezone-Aware
All sessions are calculated using a user-defined timezone (IANA or UTC offset), ensuring accurate session alignment across markets.
Dotted Session Boxes
Each session is drawn as a dotted box based on the session’s high/low range, providing a clear view of volatility and price structure.
AM / PM Split Visualization
Sessions can be visually split into AM and PM parts:
Separate box shading for AM and PM
Optional dotted vertical split line at the AM → PM transition (12:00 in the selected timezone)
Session Labels
Optional labels at the start of each session for quick identification (e.g. Sydney, Tokyo, London, New York).
Fully Customizable Visuals
Adjustable opacity, border width, and visibility toggles for boxes, split lines, and labels.
🔹 Use Cases
Session-based market analysis (Asia / London / New York)
Identifying session ranges and volatility expansion
Observing price behavior differences between AM and PM
Studying session transitions and liquidity shifts
🔹 Notes
Session boxes are based on session high and low, not full chart height.
AM/PM split is based on 12:00 (noon) in the selected timezone.
Designed for clarity and performance on intraday timeframes.
🔹 Compatibility
Pine Script® v6
Works on all intraday timeframes
Overlay indicator (draws directly on the price chart)

Neosha Concept V4 (NY Time)
Imagine the financial market as a huge ocean. Millions of traders throw orders into it every second. But beneath all the noise, there is a powerful current that quietly controls where the waves move. That current is not a person, not a trader, and not random—it is an algorithm.
This algorithm is called the Interbank Price Delivery Algorithm (IPDA).
Think of it as the “navigation system” that guides price through the market.
IPDA has one job:
to move prices in a way that keeps the market efficient and liquid.
To do this, it constantly looks for two things:
1. Where liquidity is hiding
Liquidity is usually found above highs and below lows—where traders place stop losses. The algorithm moves price there first to collect that liquidity.
2. Where price became unbalanced
Sometimes price moves too fast and creates gaps or imbalances. IPDA returns to those areas later to “fix” the missing orders.
Once you start looking at the charts with this idea in mind, everything makes more sense:
Why price suddenly spikes above a high and crashes down
Why big moves leave gaps that price later fills
Why the market reverses right after taking stops
Why trends begin only after certain levels are hit
These are not accidents.
They are the algorithm doing its job.
Price moves in a repeating cycle:
Gather liquidity
Make a strong move (displacement)
Return to fix inefficiency
Deliver to the next target
Most beginners only see the candles.
But once you understand IPDA, you see the intention behind the candles.
Instead of guessing where price might go, you begin to understand why it moves there.
And once you understand the “why,” your trading becomes clearer, calmer, and far more accurate.

Breakout/Breakdown DetectorBreakout/Breakdown Detector - Quick Overview
What it does:
This indicator automatically identifies when price breaks through key support or resistance levels, signaling potential trading opportunities.
Key Features:
📈 Breakout Detection - Alerts when price breaks ABOVE resistance (bullish signal)
📉 Breakdown Detection - Alerts when price breaks BELOW support (bearish signal)
🔊 Volume Confirmation - Optionally requires high volume to confirm the break (filters false signals)
📊 Visual Signals - Shows green triangles (breakout) and red triangles (breakdown) on chart
🎨 Support/Resistance Lines - Automatically draws key levels based on recent price action
Settings You Can Adjust:
Lookback Period (default 20) - How many candles back to find support/resistance
Volume Multiplier (default 1.5x) - How much volume needed to confirm
Breakout Threshold (default 0.5%) - How far price must break through the level
How to Use:
Add to any chart (stocks, crypto, forex, etc.)
Green triangle below bar = BUY signal (breakout)
Red triangle above bar = SELL signal (breakdown)
Set alerts to get notified automatically
Perfect for: Swing traders, breakout traders, and anyone who wants to catch momentum moves early! 🚀


Expectativa de Juros (Fed)An indicator that measures future expectations for US interest rates, measured by the difference between the Fed's interest rate and pricing on the CME.

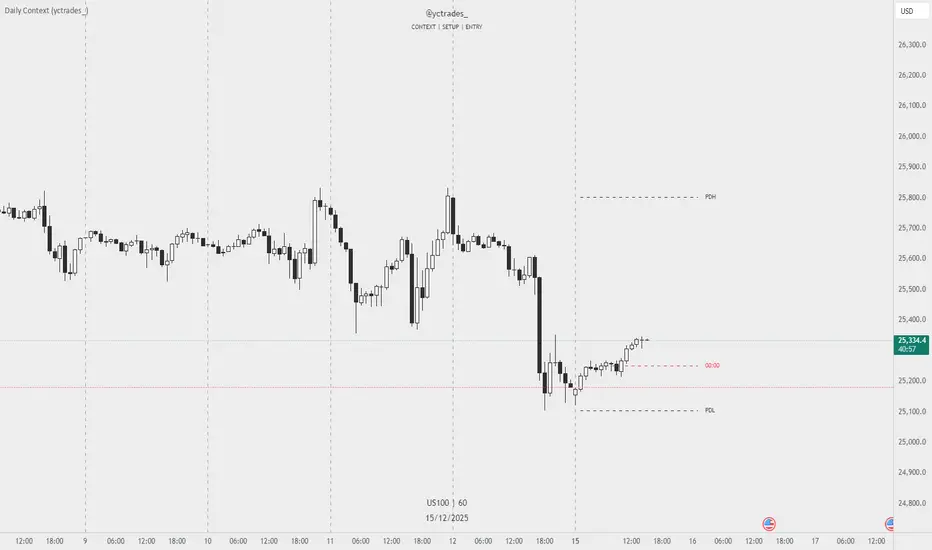
Daily Context (yctrades_)This indicator automatically marks the Previous Day’s High and Low, as well as the market’s midnight opening price.
These levels are updated at the start of each new trading day and remain visible throughout the entire session.
By providing key daily reference points, the indicator helps establish a clear market context and allows traders to immediately understand where price is positioned relative to the previous day’s range and the daily open.
The New York midnight line (00:00 NY) now appears only at the actual NY midnight.
Any previous day’s NY midnight line is automatically deleted when the day changes.
Between the previous NY midnight and the current one, no line is displayed, avoiding clutter or outdated lines.
The line’s color can now be individually customized via NY 00:00 Line + Text Color input, applying to both the line and its label.
Displays a vertical line between each trading day.
Fully customizable in the settings:
Color of the line
Width of the line
Style (solid, dashed, dotted)
This makes it easy to visually separate trading sessions directly on the chart.
PDH / PDL are calculated using UTC 00:00–23:59 to ensure identical levels for all traders worldwide, regardless of market or timezone.

SS Critical Advanced Multi-Timeframe Trend & MomentumThis indicator analyses the trend , Momentum & reversal across multiple timeframes to help find a data driven entry point. For Educational use only

THE HEDGE MASTER PRO THE HEDGE MASTER PRO is a professional technical analysis indicator designed to help traders identify trend direction, market structure, and high-probability trade zones with clarity.
This indicator focuses on:
Trend identification and continuation signals
Market structure and momentum behavior
Support & resistance based price action logic
Noise reduction for cleaner chart reading
THE HEDGE MASTER PRO is suitable for:
Intraday traders
Swing traders
Positional traders
The script is built to assist traders in decision-making and risk awareness, not to provide guaranteed returns. It works best when combined with proper risk management and trading discipline.
⚠️ This indicator is for educational and analytical purposes only. It does not provide buy/sell guarantees or financial advice.

50% level of Daily RangeThe 50% or midpoint between the current days highest and lowest points be used to divide the premium and discount of the days range. Price often reacts at this point and it can be used as a target for reversal trades. This indicator plots the level as it moves through out each day so is useful for backtesting as well as determining whether the current price is in premium or discount.

AETHER II: Quantum Liquidity EngineAETHER II is the final evolution of market scanning. It does not analyze price; it analyzes Physics.
Most traders view the chart as empty space where price moves freely. AETHER views the market as a Fluid Environment with varying degrees of Density and Viscosity.
Sometimes the market is "Thick" (High Friction). Price hits invisible walls and stops dead, even with high volume.
Sometimes the market is "Thin" (Zero Friction). Price slips rapidly through air pockets, leaving vacuums behind.
AETHER II simulates these fluid dynamics in real-time, visualizing the invisible "Dark Pool" orders that absorb liquidity and the "Liquidity Vacuums" that act as magnets for price.
Core Capabilities
1. 🛡️ Iceberg Detection (The Walls)
The Physics: When massive volume hits the market but price refuses to move, it means an institution is absorbing orders via hidden "Iceberg" limit orders.
The Signal: AETHER paints a persistent "Blockade Zone" (Green for Support, Red for Resistance).
Action: Treat these zones as concrete walls. Do not trade into them. Place your stops behind them.
2. 👻 Vacuum Detection (The Ghosts)
The Physics: When price moves rapidly with tiny volume, it creates a "Liquidity Vacuum." This is fake movement caused by slippage (Zero Friction).
The Signal: AETHER paints a "Ghost Zone" (Purple).
Action: Price hates vacuums and will almost always snap back to fill them. These are high-probability magnetic targets for Take Profits.
3. 📟 Quantum HUD (Heads-Up Display) A real-time dashboard in the top corner that grades the current market physics:
STATE: Tells you if the market is in "FLOW," hitting a "WALL," or slipping into a "VACUUM."
FRICTION: A raw density score. If this number spikes, movement is about to stop.
How to Use (The "Physics" Protocol)
AETHER is your map of the battlefield's terrain.
Scenario A (The Trap): You want to Buy. You check AETHER. There is a Red "Iceberg Zone" right above you.
Decision: WAIT. The friction is too high. Buying here is like running into a concrete wall. Wait for the wall to be breached.
Scenario B (The Slip): Price crashes down rapidly, leaving a trail of Purple "Vacuum Zones" behind.
Decision: TARGET THE GHOSTS. The move down was fake (low density). Price will likely reverse to fill the vacuum.
Disclaimer
This tool simulates order book density using Volume-Range efficiency metrics. It does not access Level 3 Dark Pool data (which is unavailable to retail traders).

QUANTUM : Statistical Probability EngineQUANTUM is not a price indicator. It is a Probability Engine.
Standard technical analysis (RSI, MACD) looks at price action, which can be manipulated. QUANTUM looks at Statistical Distributions. It gages how far the current price has deviated from its mathematical mean.
In the world of quantitative finance, price spends 95% of its time within "2 Sigmas" (Standard Deviations) of value. When price hits "3 Sigmas" (99.7% deviation), it is a Statistical Anomaly. These "Black Swan" events rarely last, and the market almost always snaps back to the mean.
QUANTUM detects these anomalies in real-time.
Core Logic: The Gaussian Limits
1. 🌫️ The Grey Zone (1-Sigma)
Status: Normal Noise.
Meaning: The market is behaving normally. Trends are sustainable here. Do not look for reversals yet.
2. ⚠️ The Warning Zone (2-Sigma)
Colors: Cyan (Long) / Orange (Short).
Meaning: The rubber band is stretching. The move is becoming statistically overextended. Be careful adding to positions here.
3. ⚡ The Anomaly Zone (3-Sigma)
Colors: Bright Green (Long) / Bright Red (Short).
Meaning: The Black Swan Event.
Price has reached a deviation that only happens 0.3% of the time. This is the "Kill Zone" for reversals. When you see a 3-Sigma bar, the probability of a snap-back is nearly absolute.
How to Use (The "Mean Reversion" Protocol)
This tool is designed to find tops and bottoms that other indicators miss.
Scenario A (Trend Following): Price is making new highs, but QUANTUM is still in the Grey or Orange zone. Action: Hold the trade. The trend has statistical room to grow.
Scenario B (The Sniper Reversal): Price spikes up violently. QUANTUM prints a Bright Red 3-Sigma Bar. Action: Sell immediately or close Longs. The probability of continuation is mathematically near zero.
Best Markets
Scalping: Deadly on 1m and 5m timeframes for Indices (US30).
Swing: Identifies multi-week tops on Daily charts for Crypto and Forex.
Disclaimer
This tool calculates statistical probability. While 3-Sigma events are rare, markets can remain irrational during extreme news events. Always manage risk.

SMC MICRO ENTRY SETUPThis setup is designed based on Fair Value Gaps where trader can predict Bullish Or Bearish Trend with Market Structure and FVG, We may get Micro Levels for Buying and Selling with Small FVG Detection with Lower Time Frames, This setup will help trader to find good trades with Smart Money entries with FVG Order Blocks,
Same setup is only for Education Purposes don't take blind traded on it. Before taking any trade please concern with your Financial Advisor.
Green OB = Bullish Trend with Fresh Demand
Red OB = Bearish Trend with Fresh Supply
Gray OB = If Tested Red of Green OB it will automatic convert into Gray as a Entry Taken with OB

VANGUARD: Range & Exhaustion ProfilerOverview
VANGUARD is the ultimate defensive engine. Its purpose is simple: Prevent you from being the Exit Liquidity.
Amateur traders often chase price when it is already overextended. They buy at the top of the day and sell at the bottom. VANGUARD prevents this by projecting the Statistical Daily Limits of an asset before the day even begins.
Hedge Funds and Algorithms operate within defined volatility limits (Average Daily Range). VANGUARD visualizes these limits on your chart in real-time, telling you exactly when a move is statistically "Exhausted."
Core Capabilities
1. 🛡️ The Daily Open (The Anchor) Institutions measure extension relative to the Daily Open (White Dot).
Above Open: You should be looking for Longs or fading Tops.
Below Open: You should be looking for Shorts or fading Bottoms.
2. 🎯 The 50% "Mean" (Profit Taking) The Green Dotted Line represents the standard volatility target. This is where 70% of days will reach. It is your primary Take Profit zone.
3. ⛔ The 100% "Wall" (Statistical Exhaustion) The Solid Yellow Line represents 100% of the asset's Average Daily Range.
The Rule: If price hits this line, the move is statistically over.
Action: DO NOT initiate new positions in the direction of the trend. Look for reversals or close your trades.
4. ⚡ The 125% "Anomaly" (Extreme Extension) The Solid Red Line represents a 3-Sigma event. If price reaches here, it is an extreme anomaly. Reversions from this level are often violent and immediate.
How to Use (The "Stay Safe" Protocol)
VANGUARD is designed to be overlayed on your chart to act as a governor for your trading.
Scenario A: You get a Buy Signal from your strategy. You check VANGUARD. Price is near the Daily Open. Action: EXECUTE. (Plenty of room to run).
Scenario B: You get a Buy Signal. You check VANGUARD. Price is hitting the 100% Exhaustion Line. Action: IGNORE. (The tank is empty. Don't buy the top).
Best Markets
Forex: Extremely accurate on GBPJPY, EURUSD, and XAUUSD.
Indices: Helps identify the High/Low of the day on US30 and NAS100.
Disclaimer
This tool projects statistical ranges based on historical volatility. It does not guarantee that price will stop at these levels. Always use stop losses.

ORACLE: Command Center (Macro & Correlation HUD)Overview
ORACLE is the final piece of the ecosystem. It provides Situational Awareness.
Most traders fail because they trade in a vacuum. They stare at a 5-minute chart of Gold and have no idea that the US Dollar is spiking or that Bond Yields are collapsing.
ORACLE is a multi-asset "Heads Up Display" (HUD) designed to sit on your chart and monitor the entire battlefield simultaneously. It scans 5 Custom Assets in real-time, grading their Trend, Momentum, and Volatility so you always know the "Risk Environment."
Core Capabilities
1. 🌍 The Macro Scanner (God’s Eye View) By default, ORACLE is pre-configured to monitor the "Market Movers":
DXY (Dollar Index): Currency Strength.
US10Y (10-Year Yields): The cost of money (Risk On/Risk Off).
SPX (S&P 500): General Market Health.
BTC (Bitcoin): Speculative Risk Appetite.
XAU (Gold): Safe Haven Flow.
2. 📊 The Data Engine The HUD processes four critical metrics for every asset instantly:
Trend: Uses an algorithmic EMA cloud to determine if the asset is Bullish, Bearish, or Ranging.
Momentum: Detects "Overheated" (Fire) or "Frozen" (Ice) conditions using RSI logic.
Volatility: Alerts you when an asset is "waking up" with high volatility or "sleeping."
Performance: Real-time daily percentage change to show where the money is flowing today.
How to Use (The "Hedge Fund" Correlation)
Scenario A: The Short Signal
You see a Sell signal on Gold (using NEXUS/PREDATOR).
You glance at ORACLE.
DXY is "🚀 BULLISH" and US10Y is "🚀 BULLISH."
Analysis: If the Dollar and Yields are ripping, Gold must fall.
Action: EXECUTE WITH FULL CONFIDENCE.
Scenario B: The Warning
You see a Buy signal on Bitcoin.
You glance at ORACLE.
SPX is "🐻 BEARISH" and DXY is "🚀 BULLISH."
Analysis: Risk assets are selling off. The Bitcoin signal is likely a trap.
Action: STAND DOWN.
Customization
You are not limited to the defaults. Go into the settings and change the 5 tickers to anything you want (e.g., EURUSD, GBPUSD, AUDUSD, USDJPY) to turn ORACLE into a dedicated Forex Scanner.
Disclaimer
This tool visualizes data from multiple assets. Past performance is not indicative of future results.

PREDATOR Volatility & Squeeze EnginePREDATOR is a pure volatility engine designed to answer one question: "When?"
While most indicators analyze price, PREDATOR analyzes energy. Markets spend 80% of their time ranging (building potential energy) and 20% of their time exploding (releasing kinetic energy). Retail traders lose money by trying to trade the chop.
PREDATOR identifies when the market is "Coiling" (compressing) and alerts you the exact millisecond that energy is released into a directional trend.
The "Coil & Strike" System
1. ⚪ The Zero Line (Compression Detection)
White Dots: The "Safety" is ON. The market is in a state of extreme compression. Do not trade. The longer these dots appear, the more violent the subsequent move will be.
Grey Dots: The "Safety" is OFF. Volatility has returned to the market.
2. 📊 The Momentum Histogram (Directional Velocity) Instead of standard momentum, this engine uses a non-linear regression algorithm to predict the velocity of the move.
🟦 Cyan: High-Velocity Bullish Momentum (Expansion Phase).
🟥 Red: High-Velocity Bearish Momentum (Crash Phase).
Dark Colors: Momentum is fading; look to take profits.
How to Use
This tool is designed to filter out "Fakeouts" and keep you out of low-volatility chop.
The "Predator" Protocol:
Wait for the Coil: Look for a series of White Dots on the zero line. This indicates the market is building energy for a move.
Watch for "Pre-Ignition": While the dots are still white, watch the histogram. If it starts shifting to Cyan (Bullish) or Red (Bearish), the smart money is positioning early.
The Strike (Entry Signal): The signal is confirmed when the White Dots disappear and the Histogram expands in a bright color. This is the Volatility Release.
Best Markets
Indices (US30, NAS100): Deadly accurate for catching the open/close volatility flush.
Gold (XAUUSD): excellent for filtering out the midday chop.
Crypto: Identifies the "Squeezes" before the 5-10% candles.
Disclaimer
This tool measures volatility and momentum velocity. It does not predict price targets. Use with proper risk management.

NEXUS PRO: Institutional Flow & Liquidity EngineNEXUS PRO is a next-generation market scanner designed to help traders identify high-probability reversals by tracking what matters most: Institutional Capital Flow.
Most indicators lag behind price, trapping retail traders into late entries. NEXUS PRO takes a different approach. It combines Liquidity Sweep Detection, Orderflow Analysis, and Multi-Timeframe Trend Structure into a single proprietary "Neural Score."
Instead of guessing if a trend is valid, the engine processes millions of data points per candle to give you a single, actionable Confluence Grade (S, A, B, C, D).
Core Features
1. ⚔️ Liquidity Sweep Detection (The "Trap" Engine) Institutions often push price below key levels to trigger retail stop-losses before reversing. NEXUS PRO automatically detects these "Stop Hunts" and "Liquidity Grabs" in real-time, marking them on your chart. These are your highest-probability reversal zones.
2. 🧠 Proprietary "Neural" Scoring System Stop analyzing 10 different indicators manually. The on-chart Dashboard calculates a real-time Probability Score (0-100%) for every setup based on:
Structure: Is the market breaking structure (BOS) or just noise?
Valuation: Is price in a Premium or Discount zone relative to institutional VWAP?
Momentum: Are buyers or sellers actually in control?
Multi-Timeframe Alignment: Are the higher timeframes backing your trade?
3. 📊 Institutional Volume Analysis Detects "Volume Climaxes" and "Anomalies" that often mark the exact top or bottom of a move. The bars change color (Green/Red) to alert you when Smart Money is stepping in with size.
4. 🏦 Professional Dashboard A clean, non-intrusive heads-up display (HUD) that shows you the health of the current asset at a glance. Monitor the Trend, Momentum, Volatility, and Liquidity status without cluttering your chart.
How to Use (The "Sweep & Reverse" Strategy)
NEXUS PRO is optimized for catching Reversals and Trend Continuations.
Wait for the Signal: Look for a "⚔️ LIQ GRAB" label or a "BOS" (Break of Structure) marker. This indicates a potential institutional entry point.
Check the Dashboard: Glance at the SCORE.
Grade S or A (80-100%): Prime Institutional Setup. High confidence.
Grade B (60-79%): Valid Setup. Ensure proper risk management.
Grade C/D: Low probability / Noise. Recommended to stay flat.
Confirm Volume: Look for a Volume Climax (highlighted colored bars) to confirm that big money is participating in the move.
Settings & Customization
Signal Quality: Filter out noise by setting the engine to show only "High" or "Ultra" grade setups.
Dashboard Position: Move the HUD to any corner of the screen to fit your workspace.
Visuals: Fully customizable colors to match your dark/light mode preference.
Disclaimer
This tool is for educational and analytical purposes only. It quantifies market data to assist in decision-making but does not guarantee future results. Always use proper risk management.

NSE Arbitrage Dashboard - Part 5 (CapGoods & Infra)Inspired by Wealthcon
This the FIFTH of 5 series Indicators showing Live arbitrage opportunity in 3 Indices & 100 most Liquids FNO scrips of NSE. This series includes CAPITAL GOODS & INFRA
Only for EDUCATIONAL PURPOSE

NSE Arbitrage Dashboard - Part 4 (FMCG & Pharma)Inspired by Wealthcon
This the FOURTH of 5 series Indicators showing Live arbitrage opportunity in 3 Indices & 100 most Liquids FNO scrips of NSE. This series includes FMCG & PHARMA
Only for EDUCATIONAL PURPOSE

NSE Arbitrage Dashboard - Part 3 (Energy & Metals)Inspired by Wealthcon
This the THIRD of 5 series Indicators showing Live arbitrage opportunity in 3 Indices & 100 most Liquids FNO scrips of NSE. This series includes ENERGY & METALS
Only for EDUCATIONAL PURPOSE

NSE Arbitrage Dashboard - Part 2 (IT & Auto)Inspired by Wealthcon
This the SECOND of 5 series Indicators showing Live arbitrage opportunity in 3 Indices & 100 most Liquids FNO scrips of NSE. This series includes IT & Auto
Only for EDUCATIONAL PURPOSE

NSE Arbitrage Dashboard - Part 1 (Indices/Banks)Inspired by Wealthcon
This the FIRST of 5 series Indicators showing Live arbitrage opportunity in 3 Indices & 100 most Liquids FNO scrips of NSE. This series includes 3 indices & banks / NBFCs
Only for EDUCATIONAL PURPOSE
