FvgCalculations█ OVERVIEW
This library provides the core calculation engine for identifying Fair Value Gaps (FVGs) across different timeframes and for processing their interaction with price. It includes functions to detect FVGs on both the current chart and higher timeframes, as well as to check for their full or partial mitigation.
█ CONCEPTS
The library's primary functions revolve around the concept of Fair Value Gaps and their lifecycle.
Fair Value Gap (FVG) Identification
An FVG, or imbalance, represents a price range where buying or selling pressure was significant enough to cause a rapid price movement, leaving an "inefficiency" in the market. This library identifies FVGs based on three-bar patterns:
Bullish FVG: Forms when the low of the current bar (bar 3) is higher than the high of the bar two periods prior (bar 1). The FVG is the space between the high of bar 1 and the low of bar 3.
Bearish FVG: Forms when the high of the current bar (bar 3) is lower than the low of the bar two periods prior (bar 1). The FVG is the space between the low of bar 1 and the high of bar 3.
The library provides distinct functions for detecting FVGs on the current (Low Timeframe - LTF) and specified higher timeframes (Medium Timeframe - MTF / High Timeframe - HTF).
FVG Mitigation
Mitigation refers to price revisiting an FVG.
Full Mitigation: An FVG is considered fully mitigated when price completely closes the gap. For a bullish FVG, this occurs if the current low price moves below or touches the FVG's bottom. For a bearish FVG, it occurs if the current high price moves above or touches the FVG's top.
Partial Mitigation (Entry/Fill): An FVG is partially mitigated when price enters the FVG's range but does not fully close it. The library tracks the extent of this fill. For a bullish FVG, if the current low price enters the FVG from above, that low becomes the new effective top of the remaining FVG. For a bearish FVG, if the current high price enters the FVG from below, that high becomes the new effective bottom of the remaining FVG.
FVG Interaction
This refers to any instance where the current bar's price range (high to low) touches or crosses into the currently unfilled portion of an active (visible and not fully mitigated) FVG.
Multi-Timeframe Data Acquisition
To detect FVGs on higher timeframes, specific historical bar data (high, low, and time of bars at indices and relative to the higher timeframe's last completed bar) is required. The requestMultiTFBarData function is designed to fetch this data efficiently.
█ CALCULATIONS AND USE
The functions in this library are typically used in a sequence to manage FVGs:
1. Data Retrieval (for MTF/HTF FVGs):
Call requestMultiTFBarData() with the desired higher timeframe string (e.g., "60", "D").
This returns a tuple of htfHigh1, htfLow1, htfTime1, htfHigh3, htfLow3, htfTime3.
2. FVG Detection:
For LTF FVGs: Call detectFvg() on each confirmed bar. It uses high , low, low , and high along with barstate.isconfirmed.
For MTF/HTF FVGs: Call detectMultiTFFvg() using the data obtained from requestMultiTFBarData().
Both detection functions return an fvgObject (defined in FvgTypes) if an FVG is found, otherwise na. They also can classify FVGs as "Large Volume" (LV) if classifyLV is true and the FVG size (top - bottom) relative to the tfAtr (Average True Range of the respective timeframe) meets the lvAtrMultiplier.
3. FVG State Updates (on each new bar for existing FVGs):
First, check for overall price interaction using fvgInteractionCheck(). This function determines if the current bar's high/low has touched or entered the FVG's currentTop or currentBottom.
If interaction occurs and the FVG is not already mitigated:
Call checkMitigation() to determine if the FVG has been fully mitigated by the current bar's currentHigh and currentLow. If true, the FVG's isMitigated status is updated.
If not fully mitigated, call checkPartialMitigation() to see if the price has further entered the FVG. This function returns the newLevel to which the FVG has been filled (e.g., currentLow for a bullish FVG, currentHigh for bearish). This newLevel is then used to update the FVG's currentTop or currentBottom.
The calling script (e.g., fvgMain.c) is responsible for storing and managing the array of fvgObject instances and passing them to these update functions.
█ NOTES
Bar State for LTF Detection: The detectFvg() function relies on barstate.isconfirmed to ensure FVG detection is based on closed bars, preventing FVGs from being detected prematurely on the currently forming bar.
Higher Timeframe Data (lookahead): The requestMultiTFBarData() function uses lookahead = barmerge.lookahead_on. This means it can access historical data from the higher timeframe that corresponds to the current bar on the chart, even if the higher timeframe bar has not officially closed. This is standard for multi-timeframe analysis aiming to plot historical HTF data accurately on a lower timeframe chart.
Parameter Typing: Functions like detectMultiTFFvg and detectFvg infer the type for boolean (classifyLV) and numeric (lvAtrMultiplier) parameters passed from the main script, while explicitly typed series parameters (like htfHigh1, currentAtr) expect series data.
fvgObject Dependency: The FVG detection functions return fvgObject instances, and fvgInteractionCheck takes an fvgObject as a parameter. This UDT is defined in the FvgTypes library, making it a dependency for using FvgCalculations.
ATR for LV Classification: The tfAtr (for MTF/HTF) and currentAtr (for LTF) parameters are expected to be the Average True Range values for the respective timeframes. These are used, if classifyLV is enabled, to determine if an FVG's size qualifies it as a "Large Volume" FVG based on the lvAtrMultiplier.
MTF/HTF FVG Appearance Timing: When displaying FVGs from a higher timeframe (MTF/HTF) on a lower timeframe (LTF) chart, users might observe that the most recent MTF/HTF FVG appears one LTF bar later compared to its appearance on a native MTF/HTF chart. This is an expected behavior due to the detection mechanism in `detectMultiTFFvg`. This function uses historical bar data from the MTF/HTF (specifically, data equivalent to `HTF_bar ` and `HTF_bar `) to identify an FVG. Therefore, all three bars forming the FVG on the MTF/HTF must be fully closed and have shifted into these historical index positions relative to the `request.security` call from the LTF chart before the FVG can be detected and displayed on the LTF. This ensures that the MTF/HTF FVG is identified based on confirmed, closed bars from the higher timeframe.
█ EXPORTED FUNCTIONS
requestMultiTFBarData(timeframe)
Requests historical bar data for specific previous bars from a specified higher timeframe.
It fetches H , L , T (for the bar before last) and H , L , T (for the bar three periods prior)
from the requested timeframe.
This is typically used to identify FVG patterns on MTF/HTF.
Parameters:
timeframe (simple string) : The higher timeframe to request data from (e.g., "60" for 1-hour, "D" for Daily).
Returns: A tuple containing: .
- htfHigh1 (series float): High of the bar at index 1 (one bar before the last completed bar on timeframe).
- htfLow1 (series float): Low of the bar at index 1.
- htfTime1 (series int) : Time of the bar at index 1.
- htfHigh3 (series float): High of the bar at index 3 (three bars before the last completed bar on timeframe).
- htfLow3 (series float): Low of the bar at index 3.
- htfTime3 (series int) : Time of the bar at index 3.
detectMultiTFFvg(htfHigh1, htfLow1, htfTime1, htfHigh3, htfLow3, htfTime3, tfAtr, classifyLV, lvAtrMultiplier, tfType)
Detects a Fair Value Gap (FVG) on a higher timeframe (MTF/HTF) using pre-fetched bar data.
Parameters:
htfHigh1 (float) : High of the first relevant bar (typically high ) from the higher timeframe.
htfLow1 (float) : Low of the first relevant bar (typically low ) from the higher timeframe.
htfTime1 (int) : Time of the first relevant bar (typically time ) from the higher timeframe.
htfHigh3 (float) : High of the third relevant bar (typically high ) from the higher timeframe.
htfLow3 (float) : Low of the third relevant bar (typically low ) from the higher timeframe.
htfTime3 (int) : Time of the third relevant bar (typically time ) from the higher timeframe.
tfAtr (float) : ATR value for the higher timeframe, used for Large Volume (LV) FVG classification.
classifyLV (bool) : If true, FVGs will be assessed to see if they qualify as Large Volume.
lvAtrMultiplier (float) : The ATR multiplier used to define if an FVG is Large Volume.
tfType (series tfType enum from no1x/FvgTypes/1) : The timeframe type (e.g., types.tfType.MTF, types.tfType.HTF) of the FVG being detected.
Returns: An fvgObject instance if an FVG is detected, otherwise na.
detectFvg(classifyLV, lvAtrMultiplier, currentAtr)
Detects a Fair Value Gap (FVG) on the current (LTF - Low Timeframe) chart.
Parameters:
classifyLV (bool) : If true, FVGs will be assessed to see if they qualify as Large Volume.
lvAtrMultiplier (float) : The ATR multiplier used to define if an FVG is Large Volume.
currentAtr (float) : ATR value for the current timeframe, used for LV FVG classification.
Returns: An fvgObject instance if an FVG is detected, otherwise na.
checkMitigation(isBullish, fvgTop, fvgBottom, currentHigh, currentLow)
Checks if an FVG has been fully mitigated by the current bar's price action.
Parameters:
isBullish (bool) : True if the FVG being checked is bullish, false if bearish.
fvgTop (float) : The top price level of the FVG.
fvgBottom (float) : The bottom price level of the FVG.
currentHigh (float) : The high price of the current bar.
currentLow (float) : The low price of the current bar.
Returns: True if the FVG is considered fully mitigated, false otherwise.
checkPartialMitigation(isBullish, currentBoxTop, currentBoxBottom, currentHigh, currentLow)
Checks for partial mitigation of an FVG by the current bar's price action.
It determines if the price has entered the FVG and returns the new fill level.
Parameters:
isBullish (bool) : True if the FVG being checked is bullish, false if bearish.
currentBoxTop (float) : The current top of the FVG box (this might have been adjusted by previous partial fills).
currentBoxBottom (float) : The current bottom of the FVG box (similarly, might be adjusted).
currentHigh (float) : The high price of the current bar.
currentLow (float) : The low price of the current bar.
Returns: The new price level to which the FVG has been filled (e.g., currentLow for a bullish FVG).
Returns na if no new partial fill occurred on this bar.
fvgInteractionCheck(fvg, highVal, lowVal)
Checks if the current bar's price interacts with the given FVG.
Interaction means the price touches or crosses into the FVG's
current (possibly partially filled) range.
Parameters:
fvg (fvgObject type from no1x/FvgTypes/1) : The FVG object to check.
Its isMitigated, isVisible, isBullish, currentTop, and currentBottom fields are used.
highVal (float) : The high price of the current bar.
lowVal (float) : The low price of the current bar.
Returns: True if price interacts with the FVG, false otherwise.
Detection

Improved G-Trend DetectionIt is the Improved version of G trend channel detection.
The Umair Trend Detection Indicator is a powerful tool designed to help traders identify potential buy and sell opportunities by combining dynamic price channels with RSI-based confirmation. This indicator is suitable for all types of financial markets, including stocks, forex, and cryptocurrencies.
Key Features:
Dynamic G-Channels
Calculates upper, lower, and average price channels based on the "G-Channel" methodology.
Helps identify market extremes and potential reversal points.
RSI Confirmation
Integrates RSI (Relative Strength Index) to filter buy and sell signals.
Avoids false signals by ensuring market momentum aligns with trend direction.
Buy/Sell Signals
Generates "Buy" signals when bullish conditions align with oversold RSI levels.
Generates "Sell" signals when bearish conditions align with overbought RSI levels.
Exit Signals
Provides optional exit points for both long and short positions using a buffer for confirmation.
Visual Clarity
Displays clearly plotted channels and average lines to help visualize price trends.
Buy and sell signals are marked with arrows for easy identification on the chart.
Custom Alerts
Offers customizable alerts for buy, sell, and exit conditions, ensuring traders never miss an opportunity.
Input Parameters:
Channel Length: Controls the sensitivity of the G-Channels.
Multiplier: Adjusts the width of the channels to suit different market conditions.
RSI Settings: Customize RSI length and thresholds for overbought/oversold conditions.
Exit Signal Buffer: Adds flexibility to the exit strategy by delaying signals for confirmation.
How It Helps:
The Umair Trend Detection Indicator is perfect for traders looking for an easy-to-use trend-following system with strong confirmation. By combining dynamic channels with RSI, it provides accurate and reliable signals to enter and exit trades, minimizing risks associated with false breakouts or trend reversals.
Use Cases:
Trend Trading: Identify and follow long-term trends with confidence.
Swing Trading: Spot reversals and capitalize on medium-term price movements.
Risk Management: Use exit signals to lock in profits or limit losses effectively.
This indicator is a versatile tool for both novice and experienced traders. Fine-tune its settings to align with your trading style and improve your decision-making in any market.

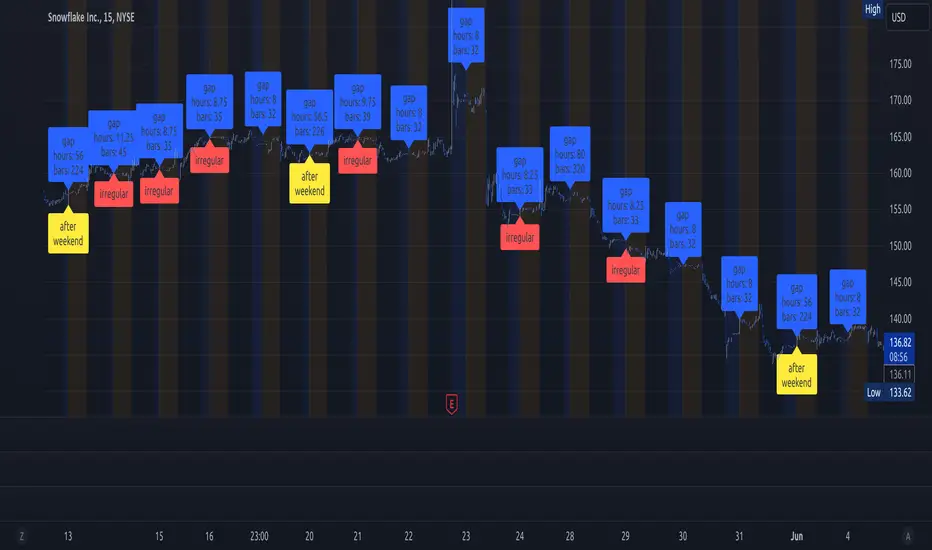
lib_session_gapsLibrary "lib_session_gaps"
simple lib to calculate the gaps between sessions
time_gap()
calculates the time gap between this and previous session (in case of irregular end of previous session, considering extended sessions)
Returns: the time gap between this and previous session in ms (time - time_close )
bar_gap()
calculates the bars missing between this and previous session (in case of irregular end of previous session, considering extended sessions)
Returns: the bars virtually missing between this and previous session (time gap / bar size in ms)
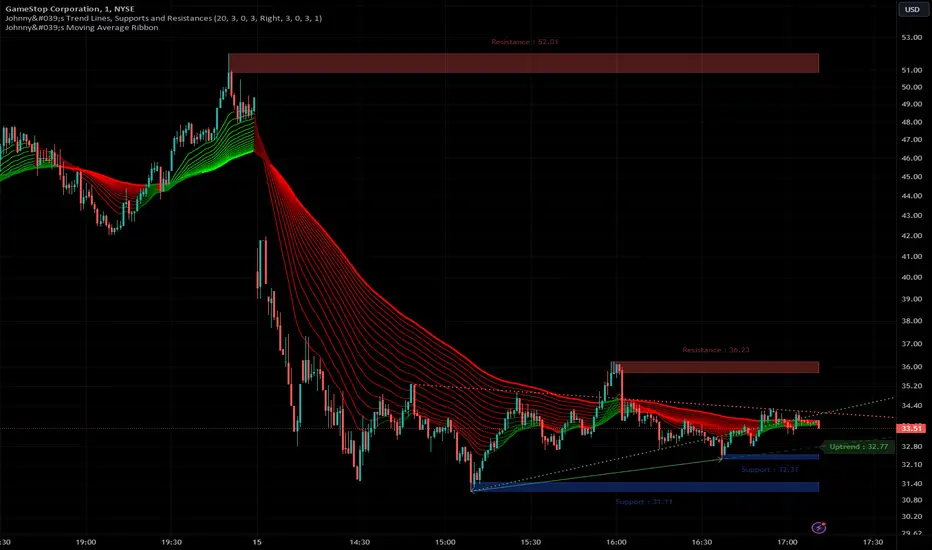
Johnny's Trend Lines, Supports and ResistancesInspired and based on ismailcarlik's Trend Lines, Supports and Resistances.
Additions include an overall upgrade to Pinescript v5, changes in the way resistance and support levels are calculated, improved visual queues, and additional customization options.
This indicator is meticulously crafted to provide traders with visual tools for identifying trend lines, support, and resistance levels, enhancing the decision-making process in trading activities.
Features and Functionality
Trend Lines: The indicator allows users to enable or disable trend lines, adjust the number of points to check for establishing a trend, and set parameters for trend validation, including the maximum violation and exceptions for the last bars.
Support and Resistance: It offers tools to identify and visualize key support and resistance levels based on recent pivot points. This includes adjustable parameters for the maximum violations allowed and the exclusion of recent bars from the analysis.
Pivot Points: Users can define the pivot length for calculating highs and lows, which helps in marking significant pivot points that are instrumental in trend analysis.
Alerts and Notifications: The indicator is equipped with customizable alerts for trend line breaches and pivot point formations, which can be set to trigger at different frequencies based on user preference.
How It Works
Input Flexibility: Users can adjust various settings like the length of trend lines and pivot points, enabling or disabling specific features like marking pivots, and managing alert settings directly from the indicator’s input panel.
Dynamic Analysis: By analyzing the price action relative to the calculated trend lines and pivot points, the indicator dynamically identifies potential trend reversals, continuations, and significant price levels.
Visualization: It plots trend lines and marks support and resistance levels directly on the chart, with options to extend these lines and add labels for better clarity. Violated trend lines can be visually differentiated by changing their style and width.
Practical Application
Trend Line Strategy: Traders can use the trend lines to determine the strength of the current market trend and to spot potential reversal points.
Support and Resistance Strategy: By marking where the price has historically faced resistance or found support, traders can plan entry and exit points, set stop-loss orders, or identify breakout opportunities.
Pivot Points Strategy: Pivot points serve as vital indicators for intraday trading or long-term trend analysis, providing insights into potential support and resistance levels.
Customization and Alerts
Custom Alerts: Traders can set alerts for when the price crosses trend lines or when new support or resistance levels are formed, helping them stay informed of critical market movements without having to continuously monitor the charts.
Visual Customization: Users can personalize the appearance of trend lines and labels, choosing from a variety of colors and styles to match their chart setup or preferences.
"Johnny's Trend Lines, Supports and Resistances" is an essential tool for traders who rely on technical analysis, offering detailed insights and real-time updates on market conditions, trend strength, and potential price barriers.
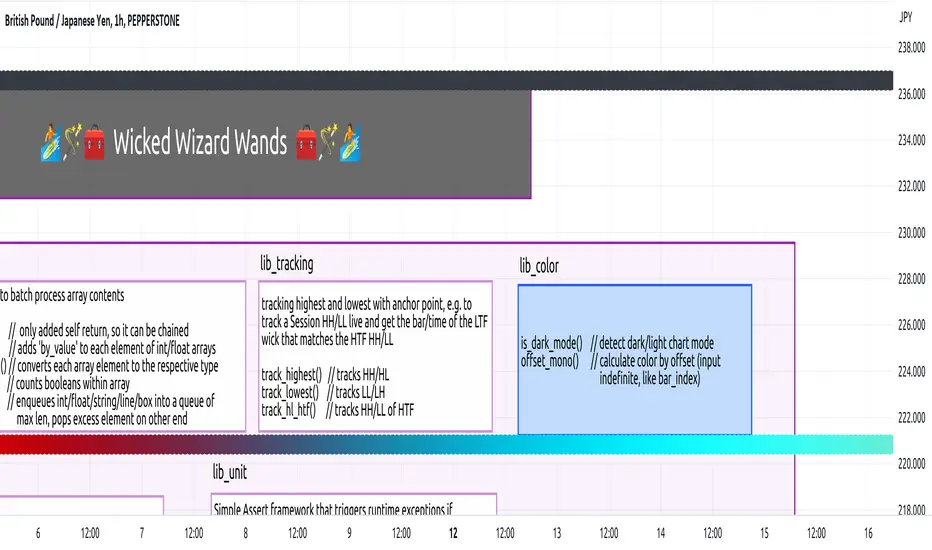
lib_colorLibrary "lib_color"
offset_mono(original, offset, transparency)
get offset color
Parameters:
original (simple color) : original color
offset (float) : offset for new color
transparency (float) : transparency for new color
Returns: offset color

lib_colorsLibrary "lib_colors"
offset_mono(original, offset, transparency)
get offset color
Parameters:
original (simple color) : original color
offset (float) : offset for new color
transparency (float) : transparency for new color
Returns: offset color
Divergence Finder [Multigrain]█ OVERVIEW
This indicator is a divergence finder, designed to be overlayed on top of any oscillator. By utilizing an Exponential Moving Average, rather than built-in pivot functions, this allows for insignificant pivots of the oscillator to be filtered out. Additionally, by sampling more than just the previous oscillator pivot, this allows for divergences to be found that would otherwise be overlooked through other methods.
█ CONCEPTS
Interim Price Threshold
A new metric used when determining valid divergences is the Interim Price Threshold (IPT). The IPT is the maximum percent delta the price is allowed to "poke-through" the divergent line at any given time.
Interim Oscillator Threshold
Similar to the Interim Price Threshold, the Interim Oscillator Threshold (IOT) is the maximum percent delta the oscillator is allowed to "poke-through" the divergent line at any given time.
Dynamic Midline
Commonly a static midline is utilized when determining whether a divergence may be bullish or bearish. By utilizing the built-in percentile nearest rank function, the midline is automatically and dynamically determined based on the previous 250 bars. As a result certain divergences which may otherwise be overlooked will be discovered.
█ SETTINGS
Oscillator Source: The oscillator in which you want find divergences from. Default to a MACD oscillator when unchanged.
Price Source: The price source in which you want to find divergences from.
Moving Average Length: The length of the exponential moving average used when determining the pivot points of the selected oscillator.
█ USAGES
Divergence in technical analysis can indicate a significant bullish or bearish price move. A bullish divergence occurs when an asset's price makes a new low while an indicator begins to rise. A bearish divergence occurs when the price makes a new high but the indicator under consideration makes a lower high.

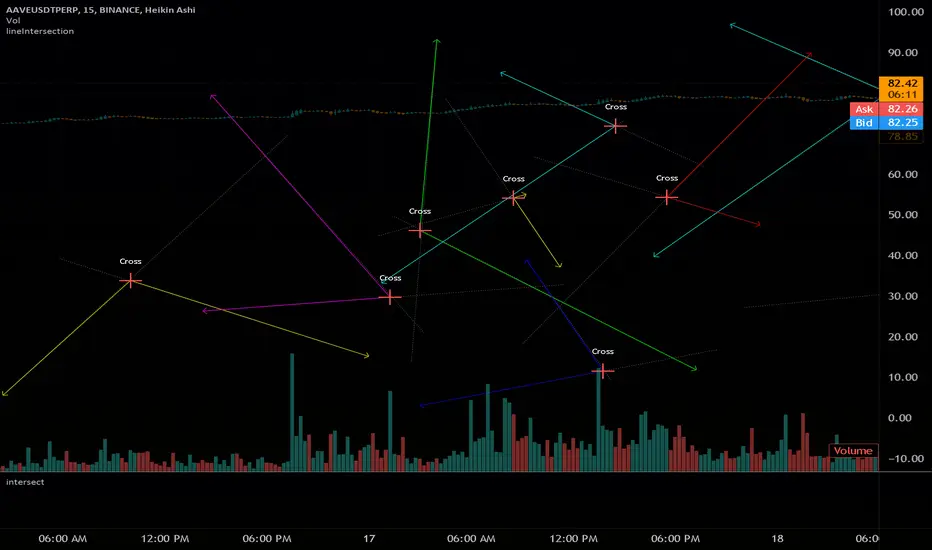
intersectLibrary "intersect"
Find Line Intersection X/Y coordinates.
Simple to use, will find intersection if it exists on the segments
if the line segments do not cross on segment, an 'na' value will be returned
if you plot new items with the output coords, they still plot.
avoid this by setting a na(x) condition before plotting new items
get(l1, l2, ( optional _round) )
line intersection coordinates
Parameters:
l1 : (line) first line
l2 : (line) second line
_round : True to make an INT for plotting
if not used, will not round ( overload loophole)
Returns: with x as int if bool is used
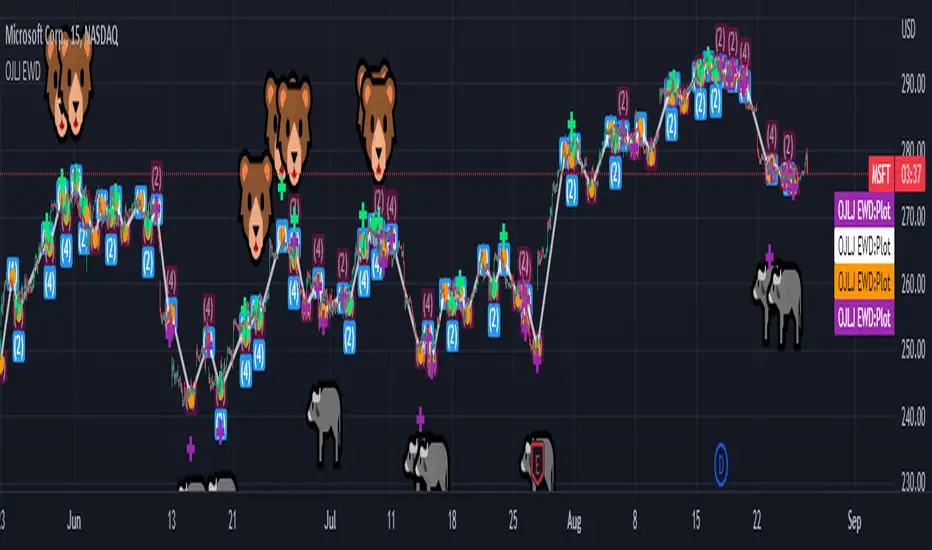
OJLJ Elliott Waves detector (Free)This script is made to identify Elliot Waves by setting a zigzag line as principal source, it identifies patterns with the most common rules, in the chart you will see a number in each wave detected, a wave could have the characteristics to be two different waves so it will be plotted the options that could be, To identify which one is most trustable I suggest to use the Fibonacci levels options as an additional note this is a free update to my existing script.
Features:
+ All waves ? (Option to show just the 5 Wave patterns recognition)
+ Draw zigzag line (Option to show the zigzag line)
+ Supports Multiple instruments, from FOREX to Stocks
+ It works on all the timeframes
+ Show Fib levels (Option to show the Fibonacci levels)
+ Fibonacci levels fit test (Green crosses mark were should a Bull wave be to fit with a Fibonacci Level While the purple crosses show were should the wave fit to be a bear trend, the more closer with the point of the wave the most trustable Example, a 5 Wave Bull could also be a 2 Bear Wave, if the green cross is closer to the orange point of the wave then is a 5 Wave Bull, if the purple cross is closer to the orange point)
+ A background color also show when a 5 pattern is identified
+ The way to plot the zigzag can be changed with 3 Input options
Characteristics to add in future updates (Please if you like it you can support me with coins):
+ Detect more than 1 cycle at the same time
+ Use a volume indicator to identify how many volume was traded in each wave
+ Implement the use of the EWO ( Elliot Wave Oscillator)
+ Improve the display
+ Identify ABC patterns
+ Add triangles and Zigzag formations
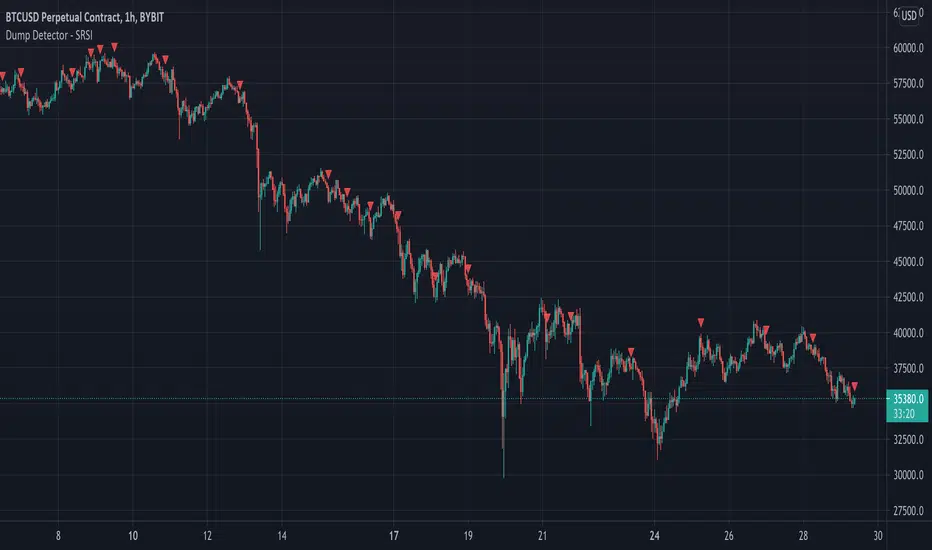
Dump Detector - Stochastic RSIDump Detecter uses Stochastic RSI to detect dumps/downtrends. Can be used as an exit trigger for long bots or an entry trigger for short bots. Change settings to lower timeframe for scalping. Pump signals can be turned on with tickbox.
Default Settings are not the usual Stochastic RSI setup and have been tuned to bitcoin 3hr chart:
Timeframe = 3hrs
smoothK = 3
smoothD = 3
lengthRSI = 6
lengthStoch = 27
src = close
LordPepe Stochastic SignalsThis is the Lord Pepe. Howdy. Basic buy/sell indicator to accumulate along a downtrend and release your stack during the uptrend and oversold levels of the stochastic. The buys should be used to stack, and sells indicate levels of profit taking, they do not signal a long term reversal, only < 25% of stack should be released on "OB" signals.
OB - overbought (sell)
OS - oversold (buy)
WaveTrend Oscillator + Divergence + Direction Detection +AlertsMake this version of the famous WaveTrend indicator has the following characteristics:
- WaveTrend direction detection
- Customizable overbought and oversold level (set by default just like the original version)
- Possibility to modify the length of the channel (set by default same as the original version)
- Possibility of modifying mobile period (set by default same as the original version)
- Show ONLY overbought sales.
- Show all sales.
- Show ONLY purchases in oversold.
- Show all purchases.
- See histogram.
- See half signal.
- Paint Bars.
- Modification of colors.
Alerts:
The indicator has the following alerts:
- Sales in oversold
- All Sales
- Purchases in oversold
- All Purchases
- Purchases / Overbought sales / Sales
- All Sales / Purchases
- Change WT Direction
NOTE: This single indicator should not be taken as a trading strategy is only a tool for the trader that gives a sense of depth market and potential opportunities for purchase / sale which must be evaluated in the context generally used this indicator to look for positions in areas of overbought / sell, also for detecting differences, other aspects such as the direction of Wavetrend, levels, histogram, etc, also provide useful information.
Release Notes: Add a field to change reaction and color change direction WT, is set to 1 as fast (default), better greater number address filter but is slower.
Release Notes: Add a Hidden Divergences detector and Regulars (bulls and the bears), from setup can activate them, also can turn off the labels and leave only the lines, configure it to your liking.
NOTE: SCRIPT IN SPANISH

BH - Candlestick Pattern DetectionThis is a script to help the beginners locate the candle patterns. It has a nice code that can be used in other scripts too. Easy to use with separated functions, simple patterns and complex patterns detections.
I have done some updates at the Candlestick Patterns Identified script by @repo32. Was a good start of my ideia. Tks for sharing repo.
It will be always under constant development but I want to share this first version to know what can be done to get better, improve, get more desired patterns, know what are you guys using that could be helpful.
I still need to check if all patterns are correct.
Any comments, help and suggestions will be appreciated.
Marcos Issler @ Isslerman

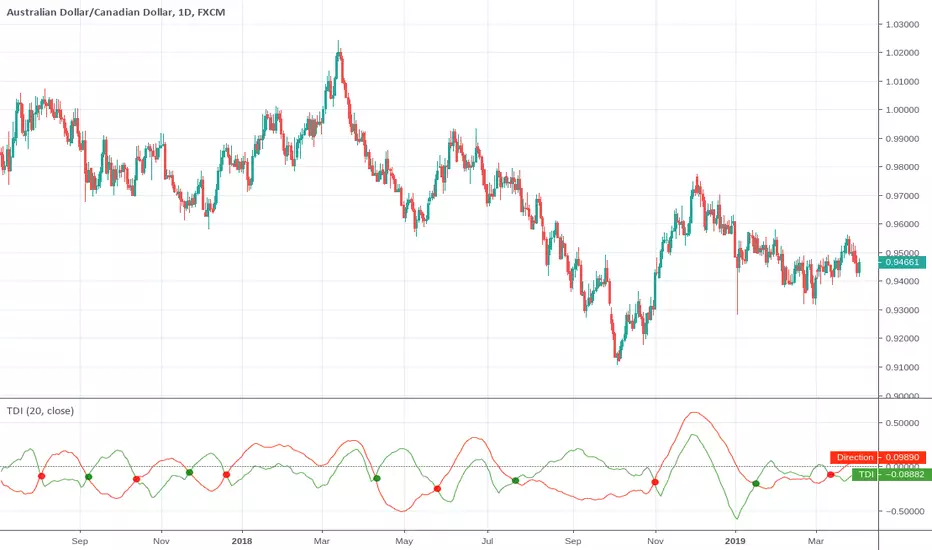
Trend Detection IndexTrend Detection Index indicator script.
This indicator was originally developed by M.H. Pee (Stocks & Commodities V. 19:10 (54-61): Trend Detection Index).
Price Divergence Detector V3 revised by JustUncleLThis is a revised version of the original "Price Divergence Detector by RicardoSantos".
Description:
Price Divergence detection for various methods : RSI, MACD, STOCH, VOLUME, ACC-DIST, FISHER, CCI, BB %B and Ehlers IdealRSI. Both Hidden and Regular Divergences are detected.
Mofidifications:
Revision 3.0 by JustUncleL
Added option to disable/enable Hidden and Regular Divergence
Added new divergence method BB %B (close only)
Added new divergence mothos Ehlers IdealRSI (close only)
Revision 2.0 - by RicardoSantos
References:
Information on Divergence Trading:
www.babypips.com
www.incrediblecharts.com (BB %B)


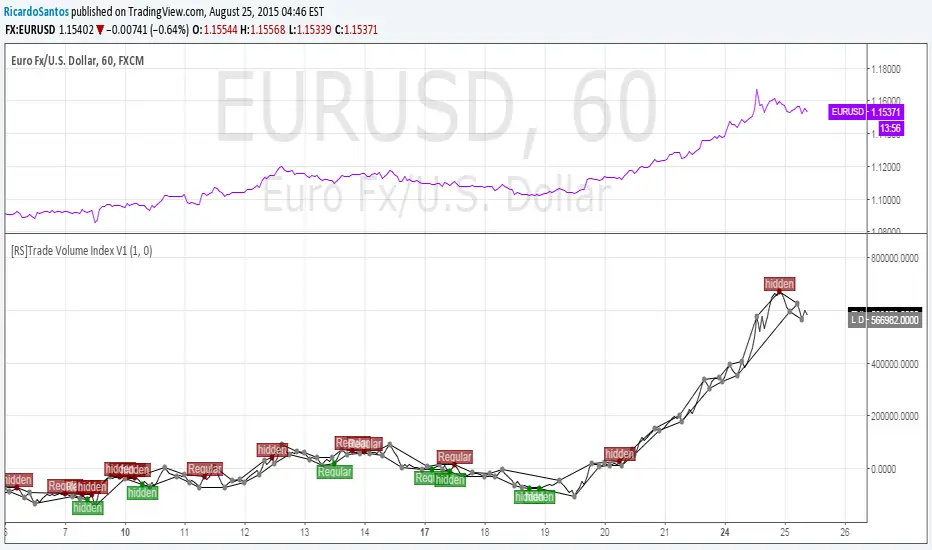
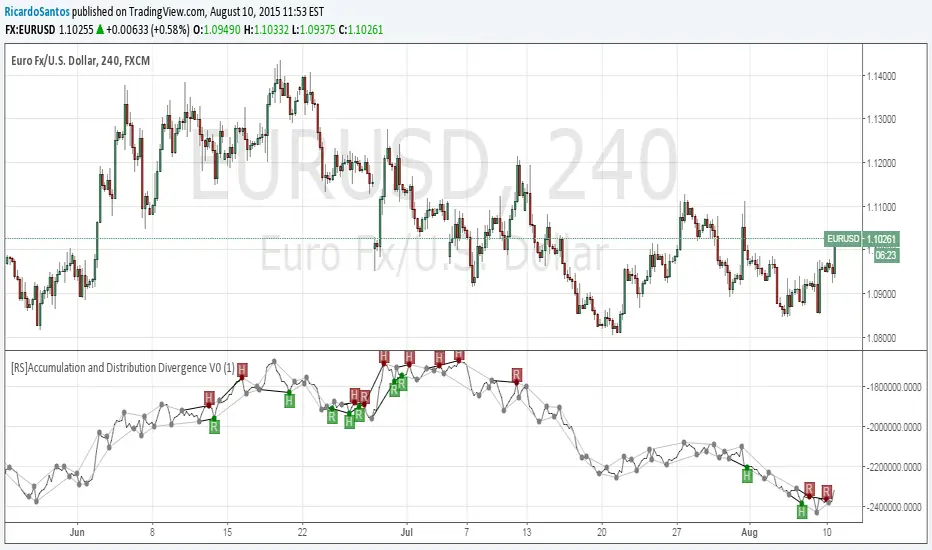
[RS]Accumulation and Distribution Divergence V0EXPERIMENTAL: Accumulation and Distribution Divergence detection.
[RS]MACD Divergence V0EXPERIMENTAL:
MACD Divergence detection.
looks like macd is more prone for missing the extremes in price then the rsi due to lag.

FREE INDICATOR: POLARIZED FRACTAL EFFICIENCYLooking for something other than a moving average to help determine not only a trend's strength, but also it's direction? Try PFE!
PFE was developed by Hans Hannula that was invented to determine price efficiency over a user-defined time period.
The Polarized Fractal Efficiency indicator is, in the essence, an exponentially smoothed ratio of the length of two lines: (1) of a straight line between today’s close and the close Period days ago, and (2) of a broken line connecting all Close points between today and Period days ago. The indicator output varies between -100 and 100. The theory behind this indicator is that if it is >50 (or <-50) then the market is likely to reverse its trend from positive to negative (or from negative to positive).
Other usage:
Securities with a PFE greater than zero are deemed to be trending up, while a reading of less than zero indicates the trend is down. The strengh of the trend is measured by the position of the PFE relative to the zero line. As a general rule, the further the PFE value is away from zero, the stronger and more efficient the given trend is. A PFE value that fluctuates around the zero line could indicate that the supply and demand for the security are in balance and price may trade sideways.
As with all indicators, finding something that works well along side this would be the most beneficial way to use it.
Perhaps something like the Choppiness Index (related idea below) could do the trick.
Grab the source code here: pastebin.com
Installation video by @ChrisMoody here : blog.tradingview.com
