Normalized Comparison - KanNormalized Comparison Indicator
This indicator allows you to compare financial instruments with different price ranges (like Bitcoin and Gold) on the same chart and scale. Using a normalized comparison method, symbols with completely different price levels can be easily compared side by side.
Features
Normalized Display: Normalizes symbols based on your selected start date, allowing you to see how they move from the same starting point
Future/Past Simulation: Shift the comparison data forward or backward by any number of days to identify leading or lagging correlations
Same-Scale Visualization: Even when comparing assets with vastly different prices (e.g., Bitcoin at $70,000 vs Gold at $2,000), the indicator shows both on the same scale
Customizable Settings: Choose your comparison symbol, time shift, line color, and normalization start date
How to Use
Apply the indicator to your primary chart (e.g., Bitcoin)
Select a comparison symbol (e.g., XAUUSD for Gold)
Choose the number of days to shift (positive for future, negative for past)
Set your normalization start date
Analyze how the two assets have performed relative to each other
Delay

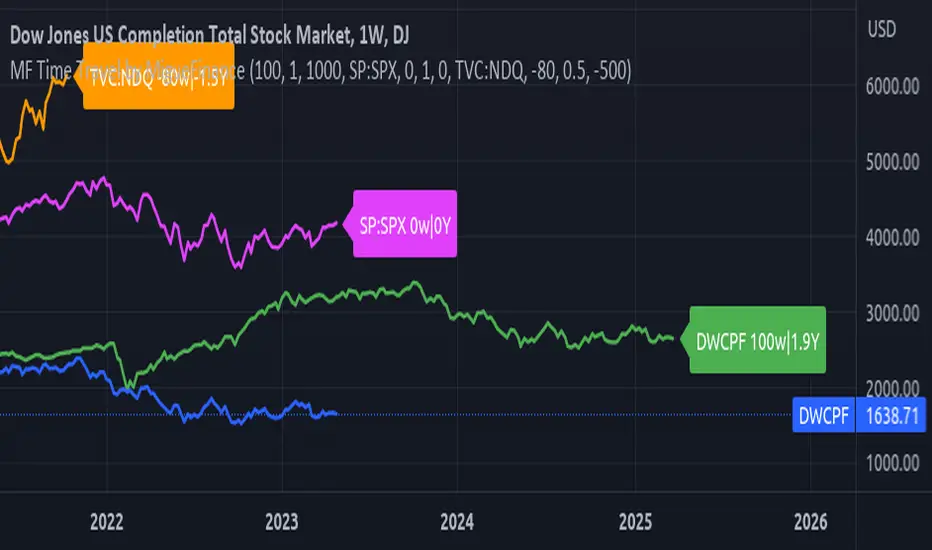
MF Time Travel (Delay or Forward Charts) by MigueFinanceThis indicator allows you to "Time Travel" aka. delay or advance (or forward) the on-screen chart/indicator as well as well as to do the same with other additional charts that can be configured in the settings.
This might be very useful when comparing with other (or the same) indicator in time, if you consider probably an incoming move based on another time performance.
About the Settings:
The moved in time charts can also be expanded or contracted, as well as they can be moved vertically (offset).
To Delay put positive values on the weeks settings, to Advance put Negative values on the same.
The Expansion or Contraction Factor is simply a multiplier of amplitude so you can multiply by number like 0.5, 2, etc
The Vertical Offset simply moves up and down the indicator.
The Labels will also tell you the number of weeks and years that were changed so as to have a reference, as well as the indicator being used.
(16) DRAGON-X VS-148The Dragon is an experimental indicator that is currently still under development. I called this indicator the Dragon because, not unlike the movie and book; “How to train your Dragon”, you must adjust or dial in this indicator (train it) to get good entry/exit signals out of it, for each individual equity you want to examine. That is not nearly as convenient as all of my other indicators, but the extra work can be worth the effort. The benefits of this indicator are its responsive nature and it forecasting ability. In the inputs the algorithm allows you to select a forecasting option. Forecasting in this instance merely means shifting the resulting indicator projections forward by altering the algorithm to be looser. It can fairly accurately forecast 1 to 3 bars forward. The more forward you set the adjustment the less accurate it becomes. John Ehlers was the first person to transform Dr. Voss’s algorithm into an equity trading indicatory. His observations about forecasting are important. While the Voss filter “can’t it really look into the future, it can provide signals in advance of signals used by other traders – and that may be enough to create a successful trading edge.”
As the image below demonstrates the Dragon does indeed get you into and our of trades in advance of even our best indicator, Genie-Cycles, shown below the Dragon.
The second issue regarding this indicator is, it’s not easy to understand the rational behind it. The Dragon filter is a direct derivative of the Voss Predictive Filter. Dr. Voss describes this filter as “A filter for universal real-time prediction of band-limited signals” This algorithm was developed to provide greater resolution and insight into a wide class of signals generated by deterministic or stochastic systems. It attempts to remove group and phase delays from the Weighted Moving Average output. One of Dr. Voss’s fields of endeavor is working to make MRI images clearer. This is done by extracting the first harmonic of the output using a bandpass filter and then applying a "negative-delay" formula to it. Forecasting financial time series is regarded as one of the most challenging applications of time series prediction due to their dynamic nature.
We have more information on our website describing this indicator as well as three links to reference articles that describe the scientific concept underpinning this indicator.
In the image below, the Dragon Indicator is plotted below the price chart so you can see the correlation between the two. If you examine the last two entry signals you can clearly see that the Dragon flags an entry position very early in the turning point transition shift. Actually, at points in the chart that do not in any way look like the end of the last down leg of the cycle. This get you into a trade before most of the rest of the other market competitors.
We consider the Dragon to still be under development. It requires a narrow band width of input data, for the output to generate reliably accurate signals. Market data has unlimited bandwidth.
Our future development of this indicator will take two center of gravity filters and first narrow that resulting bandwidth by utilizing a pass band filter. We will than use this data as an input to the Voss algorithm. We will advise all of our user when this updated version is available. Currentely this experimental version is only available to our unlimited members.
Access this Genie indicator for your Tradingview account, through our web site. (Links Below) This will provide you with additional educational information and reference articles, videos, input and setting options and trading strategies this indicator excels in.

Ehlers Triple Delay-Line DetrenderThis indicator was originally developed by John F. Ehlers (Stocks & Commodities , V.18:7 (July, 2000): "Optimal Detrending").
Mr. Ehlers applied the ideas of the radar systems for the financial time series detrending.
Mr. Ehlers constructed the Triple Delay-Line Canceller first, then smoothed it with the Modified Optimum Elliptic Filter with minimal lag. The smoothed detrended signal is smoothed again with the Modified Optimum Elliptic Filter to obtain signal line.
As result, the crossings of the two indicator lines catch every major cyclic move and the detrender itself can be used as the first step in more sophisticated analyses.
