RSI-ma Wave Sensor (Free ver.)RSI-ma Wave Sensor is a 3-line RSI-based oscillator (Main / Middle / Wave) that shows trend direction, momentum and higher timeframe context in a single pane.
Compared with many classic MA/RSI tools it aims to:
• react with very low lag (almost real-time feeling)
• detect trend direction early
• avoid “overbought/oversold sticking” so you can hold calmly until the trend really starts to end
This Free version is a DAY trade preset for the 15m chart:
• Main = 14, Middle = EMA 9, Wave = EMA 28
• 1h higher timeframe wave sensor included
• good for learning / testing how to read trends with RSI waves
Daytrade

Weekend Box ( Support All Timeframe )Weekend Box ( Support All Timeframe )
Support manually adjust the Timezone to get better result of comparison.
Support manually adjust the Bar so that Weekend Box can be shifted any number of bars by your choice.
Maximum options for your better trading.

RightFlow Universal Volume Profile - Any Market Any TimeframeSummary in one paragraph
RightFlow is a right anchored microstructure volume profile for stocks, futures, FX, and liquid crypto on intraday and daily timeframes. It acts only when several conditions align inside a session window and presents the result as a compact right side profile with value area, POC, a bull bear mix by price bin, and a HUD of profile VWAP and pressure shares. It is original because it distributes each bar’s weight into multiple mid price slices, blends bull bear pressure per bin with a CLV based split, and grows the profile to the right so price action stays readable. Add to a clean chart, read the table, and use the visuals. For conservative workflows read on bar close.
Scope and intent
• Markets. Major FX pairs, index futures, large cap equities and ETFs, liquid crypto.
• Timeframes. One minute to daily.
• Default demo used in the publication. SPY on 15 minute.
• Purpose. See where participation concentrates, which side dominated by price level, and how far price sits from VA and POC.
Originality and usefulness
• Unique fusion. Right anchored growth plus per bar slicing and CLV split, with weight modes Raw, Notional, and DeltaProxy.
• Failure mode addressed. False reads from single bar direction and coarse binning.
• Testability. All parts sit in Inputs and the HUD.
• Portable yardstick. Value Area percent and POC are universal across symbols.
• Protected scripts. Not applicable. Method and use are fully disclosed.
Method overview in plain language
Pick a scope Rolling or Today or This Week. Define a window and number of price bins. For each bar, split its range into small slices, assign each slice a weight from the selected mode, and split that weight by CLV or by bar direction. Accumulate totals per bin. Find the bin with the highest total as POC. Expand left and right until the chosen share of total volume is covered to form the value area. Compute profile VWAP for all, buyers, and sellers and show them with pressure shares.
Base measures
Range basis. High minus low and mid price samples across the bar window.
Return basis. Not used. VWAP trio is price weighted by weights.
Components
• RightFlow Bins. Price histogram that grows to the right.
• Bull Bear Split. CLV based 0 to 1 share or pure bar direction.
• Weight Mode. Raw volume, notional volume times close, or DeltaProxy focus.
• Value Area Engine. POC then outward expansion to target share.
• HUD. Profile VWAP, Buy and Sell percent, winner delta, split and weight mode.
• Session windows optional. Scope resets on day or week.
Fusion rule
Color of each bin is the convex blend of bull and bear shares. Value area shading is lighter inside and darker outside.
Signal rule
This is context, not a trade signal. A strong separation between buy and sell percent with price holding inside VA often confirms balance. Price outside VA with skewed pressure often marks initiative moves.
What you will see on the chart
• Right side bins with blended colors.
• A POC line across the profile width.
• Labels for POC, VAH, and VAL.
• A compact HUD table in the top right.
Table fields and quick reading guide
• VWAP. Profile VWAP.
• Buy and Sell. Pressure shares in percent.
• Delta Winner. Winner side and margin in percent.
• Split and Weight. The active modes.
Reading tip. When Session scope is Today or This Week and Buy minus Sell is clearly positive or negative, that side often controls the day’s narrative.
Inputs with guidance
Setup
• Profile scope. Rolling or session reset. Rolling uses window bars.
• Rolling window bars. Typical 100 to 300. Larger is smoother.
Binning
• Price bins. Typical 32 to 128. More bins increase detail.
• Slices per bar. Typical 3 to 7. Raising it smooths distribution.
Weighting
• Weight mode. Raw, Notional, DeltaProxy. Notional emphasizes expensive prints.
• Bull Bear split. CLV or BarDir. CLV is more nuanced.
• Value Area percent. Typical 68 to 75.
View
• Profile width in bars, color split toggle, value area shading, opacities, POC line, VA labels.
Usage recipes
Intraday trend focus
• Scope Today, bins 64, slices 5, Value Area 70.
• Split CLV, Weight Notional.
Intraday mean reversion
• Scope Today, bins 96, Value Area 75.
• Watch fades back to POC after initiative pushes.
Swing continuation
• Scope Rolling 200 bars, bins 48.
• Use Buy Sell skew with price relative to VA.
Realism and responsible publication
No performance claims. Shapes can move while a bar forms and settle on close. Education only.
Honest limitations and failure modes
Thin liquidity and data gaps can distort bin weights. Very quiet regimes reduce contrast. Session time is the chart venue time.
Open source reuse and credits
None.
Legal
Education and research only. Not investment advice. Test on history and simulation before live use.

LEGEND IsoPulse Fusion Universal Volume Trend Buy Sell RadarLEGEND IsoPulse Fusion • Universal Volume Trend Buy Sell Radar
One line summary
LEGEND IsoPulse Fusion reads intent from price and volume together, learns which features matter most on your symbol, blends them into a single signed Fusion line in a stable unit range, and emits clear Buy Sell Close events with a structure gate and a liquidity safety gate so you act only when the tape is favorable.
What this script is and why it exists
Many traders keep separate windows for trend, volume, volatility, and regime filters. The result can feel fragmented. This script merges two complementary engines into one consistent view that is easy to read and simple to act on.
LEGEND Tensor estimates directional quality from five causally computed features that are normalized for stationarity. The features are Flow, Tail Pressure with Volume Mix, Path Curvature, Streak Persistence, and Entropy Order.
IsoPulse transforms raw volume into two decaying reservoirs for buy effort and sell effort using body location and wick geometry, then measures price travel per unit volume for efficiency, and detects volume bursts with a recency memory.
Both engines are mapped into the same unit range and fused by a regime aware mixer. When the tape is orderly the mixer leans toward trend features. When the tape is messy but a true push appears in volume efficiency with bursts the mixer allows IsoPulse to speak louder. The outcome is a single Fusion line that lives in a familiar range with calm behavior in quiet periods and expressive pushes when energy concentrates.
What makes it original and useful
Two reservoir volume split . The script assigns a portion of the bar volume to up effort and down effort using body location and wick geometry together. Effort decays through time using a forgetting factor so memory is present without becoming sticky.
Efficiency of move . Price travel per unit volume is often more informative than raw volume or raw range. The script normalizes both sides and centers the efficiency so it becomes signed fuel when multiplied by flow skew.
Burst detection with recency memory . Percent rank of volume highlights bursts. An exponential memory of how recently bursts clustered converts isolated blips into useful context.
Causal adaptive weighting . The LEGEND features do not receive static weights. The script learns, causally, which features have correlated with future returns on your symbol over a rolling window. Only positive contributions are allowed and weights are normalized for interpretability.
Regime aware fusion . Entropy based order and persistence create a mixer that blends IsoPulse with LEGEND. You see a single line rather than two competing panels, which reduces decision conflict.
How to read the screen in seconds
Fusion area . The pane fills above and below zero with a soft gradient. Deeper fill means stronger conviction. The white Fusion line sits on top for precise crossings.
Entry guides and exit guides . Two entry guides draw symmetrically at the active fused entry level. Two exit guides sit inside at a fraction of the entry. Think of them as an adaptive envelope.
Letters . B prints once when the script flips from flat to long. S prints once when the script flips from flat to short. C prints when a held position ends on the appropriate side. T prints when the structure gate first opens. A prints when the liquidity safety flag first appears.
Price bar paint . Bars tint green while long and red while short on the chart to mirror your virtual position.
HUD . A compact dashboard in the corner shows Fusion, IsoPulse, LEGEND, active entry and exit levels, regime status, current virtual position, and the vacuum z value with its avoid threshold.
What signals actually mean
Buy . A Buy prints when the Fusion line crosses above the active entry level while gates are open and the previous state was flat.
Sell . A Sell prints when the Fusion line crosses below the negative entry level while gates are open and the previous state was flat.
Close . A Close prints when Fusion cools back inside the exit envelope or when an opposite cross would occur or when a gate forces a stop, and the previous state was a hold.
Gates . The Trend gate requires sufficient entropy order or significant persistence. The Avoid gate uses a liquidity vacuum z score. Gates exist to protect you from weak tape and poor liquidity.
Inputs and practical tuning
Every input has a tooltip in the script. This section provides a concise reference that you can keep in mind while you work.
Setup
Core window . Controls statistics across features. Scalping often prefers the thirties or low fifties. Intraday often prefers the fifties to eighties. Swing often prefers the eighties to low hundreds. Smaller responds faster with more noise. Larger is calmer.
Smoothing . Short EMA on noisy features. A small value catches micro shifts. A larger value reduces whipsaw.
Fusion and thresholds
Weight lookback . Sample size for weight learning. Use at least five times the horizon. Larger is slower and more confident. Smaller is nimble and more reactive.
Weight horizon . How far ahead return is measured to assess feature value. Smaller favors quick reversion impulses. Larger favors continuation.
Adaptive thresholds . Entry and exit levels from rolling percentiles of the absolute LEGEND score. This self scales across assets and timeframes.
Entry percentile . Eighty selects the top quintile of pushes. Lower to seventy five for more signals. Raise for cleanliness.
Exit percentile . Mid fifties keeps trades honest without overstaying. Sixty holds longer with wider give back.
Order threshold . Minimum structure to trade. Zero point fifteen is a reasonable start. Lower to trade more. Raise to filter chop.
Avoid if Vac z . Liquidity safety level. One point two five is a good default on liquid markets. Thin markets may prefer a slightly higher setting to avoid permanent avoid mode.
IsoPulse
Iso forgetting per bar . Memory for the two reservoirs. Values near zero point nine eight to zero point nine nine five work across many symbols.
Wick weight in effort split . Balance between body location and wick geometry. Values near zero point three to zero point six capture useful behavior.
Efficiency window . Travel per volume window. Lower for snappy symbols. Higher for stability.
Burst percent rank window . Window for percent rank of volume. Around one hundred to three hundred covers most use cases.
Burst recency half life . How long burst clusters matter. Lower for quick fades. Higher for cluster memory.
IsoPulse gain . Pre compression gain before the atan mapping. Tune until the Fusion line lives inside a calm band most of the time with expressive spikes on true pushes.
Continuation and Reversal guides . Visual rails for IsoPulse that help you sense continuation or exhaustion zones. They do not force events.
Entry sensitivity and exit fraction
Entry sensitivity . Loose multiplies the fused entry level by a smaller factor which prints more trades. Strict multiplies by a larger factor which selects fewer and cleaner trades. Balanced is neutral.
Exit fraction . Exit level relative to the entry level in fused unit space. Values around one half to two thirds fit most symbols.
Visuals and UX
Columns and line . Use both to see context and precise crossings. If you present a very clean chart you can turn columns off and keep the line.
HUD . Keep it on while you learn the script. It teaches you how the gates and thresholds respond to your market.
Letters . B S C T A are informative and compact. For screenshots you can toggle them off.
Debug triggers . Show raw crosses even when gates block entries. This is useful when you tune the gates. Turn them off for normal use.
Quick start recipes
Scalping one to five minutes
Core window in the thirties to low fifties.
Horizon around five to eight.
Entry percentile around seventy five.
Exit fraction around zero point five five.
Order threshold around zero point one zero.
Avoid level around one point three zero.
Tune IsoPulse gain until normal Fusion sits inside a calm band and true squeezes push outside.
Intraday five to thirty minutes
Core window around fifty to eighty.
Horizon around ten to twelve.
Entry percentile around eighty.
Exit fraction around zero point five five to zero point six zero.
Order threshold around zero point one five.
Avoid level around one point two five.
Swing one hour to daily
Core window around eighty to one hundred twenty.
Horizon around twelve to twenty.
Entry percentile around eighty to eighty five.
Exit fraction around zero point six zero to zero point seven zero.
Order threshold around zero point two zero.
Avoid level around one point two zero.
How to connect signals to your risk plan
This is an indicator. You remain in control of orders and risk.
Stops . A simple choice is an ATR multiple measured on your chart timeframe. Intraday often prefers one point two five to one point five ATR. Swing often prefers one point five to two ATR. Adjust to symbol behavior and personal risk tolerance.
Exits . The script already prints a Close when Fusion cools inside the exit envelope. If you prefer targets you can mirror the entry envelope distance and convert that to points or percent in your own plan.
Position size . Fixed fractional or fixed risk per trade remains a sound baseline. One percent or less per trade is a common starting point for testing.
Sessions and news . Even with self scaling, some traders prefer to skip the first minutes after an open or scheduled news. Gate with your own session logic if needed.
Limitations and honest notes
No look ahead . The script is causal. The adaptive learner uses a shifted correlation, crosses are evaluated without peeking into the future, and no lookahead security calls are used. If you enable intrabar calculations a letter may appear then disappear before the close if the condition fails. This is normal for any cross based logic in real time.
No performance promises . Markets change. This is a decision aid, not a prediction machine. It will not win every sequence and it cannot guarantee statistical outcomes.
No dependence on other indicators . The chart should remain clean. You can add personal tools in private use but publications should keep the example chart readable.
Standard candles only for public signals . Non standard chart types can change event timing and produce unrealistic sequences. Use regular candles for demonstrations and publications.
Internal logic walkthrough
LEGEND feature block
Flow . Current return normalized by ATR then smoothed by a short EMA. This gives directional intent scaled to recent volatility.
Tail pressure with volume mix . The relative sizes of upper and lower wicks inside the high to low range produce a tail asymmetry. A volume based mix can emphasize wick information when volume is meaningful.
Path curvature . Second difference of close normalized by ATR and smoothed. This captures changes in impulse shape that can precede pushes or fades.
Streak persistence . Up and down close streaks are counted and netted. The result is normalized for the window length to keep behavior stable across symbols.
Entropy order . Shannon entropy of the probability of an up close. Lower entropy means more order. The value is oriented by Flow to preserve sign.
Causal weights . Each feature becomes a z score. A shifted correlation against future returns over the horizon produces a positive weight per feature. Weights are normalized so they sum to one for clarity. The result is angle mapped into a compact unit.
IsoPulse block
Effort split . The script estimates up effort and down effort per bar using both body location and wick geometry. Effort is integrated through time into two reservoirs using a forgetting factor.
Skew . The reservoir difference over the sum yields a stable skew in a known range. A short EMA smooths it.
Efficiency . Move size divided by average volume produces travel per unit volume. Normalization and centering around zero produce a symmetric measure.
Bursts and recency . Percent rank of volume highlights bursts. An exponential function of bars since last burst adds the notion of cluster memory.
IsoPulse unit . Skew multiplied by centered efficiency then scaled by the burst factor produces the raw IsoPulse that is angle mapped into the unit range.
Fusion and events
Regime factor . Entropy order and streak persistence form a mixer. Low structure favors IsoPulse. Higher structure favors LEGEND. The blend is convex so it remains interpretable.
Blended guides . Entry and exit guides are blended in the same way as the line so they stay consistent when regimes change. The envelope does not jump unexpectedly.
Virtual position . The script maintains state. Buy and Sell require a cross while flat and gates open. Close requires an exit or force condition while holding. Letters print once at the state change.
Disclosures
This script and description are educational. They do not constitute investment advice. Markets involve risk. You are responsible for your own decisions and for compliance with local rules. The logic is causal and does not look ahead. Signals on non standard chart types can be misleading and are not recommended for publication. When you test a strategy wrapper, use realistic commission and slippage, moderate risk per trade, and enough trades to form a meaningful sample, then document those assumptions if you share results.
Closing thoughts
Clarity builds confidence. The Fusion line gives a single view of intent. The letters communicate action without clutter. The HUD confirms context at a glance. The gates protect you from weak tape and poor liquidity. Tune it to your instrument, observe it across regimes, and use it as a consistent lens rather than a prediction oracle. The goal is not to trade every wiggle. The goal is to pick your spots with a calm process and to stand aside when the tape is not inviting.

Mag7 Day-Trade Recommender & Status Board (v6)📌 Mag7 Day-Trade Recommender & Status Board (v6)
Overview
This indicator system is designed to generate high-probability intraday trading signals on the Magnificent Seven stocks (AAPL, MSFT, NVDA, GOOGL, AMZN, TSLA, META). It combines price action with VWAP, EMA trend filters, and volume confirmation to highlight potential long and short setups.
It comes in two versions:
Day-Trade Recommender (single-symbol) – overlays on one chart, plotting entries, stops, and targets.
Status Board (multi-symbol scanner) – a dashboard table showing signal status across all Mag7 stocks at once.
Core Logic
VWAP Crossovers: Signals are triggered when price crosses above (LONG) or below (SHORT) VWAP.
EMA Trend Filter: Confirms trades only when price is aligned with the EMA50 slope (optional).
Volume Spike Filter: Requires current volume to exceed the 20-bar average by a set multiplier (default: 1.2×).
ATR-Based Risk/Reward: Stops are placed using ATR multiples, with profit targets set at 1R and 2R.
Session Filter: Optionally restricts signals to Regular Trading Hours (09:30–16:00).
****************** Note: Not financial advice. For educational purposes only. /b]*******************

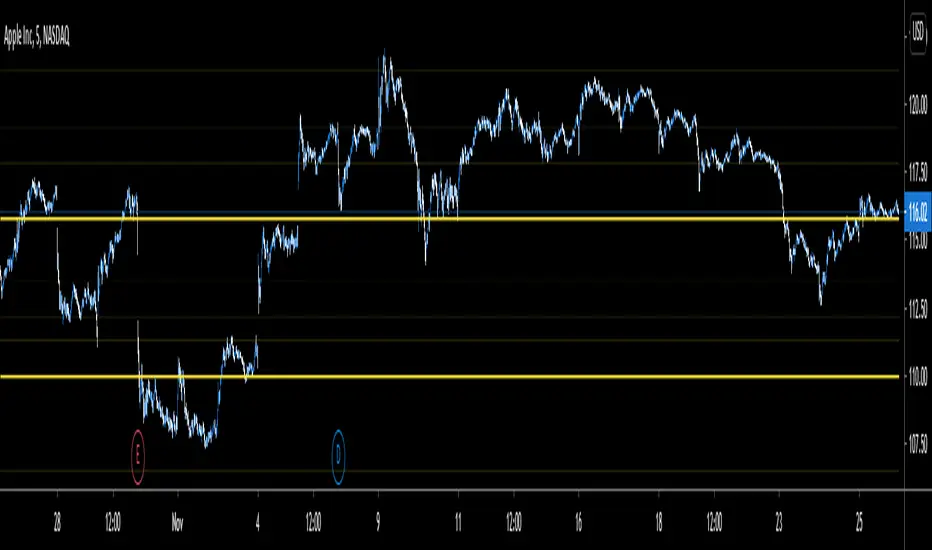
Intraday Fibs RetracementFibonacci (Fibs) levels are often used by traders as a way to find support and resistance, based on the Fibonacci sequence. These levels are widely used in technical analysis to identify potential reversal points in the price of an asset.
Fibs retracement draws lines at these Fibs level between a significant high and low point on a price chart.
What it shows:
This indicator will automatically draw Fibs Retracement Levels on your chart without any manual work.
It is designed to be used for day trading, especially in scenarios where a ticker gaps up/down large compared to the prior day close. (i.e. scenario where the difference of day's open and prior day close is large)
The drawing will happen on each trading day the moment trading hours open, and will NOT draw during pre-market and post-market.
User can see the line of each Fibs level, labelled with the Fib percentage and price value for the corresponding levels.
User will specify a start and end point of Fibs and based on the choice the indicator will automatically compute the other user defined Fibs levels and display on the chart.
How to use it:
The Fib levels drawn can be a potential support and resistance zone. Therefore in scenario where you already have a position and are approaching one of these levels it could be a point to close out some or all the position as you are approaching a resistance. On the other hand when price do approach these levels you could enter a position for a reversal trade. These are few ways to use the indicator but there are other ways that can be used, which can be found out by researching "Fibonacci (Fibs) Retracement".
In the example on the chart you can see a price bounce from the 0.7886 Fibs level on this particular day, where the price gapped up and was coming down after market hours opened.
Key settings:
1. Fibs Retracement Start and end Point: User selects where the Fibs levels should be drawn.
Available Options are:
Start Points:
Market Open
Market Open High (Dependent on the time frame you are on)
Pre-market High
Day's High
End Points:
Previous Day Close
Previous Day Low
Previous Day High
Pre-market Low (Current Day)
Day's Low
2. Custom Fib Levels: User can manually enter the Fib levels they want to see. (Max 9)
Default values are: 0,0.236,0.382,0.5,0.618,0.786,1,1.618,2.618.
3. Display settings: User can specify the line colour, thickness and style.
4. Label Setting: User can choose to turn on/off the labels for the each Fibs Level. Label will show the fib percentage and the corresponding price. User can also choose the location of the labels, defined by an offset from the current candle.
----------------------------------------------------------------------
If anything is not clear please let me know!

Ultimate Volatility Scanner by NHBprod - Requested by Client!Hey Everyone!
I created another script to add to my growing library of strategies and indicators that I use for automated crypto and stock trading! This strategy is for BITCOIN but can be used on any stock or crypto. This was requested by a client so I thought I should create it and hopefully build off of it and build variants!
This script gets and compares the 14-day volatility using the ATR percentage for a list of cryptocurrencies and stocks. Cryptocurrencies are preloaded into the script, and the script will show you the TOP 5 coins in terms of volatility, and then compares it to the Bitcoin volatility as a reference. It updates these values once per day using daily timeframe data from TradingView. The coins are then sorted in descending order by their volatility.
If you don't want to use the preloaded set of coins, you have the option of inputting your own coins AND/OR stocks!
Let me know your thoughts.

JJ Open High and Open Low FinderThis script identifies candles where the open price matches the high price (Open High) and where the open price matches the low price (Open Low). It highlights these candles with labels directly on the chart, making it easy for traders to spot these conditions in real-time.
Features :
- Red "OH" label below candles for Open High.
- Green "OL" label above candles for Open Low.
Use this tool to enhance your trading insights.
** Disclaimer **: This script is for educational purposes only and should not be considered financial advice.

Daily PlayDaily Play Indicator
The Daily Play Indicator is a clean and versatile tool designed to help traders organize and execute their daily trading plan directly on their charts. This indicator simplifies your workflow by visually displaying key inputs like market trend, directional bias, and key levels, making it easier to focus on your trading strategy.
Features
Dropdown Selection for Trend and Bias:
• Set the overall market trend (Bullish, Bearish, or Neutral) and your directional bias (Long, Short, or Neutral) using intuitive dropdown menus. No more manual typing or guesswork!
Key Levels:
Quickly input and display the Previous Day High and Previous Day Low. These levels are essential for many trading strategies, such as breakouts.
Real-Time News Notes:
Add a quick note about impactful news or market events (e.g., “Fed meeting today” or “Earnings season”) to keep contextual awareness while trading.
Simple On-Chart Display:
The indicator creates a “table-like” structure on the chart, aligning your inputs in an easy-to-read format. The data is positioned dynamically so it doesn’t obstruct the price action.
Customisable Visual Style:
Simple labels with clear text to ensure that your chart remains neat and tidy.
----
Use Case
The Daily Play Indicator is ideal for:
• Day traders and scalpers who rely on precise planning and real-time execution.
• Swing traders looking to mark critical levels and develop a trade plan before the session begins.
• Anyone who needs a structured way to stay focused and disciplined during volatile market conditions.
By integrating this tool into your workflow, you can easily align your daily preparation with live market action.
----
How to Use
Open the indicator settings to configure your inputs:
• Trend: Use the dropdown to choose between Bullish, Bearish, or Neutral.
• Bias: Select Long, Short, or Neutral to align your personal bias with the market.
• Previous Day Levels: Enter the High and Low of the previous trading session for key reference points.
• News: Add a short description of any relevant market-moving events.

ToxicJ3ster - Day Trading SignalsThis Pine Script™ indicator, "ToxicJ3ster - Signals for Day Trading," is designed to assist traders in identifying key trading signals for day trading. It employs a combination of Moving Averages, RSI, Volume, ATR, ADX, Bollinger Bands, and VWAP to generate buy and sell signals. The script also incorporates multiple timeframe analysis to enhance signal accuracy. It is optimized for use on the 5-minute chart.
Purpose:
This script uniquely combines various technical indicators to create a comprehensive and reliable day trading strategy. Each indicator serves a specific purpose, and their integration is designed to provide multiple layers of confirmation for trading signals, reducing false signals and increasing trading accuracy.
1. Moving Averages: These are used to identify the overall trend direction. By calculating short and long period Moving Averages, the script can detect bullish and bearish crossovers, which are key signals for entering and exiting trades.
2. RSI Filtering: The Relative Strength Index (RSI) helps filter signals by ensuring trades are only taken in favorable market conditions. It detects overbought and oversold levels and trends within the RSI to confirm market momentum.
3. Volume and ATR Conditions: Volume and ATR multipliers are used to identify significant market activity. The script checks for volume spikes and volatility to confirm the strength of trends and avoid false signals.
4. ADX Filtering: The ADX is used to confirm the strength of a trend. By filtering out weak trends, the script focuses on strong and reliable signals, enhancing the accuracy of trade entries and exits.
5. Bollinger Bands: Bollinger Bands provide additional context for the trend and help identify potential reversal points. The script uses Bollinger Bands to avoid false signals and ensure trades are taken in trending markets.
6. Higher Timeframe Analysis: This feature ensures that signals align with broader market trends by using higher timeframe Moving Averages for trend confirmation. It adds a layer of robustness to the signals generated on the 5-minute chart.
7. VWAP Integration: VWAP is used for intraday trading signals. By calculating the VWAP and generating buy and sell signals based on its crossover with the price, the script provides additional confirmation for trade entries.
8. MACD Analysis: The MACD line, signal line, and histogram are calculated to generate additional buy/sell signals. The MACD is used to detect changes in the strength, direction, momentum, and duration of a trend.
9. Alert System: Custom alerts are integrated to notify traders of potential trading opportunities based on the signals generated by the script.
How It Works:
- Trend Detection: The script calculates short and long period Moving Averages and identifies bullish and bearish crossovers to determine the trend direction.
- Signal Filtering: RSI, Volume, ATR, and ADX are used to filter and confirm signals, ensuring trades are taken in strong and favorable market conditions.
- Multiple Timeframe Analysis: The script uses higher timeframe Moving Averages to confirm trends, aligning signals with broader market movements.
- Additional Confirmations: VWAP, MACD, and Bollinger Bands provide multiple layers of confirmation for buy and sell signals, enhancing the reliability of the trading strategy.
Usage:
- Customize the input parameters to suit your trading strategy and preferences.
- Monitor the generated signals and alerts to make informed trading decisions.
- This script is made to work best on the 5-minute chart.
Disclaimer:
This indicator is not perfect and can generate false signals. It is up to the trader to determine how they would like to proceed with their trades. Always conduct thorough research and consider seeking advice from a financial professional before making trading decisions. Use this script at your own risk.

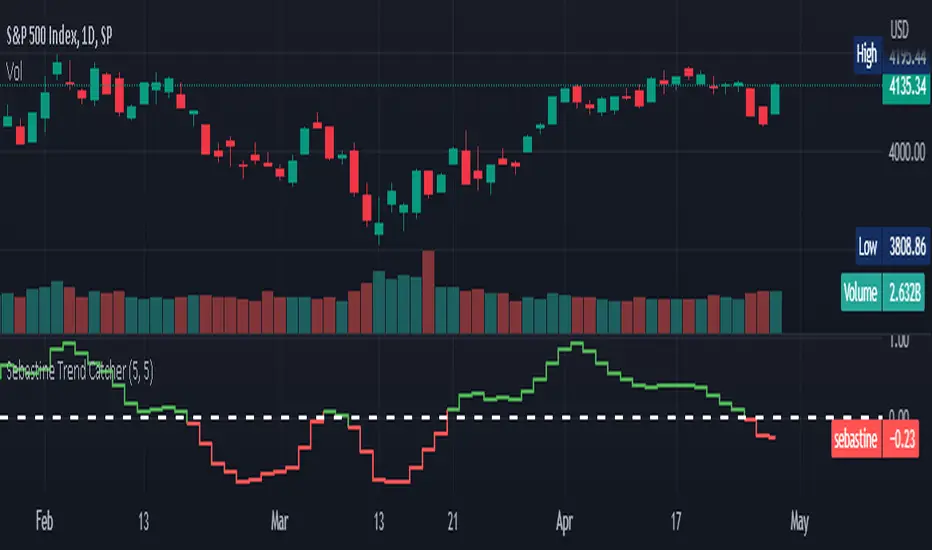
Sebastine Trend CatcherSebastine Trend Catcher captures trends in any time frame in a very simple fashion. Green line crossing up above the signal zero line is uptrend. Red line crossing down the signal zero line is downtrend. The indicator line is presented by default as a step line, which gives an idea on how the trend moves inside the bigger trend. But it should be specifically understood that a trend starts only when the indicator crosses the signal zero line. The ups and downs in the indicator step line until crossing signal zero line is only small corrections and bounces inside a trend. Sebastine trend catcher captures trends smoothing prices in 2 steps. The indicator banks profusely on the idea of jackvmk’s Heiken Ashi Candles. The indicator presented in a centred oscillator fashion in a bottom panel helps understand the main trend and its different shades inside the trend in a clearly discernible manner with sharp entry signals when crossing zero line. The indicator could be used from Daytrading to Investment Trading. As usual this indicator too could produce overshoots and error signals and be better used with other indicators. The settings can be varied and experimented for any given scrip, timeframe or stock exchange.
kaptanFantastik[Take Profit and Stop Loss Finder]Hello all,
It's ATR based active take profit & stop loss finder.
You can set multipliers for taking profit and stop losing and you can change the price source for the calculation. Also, you can change the ATR level.
Defaults are my best settings. 2.2x for taking profit and 1.5x for stop losing. Open price is the source. Also, I think 5 ATR is the best for day and swing trade.
Levels are determined according to the open prices (This is because we can enter the position after our other indicators give the signal following the close price. Yet, you can change it). Since it's active and based on my calculation with ATR values, percentages for the taking profits and stop losing may change. Because of this, you need to note the take profit and stop lose prices after your entry price level is determined by the other indicators for the best success rates.
It can be used in any time frame with the other indicators to determine the best entry points. For example, 3 EMA levels with 5,8 and 13 is good option for the entry. You can enter the position when 5 crosses up 8 and both are above the 13. You can also use custom more advanced buy/sell indicators with this one for entry points.
It can be used with any asset from cryptocurrency to the stocks, from forex to gold etc.
Hint: You can set your levels lower than the take profit prices to maximize the success rate.
Note: Market should be open for the positions.
Example trade on the 5-minute timeline.
The below chart has both my custom indicator and the 3 EMAs mentioned above.
Trade 1: Entry price: 19191, Take Profit: 19276. Profit 0.44%
Trade 2: Entry price: 19189, Take Profit: 193009. Profit 0.625%
Türkçe bilen kullanıcılar için açıklama
Herkese merhabalar,
ATR tabanlı aktif kar al ve zararı durdur bulucu.
Kar almak ve zararı kesmek için çarpanlar belirleyebilir ve hesaplama için fiyat kaynağı değiştirebilirsiniz. Ayrıca, ATR seviyesini de değiştirebilirsiniz.
Varsayılanlar benim en iyi ayarlarım. Kar almak için 2,2 kat ve zararı durdurmak için 1,5 kat. Açılış, fiyat kaynağıdır. Ayrıca, 5 ATR'nin günlük ve kısa vade (swing trade) için en iyisi olduğunu düşünüyorum.
Seviyeler açılış fiyatına göre belirlenir (Çünkü diğer göstergelerimiz kapanış fiyatının ardından sinyal verdikten sonra pozisyona girebiliyoruz. Yine de bunu değiştirebilirsiniz). Aktif olduğu için ve ATR değerleri ile yaptığım hesaplamaya göre kar alma ve zarar kes yüzdeleri değişebilir. Bu nedenle, en iyi başarı oranları için; giriş fiyat seviyeniz diğer göstergeler tarafından belirlendikten sonra kar al ve zararı durdur fiyatlarını not etmeniz gerekir.
En iyi giriş noktalarını belirlemek için diğer göstergelerle herhangi bir zaman diliminde kullanılabilir. Örneğin, 5,8 ve 13 ile 3 EMA seviyesi giriş için iyi bir seçenektir. 5, 8'i geçtiğinde ve her ikisi de 13'ün üzerinde olduğunda pozisyona girebilirsiniz. Giriş noktaları için bununla birlikte daha gelişmiş özel al/sat göstergelerini de kullanabilirsiniz.
Kripto paradan hisse senetlerine, forexten altına vb. her türlü varlıkla kullanılabilir.
İpucu: Başarı oranını en üst düzeye çıkarmak için seviyelerinizi kar alma fiyatlarından daha düşük ayarlayabilirsiniz.
Not: Pozisyonlar için piyasa açık olmalıdır.
5 dakikalık zaman çizilgesinde örnek işlem.
Yukarıdaki örnek grafikte hem özel indikatörüm hem de yukrıda belirtilen 3 EMA var.
İşlem 1: Giriş fiyatı: 19191, Kazanç Al: 19276. Kar %0.44
İşlem 2: Giriş fiyatı: 19189, Kazanç Al: 193009. Kar %0.625


FCPO IntradayThis script is specially developed for the reference of Crude Palm Oil Futures ( CPO ) market traders.
Before using this script, traders need to know a few important things, namely:
1. Use of this script is limited to the Crude Palm Oil Futures ( CPO ) market only;
2. The appropriate time-frame for the purpose of using this script is 30 minutes.
Procedures for using indicators.
1. The line on the trading day will only be known after the first candle is completed, i.e. at 10:59:59 am;
2. Then, key in order.
Entry.
The recommended max Entry is once Long and once Short only on the same day.
Long.
1. Traders can only make a purchase when the market price hits the green line;
2. If traders hold a long position, traders can make a sale to close the long position when the price hits the blue line.
Short.
1. Traders can only make a sale when the market price hits the red line;
2. If traders hold a short position, traders can make a purchase to close the short position when the price hits the orange line.

Retail Bomber MK1Handydandy tool to wait for the whales to wake up and start trading.
Each Zone has a schedule (call it market session) and pumps and dumps can be seen on specific times.
And for each zone you can either Highlight the background of just the start time, the whole session, or color the bars instead of changing the background.
Each zone is already set for a specific market open (session open): ASIA, UK, SYDNEY, NY + other 2 extra zones.
All of this is customisable 🙂
To set the time configuration, it goes like this:
1230:1330:1234567
1230:1330 is the period of time you want to study
1234567 are the days of the week, where 1=Sunday...And you fall on 7=Saturday
Example: If we want to study the same ranges from Monday to Friday only, it goes like: 1230 1330:23456
Colors can be editable
Labels for each session can be changed too.
Still testing it.

4H Crypto RoycerThis indicator includes simple moving averages (21,50,200) and exponential moving averages (10,144) and has the ability to show this data on the chart with the approval of the user.
The indicator, which controls the intersections with the formulas it contains, can display the Golden Cross and Death Cross warnings to the user on the chart.
It draws a band on the chart with the support area calculations and in these band calculations; blends simple moving and exponential moving averages and smooths them by 1.5%.
It is used as a signal trigger in band overruns by replacing the lower and upper bands by calculation.
While one of our signal triggers is this band, our other variable is 50 simple moving averages.
Inspired by Kıvanç Özbilgiç's Supertrend indicator, the formula was updated using MA50 and 15% Stop-Loss instead of using atr multiplier.
Our chart has been tested in crypto currencies on 4 hour candles, so "4H" has been added to the beginning of the name.
We recommend using the indicator, buy / sell signals and the support band on the 4-hour charts.

F_ You Money MakerThe FYMM is a combination of custom stochastics and an SMA cloud. The idea is when the bullish stochastic crosses over the bearish stochastic and a cross occurs on the cloud it will alert you. The indicator is slightly leading so you'll need to be careful and use near technical levels such as support and resistance or trend lines. Up arrow means enter a long down arrow means enter a short. Again, use this around technicals.
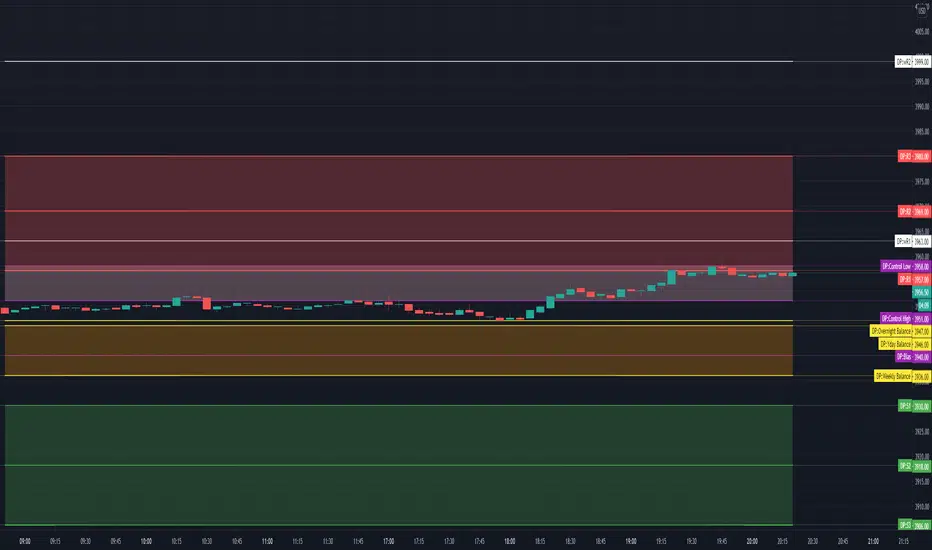
TV Day Plan Template 1This is a template for daytraders, swing traders, supply and demand traders, and even swing traders. As traders we are always scanning charts for levels and zones. This template makes it easy and convenient to find, change, and chart levels. As a daytrader, I will use this daily. I always have daily and weekly targets in mind. This will ensure I don't lose track of the bigger picture while trading the smaller moves. Levels in this chart are not auto calculated. They are manually input. This script is a quick and convenient way to chart multiple levels without having to go through each drawing, change the settings, and then redraw the level. Currently this will only save levels for one ticker. A workaround is to use multiple instances and then hide the ones not in use. Another way is to use the second part to this script, Day Plan Levels Template 2. If only using one instance, you can save the levels as default. This will save them. However, if saving levels as default while using multiple instances of this indicator, the other levels will erase. The way that I use this that I have daily levels for #ES in one instance and then daily levels for #NQ in another instance.
This script is very customizable
Options include
On/Off Toggles
Light/Heavy Versions - Light versions does not plot. Heavy version will plot and show levels in info bar and price axis
Balance Levels
Control Levels
3 Support and 3 Resistance levels for daily and weekly
2 Support and 2 Resistance Clouds
Balance and Control Clouds
"0" value disables and hides levels
Ehler Fisher applied on distance EMAThis is an improved version of Fisher, which use as a source the distance from EMA , compared to the initial source which was on the close of a candle.
It can be used in any market, any time frame .
For conditions we have multiple conditions for the logic, in this case initially if our fisher is above 0 is a long direction ,if its belowe 0 its a short direction.
Also we can improve this condition even further, in this case if we cross up our previous line its a buy signal, and if we cross down its a sell signal.
For best usage combine the cross together with the position of fisher respecting the 0.
If you have any other questions, let me know with a private message.

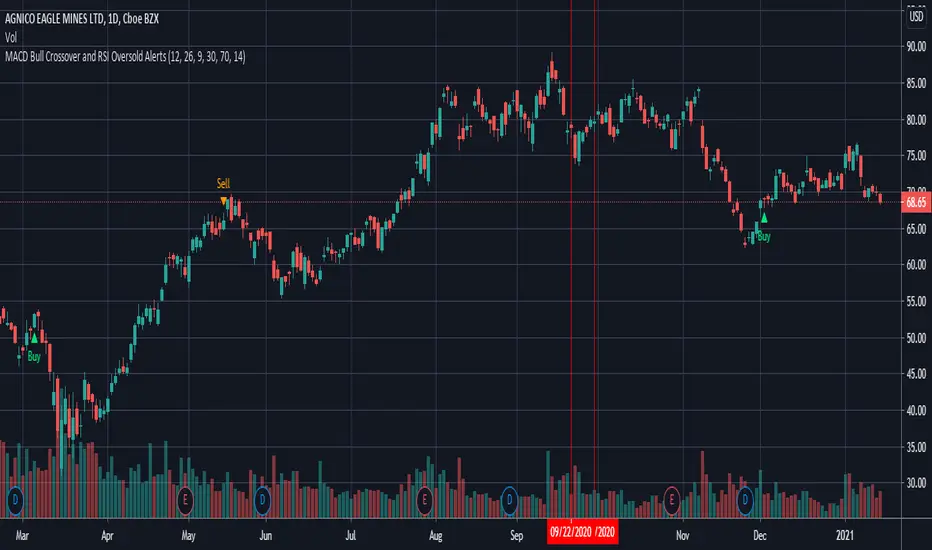
MACD Bull Crossover and RSI Oversold - AlertsHello everyone, these are the alerts for my previous "MACD Bull Crossover and RSI Oversold" Long Strategy. This version currently does not support stoploss and takeprofit alerts but the next update will.
CRYPTO Trend Direction Multiple EMA'sToday I bring an indicator specialized in crypto markets.
Its made of multiples EMA : very fast, fast, normal, slow, very slow
The logic behind its simple :
For long : we check that the EMA are in ascending order like EMA 5 > EMA 10 > EMA 20 .... and at the same time that last close of candle is above all of them.
For short : we check that the EMA are in descending order like EMA 5 < EMA 10 < EMA 20 .... and at the same time last close of candle is below all of them.
It can be used with all time frames.
Enjoy it !

Yearly Levels for Day TradersThe above is the five minutes chart for $aapl
The script is useful in identifying price levels for the short term trading. The inputs are based on Fibonacci ratios but on yearly basis.
You will need to enter the pair ratio for where the stock is between ( I will show you).
Those pairs are as follows:
R1/R2
(0/0.23)
(.23/.38)
(.38/.61)
(.61/1)
(1/1.61)
(1.61/2.61)
(2.61/4.23)
(4.23/6.859)
(6.85/11.08)
(11.08/17.94)
(17.94/29.05)
(29.05/46.95)
(46.95/75.99)
(75.99/122.99)
I personally added the indicator multiple times to a template and put in all the pairs so I do not have to enter the pair each time.
The script does not tell you which level is a bottom or a top. Your experience matters.
If you are interested please PM me the username:
Day ATR H/L + Yesterday H/L + Today H/L - divinechartistNow you can monitor Yesterday's high and low on a small time frame, You no need to switch time frame every time.
Also, you can monitor support and resistance base on Day's ATR (Default Value is 14)
and also we used EMA of 21 for small-time trand identify.
This indicator helps you to find the best trade near to support and resistance. Using this indicator you can enter in trand with small STOPLOSS and for a BIG PROFIT.
EX :
If your current price is below 21EMA and also broke yesterday's low, so its probability to go more down.
Same, If the price is above 21EMA and the price broke yesterday's high so probability it's going more UP.
Also, you can book profit and set STOPLOSS base on ATR value.
if the price above or near TOP-ATR it's mean it's not the best price to buy, You can book a profit at this price or try to find short sell trade.
Same as if price below BOTTOM-ATR it's mean it's not the best price to sell, You can book a profit at this price or try to find buy trade.
