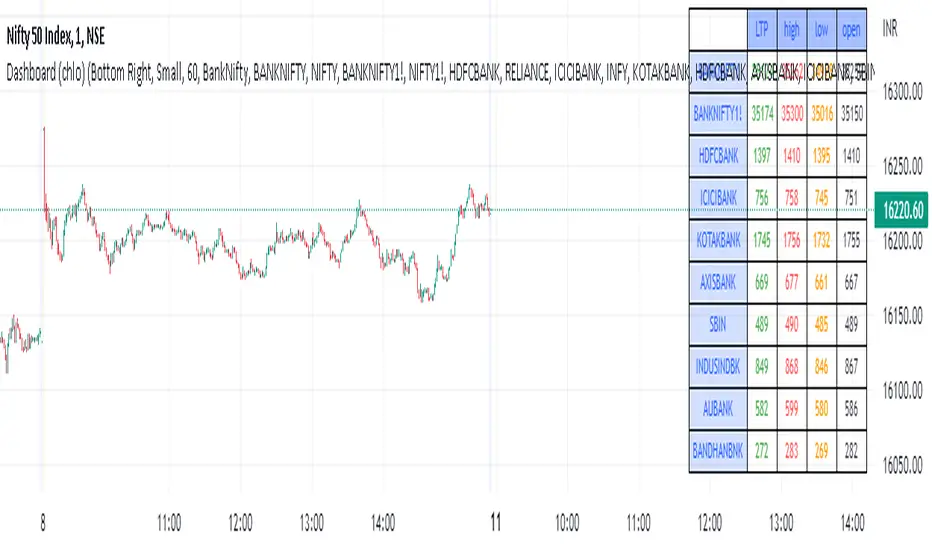
Dashboard (chlo) - v1I am an aircraft maintenance technician who is trying to get into software development in the financial sector.
This is a project in which a dashboard of other security(stocks) with open, close, high, and low will appear.
I could compile this after a detailed study of different dashboards and pine script for several hours
hope you like this.
Dash
Net DASH Margin PositionTotal DASH Longs minus DASH Shorts in order to give you the total outstanding DASH margin debt.
ie: If 500,000 DASH has been longed, and 400,000 DASH has been shorted, then 500,000 has been bought, and 400,000 sold, leaving us with 100,000 DASH (net) remaining to be sold to give us an overall neutral margin position.
That isn't to say that the net margin position must move towards zero, but it is a sensible reference point, and historical net values may provide useful insights into the current circumstances.
(Anyone know what category this script should be in?)

Volatility Across CoinsCompare the recent volatility of 8 cryptocurrencies, based on percentage change per candle.
Useful for volatility strategies to find the highest volatility coins over recent periods or to get an at-a-glance view of volatility correlations.
Options to change the resolution and find average % change per candle over user defined length.
Key:
BTC = Yellow/Gold
ETH = Purple
LTC = Gray
NEO = Green
IOTA = Light Blue
XMR = Orange
BCH = Red
Dash = Blue

BFXLS - BitFinex Long/Shorts
Small improvement upon the above script - all credit should really go to pigloo
Auto-detects ticker and automatically loads the long/shorts for it - so works on more than just BTC
Note - only works on BitFinex and only works for tickers which have long and short data available!
Green area = Longs
Red area = Shorts
Lighter area = Longs - Shorts

EMA bullish/bearish dashboard - MTFThis is a good reminder for which way you should be placing orders.
It's best to not ignore these signals!!!
lime = full bull - 100ema above 200ema and price is above 200ema
green = hallf bull - price now below 200ema but 100ema is still above the 200
maroon = full bear - opposite of full bull
red = half bear - opposite of half bull
Also with multi timeframe option - so I guess you could stack several of these on a single framed chart if you wanted.
