Quantum Darvas BoxesQuantum Darvas Boxes - The Modern Evolution
The original Darvas Box methodology, conceived by Nicolas Darvas in the 1950s, revolutionized breakout trading by identifying consolidation phases as "boxes." However, modern markets move with algorithmic speed and fractal volatility that often trigger false breakouts. Quantum Darvas Boxes were designed not as a nostalgic tribute, but as a computational upgrade. By anchoring boxes to volatility-adjusted boundaries rather than raw highs/lows, and introducing adaptive stability mechanisms, this indicator transforms a classic discretionary tool into a systematic, noise-filtered engine.
Description & Improvements
Quantum Darvas Boxes solve the three fatal flaws of the original: false breakouts, arbitrary box sizing, and lack of confirmation. Instead of drawing boxes at exact recent highs/lows, it creates volatility-buffered boundaries using ATR, ensuring breakouts require meaningful momentum. The boxes remain anchored until a confirmed close beyond the buffer occurs, preventing the constant redrawing that plagued traditional Darvas implementations. Built-in volume and RSI filters add discretionary-grade confirmation to pure price action. Visually, the system presents as a stable, semi-transparent blue zone between red (resistance) and lime (support) lines, with clear triangle signals appearing only on validated breakouts.
How It's Based on Darvas
The core philosophy remains true to Darvas' 1950s methodology:
Identify Consolidation: Finds price ranges where the market consolidates
Draw Box: Creates a "box" representing the accumulation zone
Breakout Trading: Enters when price breaks out of the box with momentum
Volatility-Adjusted Boundaries
Original: Boxes at exact highs/lows → prone to false breakouts
QDB: Boxes set at High - (ATR × Multiplier) and Low + (ATR × Multiplier)
→ Breakouts require meaningful momentum, not just price tags
→ Adapts to different volatility regimes
Signal Logic:
Long: Close above box top, previous close was inside box
Short: Close below box bottom, previous close was inside box
Ideal Settings:
For daily charts, use lookback=13 and mult=2.4.
For intraday (1H-4H), reduce to lookback=8 and mult=1.8. Enable volume filter in trending markets and RSI filter in ranging conditions.
Trade Execution: Enter long on the green triangle below the bar following a close above the red top line; enter short on the red triangle above the bar after a close below the lime bottom line. The background glow provides immediate visual confirmation.
Risk Management: Set stops at the opposite box boundary. The volatility multiplier inherently calculates a risk buffer—larger multipliers create wider, higher-conviction boxes; smaller multipliers produce more frequent, sensitive signals. This system excels in trending markets and provides clear exit/reversal points, transforming Darvas's original speculation into a quantified, repeatable edge.
Darvas

FuTech : Darvas Box (Original Theory) IndicatorFuTech : Darvas Box (Original Theory) Indicator
📈 Introduction
🔹 This indicator implements the legendary Darvas Box theory developed by Nicolas Darvas in the 1950s, which helped him turn $25,000 into $2,000,000 in just 18 months.
🔹 Unlike other box indicators, this implementation strictly follows Darvas' original methodology while adding modern technical features for enhanced usability in today's markets.
===============================================================================
📊 What Makes This Implementation Unique
🔹 This indicator stands apart from other Darvas Box implementations in several key ways:
🔹 It implements the exact "high before low" rule that Darvas used - first identifying the roof (top) of the box, then waiting for the floor (bottom) to form
🔹 It offers two distinct methods for box detection - Swing Confirmation (which waits for price confirmation) and Lookback Period (simpler approach)
🔹 It includes Darvas' critical volume confirmation requirement with customizable parameters
🔹 It incorporates Darvas' focus on strong stocks near their highs through the 52-week high filter
🔹 It provides multi-timeframe capability, allowing application to intraday, daily, weekly, or monthly charts
🔹 It features dynamic box coloring based on breakout direction (green for upward, red for downward)
===============================================================================
🔍 Technical Implementation Details
📦 Box Formation Algorithm
🔹 The indicator constructs boxes using a sophisticated algorithm that follows Darvas' original approach:
🔹 For Swing Confirmation mode:
🔸 The system identifies potential swing highs by looking for price points that are higher than the previous N bars (user-defined)
🔸 Similarly, swing lows are identified as points lower than the previous N bars
🔸 The "high before low" rule ensures a roof is established before a floor is determined
🔸 Once both parameters are locked in, the box is drawn and extended horizontally
🔹 For Lookback Period mode:
🔸 The box high is simply the highest high of the last X bars (user-defined)
🔸 The box low is the lowest low of the last X bars
🔸 This provides a simpler but still effective implementation of Darvas' concept
🚀 Breakout Detection System
🔹 The indicator employs a dual-confirmation system for breakouts:
🔹 Upward Breakout Conditions:
🔸 Price must close above the box roof
🔸 Volume must exceed the volume moving average (default 20-period) multiplied by a factor (default 1.5x)
🔸 The 52-week high filter must be satisfied (price must be within the maximum drawdown percentage from the 52-week high)
🔹 Downward Breakout Conditions:
🔸 Price must close below the box floor
🔸 No volume confirmation is required for downward breakouts (following Darvas' approach)
📊 Volume Confirmation Mechanism
🔹 The indicator calculates volume thresholds using:
🔸 Volume Average = SMA(volume, N) where N is the user-defined period (default 20)
🔸 Volume Threshold = Volume Average × Volume Factor (default 1.5)
🔸 Only when current volume exceeds this threshold is an upward breakout considered valid
📈 Uptrend Filter
🔹 The indicator implements Darvas' focus on strong stocks through:
🔸 52-week High Calculation = Highest price over the past 52 weeks
🔸 Minimum Price Requirement = 52-week High × (1 - Maximum Drawdown %)
🔸 This ensures only stocks that are not too far from their highs generate signals
===============================================================================
🎯 How to Use This Indicator
🔷 Entry Signals
🔹 Wait for a green box to appear, indicating an upward breakout
🔹 Confirm that volume was above average during the breakout (shown by the indicator)
🔹 Verify the stock is within your acceptable distance from its 52-week high
🔹 Consider entering on the next candle after confirmation
🔷 Exit Signals
🔹 Exit when a red box appears, indicating a downward breakout
🔹 Alternatively, use trailing stops below newly formed box lows
🔹 Consider partial exits at predefined profit targets while letting the remainder run
🔷 Parameter Optimization
🔹 For swing traders, use longer lookback periods (20-50 bars)
🔹 For day traders, use shorter periods (5-15 bars)
🔹 Adjust the volume factor based on the asset's typical volatility
🔹 Modify the maximum drawdown percentage based on your risk tolerance
===============================================================================
📚 Historical Context and Trading Philosophy
🔹 Nicolas Darvas developed his box theory while traveling the world as a dancer.
🔹 With limited access to market information, he relied only on price charts and telegrams.
🔹 He discovered that strong stocks tend to pause after hitting new highs, forming what he called "boxes" - sideways ranges where the stock "rests" before its next move.
🔹 By buying only when price broke above these ranges with unusually high volume, he was able to ride powerful uptrends while cutting losses quickly when the breakdown occurred.
🔹 This indicator captures the essence of Darvas' approach - focusing on strength, confirming with volume, and selling weakness quickly - while adding modern technical features to enhance its utility in today's electronic trading environment.
===============================================================================
⚙️ Calculation Summary
🔹 The indicator performs the following calculations:
🔸 Box High = Highest swing high or lookback high (depending on selected method)
🔸 Box Low = Lowest swing low or lookback low (depending on selected method)
🔸 Upward Breakout = Price > Box High AND Volume > (Volume Average × Volume Factor)
🔸 Downward Breakout = Price < Box Low
🔸 Volume Average = SMA(Volume, N) where N is the volume period
🔸 Uptrend Filter = Price ≥ (52-week High × (1 - Maximum Drawdown %))
===============================================================================
🔔 Alert Configuration
🔹 To set up alerts:
🔸 Right-click on the chart and select "Add Alert"
🔸 Choose the Darvas Box indicator as the alert condition
🔸 Select either "Breakout Up" or "Breakout Down" as the alert condition
🔸 Configure your preferred notification method
🔹 This modernizes Darvas' telegram-based approach, allowing you to receive instant notifications when potential trading opportunities occur.
===============================================================================
📈 Conclusion
🔹 This FuTech : Darvas Box (Original Theory) indicator faithfully implements Nicolas Darvas' legendary trading method while adding modern technical features.
🔹 By focusing on strength, confirming with volume, and providing clear entry and exit signals, it offers traders a structured approach to trend following that has stood the test of time.
🔹 The indicator's multiple detection methods, volume confirmation, and trend filtering make it a comprehensive tool for implementing Darvas' box theory in today's markets.
===============================================================================
🙏 Credits : Inspired by @LevelUpTools

The Real Koops - Darvas Box v2.1What Is the Darvas Box?
The Darvas Box strategy was developed by Nicholas Darvas. Aside from being a well known dancer, he began trading stock in the 1950s. Based on his success in trading, he was approached to write a book on his strategy. The book, “How I Made $2,000,000 in the Stock Market,” outlines his approach together with “You can still make it in the market”.
Darvas Box Implementation
The intend behind the Darvas box was for it to be used for rapidly rising technology stocks, and in fact it was never tested or used by Darvas for Commodities. This implementation of the Darvas Box was created specifically in support of Commodity Trends, which tend to be very volatile over long periods of time. The main ones for an uptrend (e.g. longing the market. Shorting the market would work exactly the opposite):
1. When the price of a rapidly rising stock (pls note rapidly rising is key - we are not interested in a sideways trend) is reaching a resistance point, which is does not surpass for three or more consecutive days, that point represents the top of the box.
2. If, after falling from the upper limit, the stock reaches a downward resistance point which it does not penetrate for three of more consecutive days, that level represents the bottom of the box.
3. A stock is in a rising trend when it is in the topmost box. If it remains there, its price fluctuations should be ignored, and the stock is a HOLD.
4. If the price of the stock moves above the top of this topmost box, this stock becomes a BUY. A 10% stop loss should be set at the breakout.
5. Having formed a new higher box, if the price falls below the bottom into the stop loss area of this box, the stock is a SELL.
6. There is no reason to HOLD or BUY a stock that is not in its topmost box.
7. In case a candle pierces out of the top of the box while establishing the bottom of the box, the box is invalidated.
8. If the Box is broken out of on the top, the color is Yellow. If the Box is broken out of on the bottom, the color is Blue.
9. If a Box is being formed in the current timeframe, it is colored Grey, and has clear Buy and Stop Loss indicators so that the user knows how to configure his/her Broker.
10. All parameters for the implementation have been made configurable, so that users can tweak both the presentation of the boxes (background color, border width and style) as well as the configuration of the breakout %, stop loss %, textual presentation and box validation e.g. display arrows where the top and the bottom of the box was drawn, draw boxes only from All Time High back test after a configurable number of years, the number of boxes to be drawn from the last box etc.
11. In addition, two other key principles are critical for application of the indicator:
1. The stock’s price must be at or above its ATH for the past 3 years or more.
2. The volume profile needs to indicate a rapidly growing volume or insider buying (e.g., a volume spike).
How is this implementation different from others?
This implementation holds fully true to the way Darvas described his Darvas Box in his books, but applies it to Commodities. It is in addition, highly configurable, so that it can be used to debug itself (at which points have box boundaries been drawn), and it provides Buy/Sell/Stop Loss levels for entries and exits – again, highly configurable, with defaults set as per Darvas’ books.
Finally, it works over daily to quarterly timeframes (it is not suitable for high frequency trading).
How to use this Indicator?
First, use it with the default settings. Once a grey box is drawn for the current timeframe for the commodity you are interested in investing in (based on Darvas principles outlined above), this box will indicate a Buy level and a Stop loss level based on the principles described above, allowing you to make a purchase decision for that commodity asset accordingly. Then, stay the trade. As the stock continues to move up, more Darvas Boxes will be drawn with new Buy levels and stop loss levels – either add to your position or keep the original investment in play. Once a trend reversal occurs, the Stop loss level will be used to get you out of the trade.
Second, once you are comfortable with this trading methodology, you can refine the script to use a color scheme as you prefer for your Tradingview, as well as set buy, stop loss and sell levels, aligned with your own level of comfort to deal with volatility.
If you wonder why a certain box was drawn at certain levels, you can use the green and red arrows to show the levels based upon which the boxes were drawn.

MB Darvas Box The algorithm is related to darvas theory.
Creates resistance and support levels by creating boxes on the chart layout.
It creates flag icons in the form of Down (A) or Up (Y) according to these box breaks about the trend.
Considering the Darvas strategy, it also provides convenience in trailing stop.
-Alarm adding feature is available.
-Box color change can be edited from the settings section.
-Box fill color can be changed.
-Show/unhide history boxes is available in settings.
-Box calculation can be changed in time intervals.
-You must change the Box Limit entry to see fewer boxes.
It will be more meaningful if used together with the volume indicator.
It is not recommended for use in real transactions.
Does not include investment advice.
Algorithms are useful tools for making predictions.

KV Box v1.0 - Buy / Sell signalKV BOX is a trading indicator. It combines Darvas box theory (developed by Nicolas Darvas), breakout strategy, multi-timeframe trading and ALMA (Arnaud Legoux Moving Averages). This indicator helps identify BUY signals when the price is in the entry zone and SELL when the price breaks out of the uptrend.
---
How to use?
KV BOX can be used in both SPOT and FUTURE (Long/Short) trading
BUY (LONG):
• Entry: When the BUY signal appears.
• Stop loss: LOWER than LOW of first and second candlestick IN THE BOX WHERE BUY SIGNAL APPEARS of 1H, 4H, 1D timeframe.
• Take profit: When the SELL signal appears.
SELL (SHORT):
• Entry: When the SELL signal appears.
• Stop loss: HIGHER than the HIGH of first and second candlestick IN THE BOX WHERE SELL SIGNAL APPEARS of 1H, 4H, 1D timeframe.
• Take profit: When a BUY signal appears.
---
Attention:
KV BOX is only displayed on 1H, 4H and 1D timeframe. 1H for short-term trades (a few days), 4H for mid-term trades (a few weeks), 1D for long-term trades (weeks to months).
---
Options setting:
- Kelvin box on: KV BOX activates
- ALMA mode on: KV BOX activation according to Arnaud Legoux Moving Average (ALMA) method
- Pinbar indicator: activate the indicator when the pinbar candlestick appears
- Supertrend: trend continuation or reversal indicator
============================
KV BOX là 1 chỉ báo mua / bán kết hợp giữa nguyên lý hộp Darvas, phương pháp phá vỡ (break out), giao dịch đa khung thời gian và đường trung bình ALMA (Arnaud Legoux Moving Averages). Chỉ báo này giúp xác định tín hiệu mua khi giá ở vùng entry và bán khi giá phá vỡ khỏi trend tăng (up trend).
---
Cách sử dụng:
KV box có thể dùng trong giao dịch SPOT và FUTURE (Long/Short).
Mua khi có tín hiệu BUY, bán khi có tín hiệu SELL.
MUA:
• Entry: Khi có tín hiệu BUY.
• Cắt lỗ: thấp hơn giá thấp nhất cùa 2 nến đầu tiên trong hộp xuất hiện tín hiệu BUY của khung 1H, 4H, 1D.
• Chốt lời: Khi có tín hiệu SELL xuất hiện.
BÁN:
• Entry: Khi có tín hiệu SELL.
• Cắt lỗ: cao hơn giá cao nhất của 2 nến đầu tiên trong hộp xuất hiện tín hiệu SELL cùa khung 1H, 4H, 1D.
• Chốt lời: Khi có tín hiệu BUY xuất hiện.
---
Chú ý:
KV BOX chỉ hiển thị trên khung 1H, 4H và 1D. 1H cho giao dịch ngắn hạn (vài ngày), 4H cho giao dịch trung hạn (vài tuần), 1D cho giao dịch dài hạn (vài tuần đến vài tháng).
---
Tùy chọn setting:
- Kelvin box on: kích hoạt KV BOX
- ALMA method on: kích hoạt KV box theo phương pháp Arnaud Legoux Moving Averages (ALMA)
- Pinbar indicator: kích hoạt chỉ báo khi xuất hiện nến pinbar đảo chiều
- Supertrend: chỉ báo xu hướng tiếp diễn hoặc đảo chiều

Darvas box (with alerts)Darvas box by Nicholas Darvas, extended original script by KıvanÇ @fr3762 to use new PineScript v4 function box.new()
You can create alerts with this script when price break to the upside or downside from Darvas box

Darvas Box MTF Trend Tracker [LevelUp]The Darvas box theory is based on the work of Nicolas Darvas, author of the book "How I Made $2 Million in the Stock Market". This indicator uses his box theory to help visualize upward trends and find potential opportunities to buy or add to a position.
Darvas was a growth stock trader. After extensive study of historical stock movements, Darvas noted stocks "have a defined upward or downward trend which, once established, tended to continue. Within this trend stocks moved in a series of frames, or what I began to call boxes."
Darvas Box Theory
■ A box defines a high and low range that contains a stock's movement over a period of time.
■ Darvas preferred "lively" stocks that moved up and down within a box. In his research, Darvas noted stocks with these characteristics often had significant moves up.
■ Boxes stacked one after another often indicate a strong upward trend.
■ A potential buy signal is a stock moving past the high of the topmost box with a significant increase in volume.
■ Within the range of a box, Darvas considered movement to the bottom of the range a healthy sign. These moves down shakeout weak holders who sell thinking the downward trend may continue.
Defining a Box:
■ After price makes a new high, there must be three consecutive bars that don't exceed the high.
■ Once the top of the box is set, the same process is used, in reverse, to determine the bottom.
■ Once the high and low are established, a box is drawn over the range of bars.
■ With this indicator, there are two options to determine when a box is complete, that is, when a box is fully enclosed and a new box can be started. The default is when there is a close above or below the high or low of the box. Using the close may provide a better perspective of the overall trend by limiting noise of price movements within a bar. The second option to complete a box is when a bar's high or low goes above or below the boundaries of the box. The preferred option is configurable within the indicator Settings.
Lookback Range
■ The lookback range is used to determine if the current bar has reached a new high, which could indicate the start of a new box.
■ The value specified for the lookback determines how many bars back to compare against the current bar high.
■ You can set the lookback value for intraday, daily and weekly charts.
■ It's recommended to experiment with lookback values across various timeframes to find settings that fit with your trading style.
Suggestions from Darvas:
■ The box theory works best during a strong uptrend, where boxes stack one after another.
■ When breaking through the top of the box, ideally there will be a significant increase in volume. This may be an opportunity to buy or add to a position.
■ Try and hold stocks that are consistently moving up by raising a stop-loss along with the rise.
■ Take losses quickly.
Indicator Features:
■ Box completion can be based on a close above/below the box boundaries or a move above/below the box boundaries.
■ Configure the lookback range for intraday, daily and weekly charts.
■ Configure box borders and background colors.
■ When the last bar is within a box, show an optional breakout price indicating a move above the top of box.

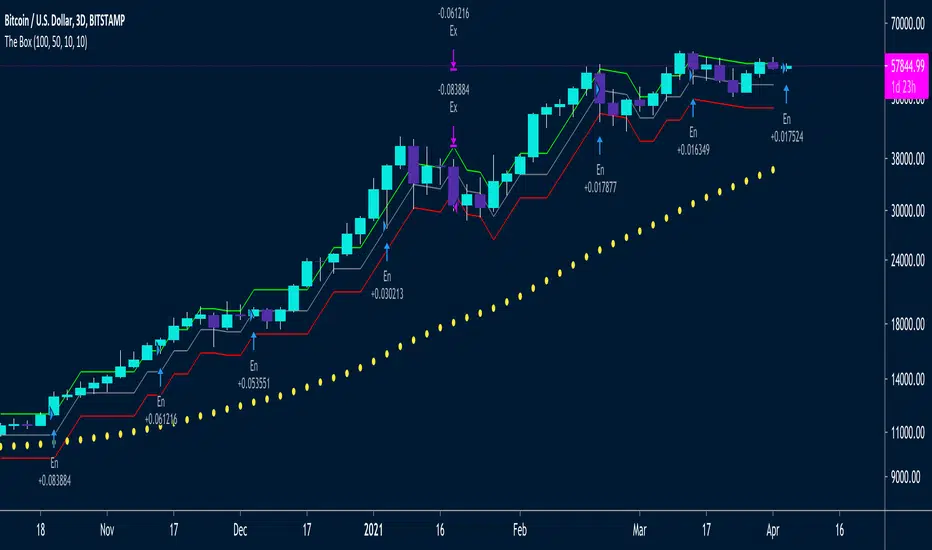
The Box Percent StratHi guys,
Version Zero (more work needed) of an idea I've been meaning to out into a strategy for a while. 🤯
This uses percent boxes🤔 instead of traditional indicators like RSI, MACD etc. 🤫
Takes the first close price of the series and creates a Top Band 10% up, buys if price reaches that level, and puts a stop on a Bot Band, 10% down
When the first trade is in profit by another 10%, it enters another trade and moves the stop of the first trade to breakeven ~ this way it only has one unit of risk at a time
/// Designed for LONG only on Daily, 2D or 3D Charts👌🏻
/// Uses fixed investment risk amount, meaning you're willing to lose that amount per trade
/// Limit buy to not overpay on entries
/// Idea Based on the Darvas system:
/// System only enters trades on strength, when prices equals of exceeds the green line
/// It ads onto the trades, but only *IF* the previous trade is in profit by the UpBoxSize percent size
/// The trailing stop loss is moved up, with the red line
/// A key idea is to only take one unit of risk at a time, meaning for a new add on trade to be taken, the previous trade should be in profit by the same box size as the new new trade's stop loss
/// This will keep adding trades again and again, and they will stop out at the same stop loss
/// Yellow Circles is an MA that filters out choppy areas -- this system only does really well on trending linear markets like: TQQQ, SSO, SPX, SPY
/// Base setting is 10% UpBox Size and 10% DnBox Size: 15% & 15% will be more accurate but fewer signals. 13% profit and 10% stop loss will give a higher risk to reward ratio

Darvas Box/Turtle Way Breakouts v.2 by ZekisFor those who never heard about these two huge strategies:
* * * Darvas Box Strategy - www.netpicks.com
* * * Turtle Way Strategy - www.investopedia.com
In very short terms, both strategies are based on breakouts, probably the easiest way to trade (with proper education, obviously)
I created this indicator based on highs and lows, which will create support and resistance line, which will create a channel/box.
There is the possibility to :
- change channel/box size
- ride it till it will enter again into the channel/box
- set TPs and SL targets
- set alerts for Long, Short, Close when price enter into the channel, SL
- enable or disable 2 TP targets
- enable or disable 1 SL
- enable or disable middle line
Rules are simple:
1. Go Long when price breaks the upper line
2. Go Short when price breaks the lower line
3. Exit Long/Short when price enter into the channel/box
4. Stop Loss are added for safety
5. Added 2 layers for Take Profits
6. Added middle line that can act as Stop Loss
Legend:
1. White line - channel/box
2. Upper white line followed by green line - price cracked the channel/box - Go Long
3. Lower white line followed by red line - price cracked the channel/box - Go Short
4. Red zone - Stop Loss zone
5. Dotted red line - Stop Loss line
6. Dark green zone - first Take Profit zone
7. First dotted dark green line - first Take Profit target
8. First dotted dark green line followed by dotted lime line - price touched first Take Profit
9. Bright green zone - second Take Profit zone
10. Second dotted dark green line - second Take Profit target
11. Second dotted dark green line followed by dotted lime line - price touched second Take Profit
12. Dotted gray line - channel/box middle line
*** Don't use any indicator without knowing whatyou are doing, there is no such a magic lottery winning ticket
Trade safe!
Enjoy!
@Zekis


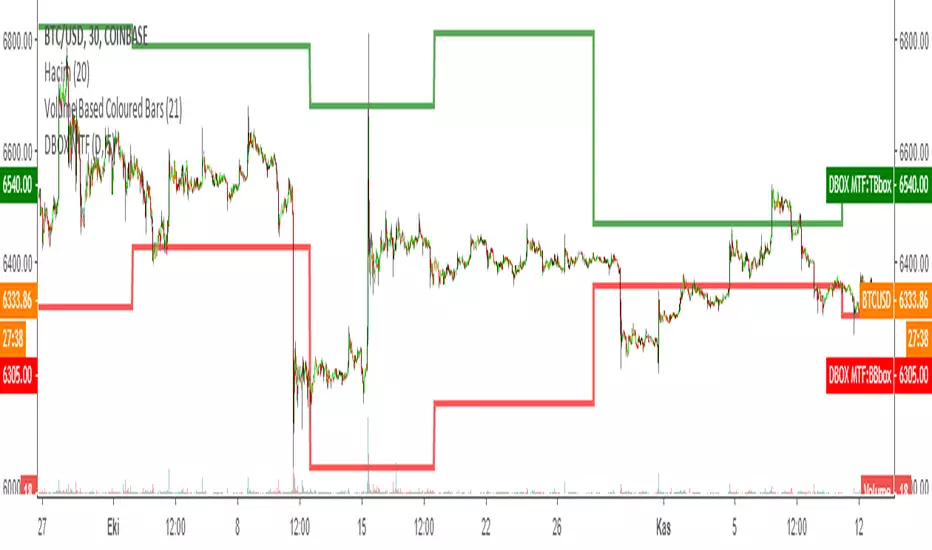
DARVAS BOX MTFMULTIPLE TIME FRAME VERSION OF DARVAS BOX:
You can view different time frame values of Darvas Box levels on any chart
What Is the Darvas Box?
The Darvas Box strategy was developed by Nicholas Darvas. Aside from being a well known dancer, he began trading stock in the 1950s. Based on his success in trading, he was approached to write a book on his strategy. The book, “How I Made $2,000,000 in the Stock Market,” outlines his rather simple approach … simple once you understand the basic concepts and rationale of the strategy.
Darvas Box is an indicator that simply draws lines along highs and lows, and then adjusts them as new highs and lows form. The indicator is available on many trading platforms, such as Thinkorswim. Traders may wish to draw their own boxes though, based on recent highs and lows; Darvas was able to do so (based on telegram quotes) more than half a century ago.
Darvas Box Rules
I shall not follow advisory services.
I shall be cautious of broker advice.
I shall ignore Wall Street sayings or truisms, no matter how ancient or revered.
I shall only trade stocks on major exchanges with adequate volume .
I shall not listen to (or trade off of) rumors or tips, no matter how well researched they may sound.
I will use a sound strategy instead of gamble…I must study this strategy (originally this approach was fundamental analysis , which didn’t work for him, so he developed his Darvas Box trading method).
I will hold one position for longer, as opposed to juggling a bunch of positions for a short period of time.
Darvas looked for increasing volume when selecting stocks to trade; this alerted him to stocks that were being accumulated and were likely to see strong trends.
Darvas believed in buying stocks that presented an upper box limit breakout, but also had an upward Earnings trend. This was especially the case when the major indexes had experienced a decline.
When an upper box limit is broken, buy. From his book, the entry price was usually about 1 to 2% above the upper box limit.
If you enter a trade and the price proceeds to drop out of the new box, and back into the old box, exit the trade.
Entry and stop loss orders should be set in advance, so trades aren’t missed and risk is controlled.
Place, and trail the stop loss order to below the low of the most recent box. This initial stop loss was pretty tight, because Darvas assumed when a price broke out of an old box, it was entering a new box. Therefore, the stop was placed just below the high of old box which was just broken (low of new box).
Record trades, including reasons why you entered and exited.
General conditions of the market must favor buying. Don’t buy stocks when the major indexes are in a bear market, or when volume is flat or declining.
If you are stopped out, but the price moves back into the higher box again providing another buy signal, buy again, using the same stop loss location.
Since the stop is being trailed up, more funds can be added on each consecutive breakout.
The Bottom Line
Nicholas Darvas was a dancer, but committed a great deal of time to developing and then mastering his stock trading method. It’s a trend following method based on breakouts to higher boxes. Risk is controlled by placing a stop below new higher boxes as they form. During choppy conditions the strategy won’t be profitable. This is why Darvas also attempted to only trade stocks with increasing volume and rising Earnings . Trading his method requires a lot of discipline, but can produce big profits when strong trends develop.
source: traderhq.com
Creator: Nicholas DARVAS
Here's the link to a complete list of all my indicators:
tr.tradingview.com
Şimdiye kadar paylaştığım indikatörlerin tam listesi için: tr.tradingview.com
Eros Darvas Box Momentum by ZekisThe strategy traces its origins to 1956, when Nicolas Darvas turned a $10,000 investment into $2 million over an 18-month period using this theory
Short introduction: Darvas Box is based on momentum, the price will stay in the channel and when wil exit from the channel will be the trigger for shorts or longs
More about Darvas Box Theory
www.investopedia.com
Rules are simple:
Enter Long when the price exits the channel through the topline
Exit Long when it enters in the channel
Enter Short when the price exits the channel through the bottom line
Exit Short when it enters in the channel
You need to set all values for your needs, according to what you trade
Alerts are enabled
Enjoy!
@ Zekis

DARVAS BOX by KIVANÇ fr3762What Is the Darvas Box?
The Darvas Box strategy was developed by Nicholas Darvas. Aside from being a well known dancer, he began trading stock in the 1950s. Based on his success in trading, he was approached to write a book on his strategy. The book, “How I Made $2,000,000 in the Stock Market,” outlines his rather simple approach … simple once you understand the basic concepts and rationale of the strategy.
Darvas Box is an indicator that simply draws lines along highs and lows, and then adjusts them as new highs and lows form. The indicator is available on many trading platforms, such as Thinkorswim. Traders may wish to draw their own boxes though, based on recent highs and lows; Darvas was able to do so (based on telegram quotes) more than half a century ago.
Darvas Box Rules
I shall not follow advisory services.
I shall be cautious of broker advice.
I shall ignore Wall Street sayings or truisms, no matter how ancient or revered.
I shall only trade stocks on major exchanges with adequate volume .
I shall not listen to (or trade off of) rumors or tips, no matter how well researched they may sound.
I will use a sound strategy instead of gamble…I must study this strategy (originally this approach was fundamental analysis , which didn’t work for him, so he developed his Darvas Box trading method).
I will hold one position for longer, as opposed to juggling a bunch of positions for a short period of time.
Darvas looked for increasing volume when selecting stocks to trade; this alerted him to stocks that were being accumulated and were likely to see strong trends.
Darvas believed in buying stocks that presented an upper box limit breakout, but also had an upward Earnings trend. This was especially the case when the major indexes had experienced a decline.
When an upper box limit is broken, buy. From his book, the entry price was usually about 1 to 2% above the upper box limit.
If you enter a trade and the price proceeds to drop out of the new box, and back into the old box, exit the trade.
Entry and stop loss orders should be set in advance, so trades aren’t missed and risk is controlled.
Place, and trail the stop loss order to below the low of the most recent box. This initial stop loss was pretty tight, because Darvas assumed when a price broke out of an old box, it was entering a new box. Therefore, the stop was placed just below the high of old box which was just broken (low of new box).
Record trades, including reasons why you entered and exited.
General conditions of the market must favor buying. Don’t buy stocks when the major indexes are in a bear market, or when volume is flat or declining.
If you are stopped out, but the price moves back into the higher box again providing another buy signal, buy again, using the same stop loss location.
Since the stop is being trailed up, more funds can be added on each consecutive breakout.
The Bottom Line
Nicholas Darvas was a dancer, but committed a great deal of time to developing and then mastering his stock trading method. It’s a trend following method based on breakouts to higher boxes. Risk is controlled by placing a stop below new higher boxes as they form. During choppy conditions the strategy won’t be profitable. This is why Darvas also attempted to only trade stocks with increasing volume and rising Earnings . Trading his method requires a lot of discipline, but can produce big profits when strong trends develop.
source: traderhq.com
Creator: Nicholas DARVAS


