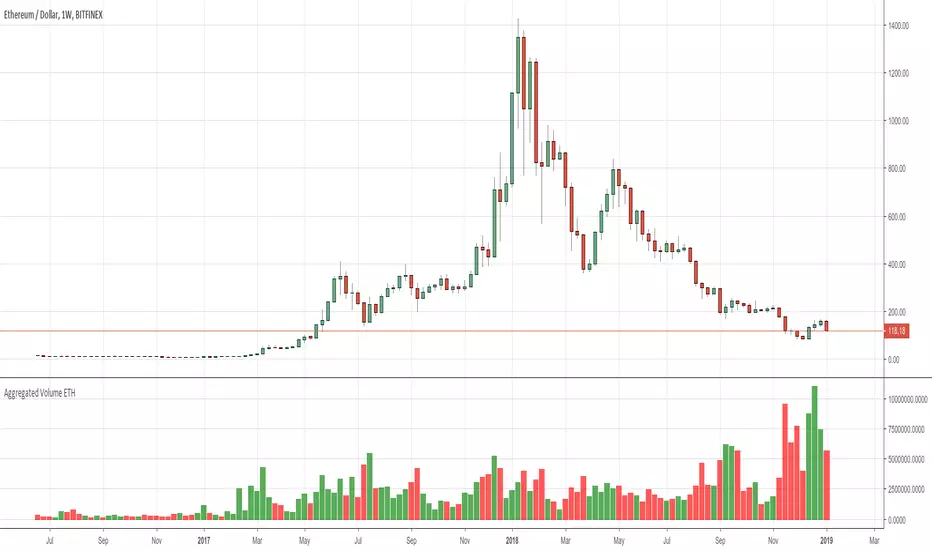
Aggregated Volume ETHAggregates the ETH/fiat volume from multiple exchanges into a single indicator.
# Exchanges and Pairs
Included are only exchanges supported by TradingView:
* Binance
* Bitstamp
* Bittrex
* Coinbase
* Gemini
* itBit
* Bitfinex
* Kraken
* Poloniex
* BitMEX
Excluded low volume exchanges (not in CMC Top):
* CEX . IO
* Coinfloor
Excluded exchange due to volume calculation by TV:
* HitBTC
Many other top exchanges are not included, because they are not supported by TradingView.
# Inputs
By default the spot exchanges are selected. You can select also the other margin trading and derivatives exchanges.
# Contribute
Feel free to share any ideas and issues you have.
# Open Source
The code is open source @ github.com and uses the commonpine library github.com
D-ETH
SSABU TOTAL / BTC / ETH / USDT Dominance
✅ TOTAL / BTC / ETH / USDT Dominance (total market cap / beat / ethernet / share) indicator.
This indicator is a supplementary indicator for the market share of TOTAL Market Cap / BTC / ETH / USDT.
You can check the above occupation rate in real time through the check box of the input. By default, only the dominance of the bit is set to come out.
If you want to see a different share of the bit, check the check box in the input box.
The above screen shot shows only the dominance of the default setting bit.
✅ TOTAL / BTC / ETH / USDT Dominance (총 마캣캡 / 비트 / 이더 / 유에스디티 점유율) 지표입니다.
본 지표는 TOTAL Market Cap / BTC / ETH / USDT의 점유율을 확인 할 수 있는 보조지표 입니다.
인풋의 체크박스를 통하여 위의 점유율을 실시간으로 확인 할 수 있고 기본으로는 비트의 도미넌스만 나오도록 설정하였습니다.
비트 외의 다른 점유율을 보고 싶으시면 인풋에서 체크박스 체크해주시면 확인 가능합니다.
위의 스크린샷은 기본설정인 비트의 도미넌스만 적용한 모습입니다.
✅ 매매에 도움되는 다른 보조지표
Basel ver 2.21

Total Volume for BTC or ETHBITMEX:ETHUSD BITSTAMP:BTCUSD Script includes cumulative Bitcoin volume from exchanges such as Binance, Bitfinex, Bithumb, Coinbase and more
As default, volume is shown based on the number of Bitcoin moved
If volume increases day over day the color will be blue, if it dereases the color will be red. This is not related to price
You can currently switch between ETH or BTC by putting those abbreviations in on the settings inputs
You can also switch to a USD output
You can remove Bitmex data as this exchange is highly leveraged contracts, default includes Bitmex data
Some delays in loading as the indicator pulls data from multiple exchanges
Future updates may include availability of other coins or additional exchanges added

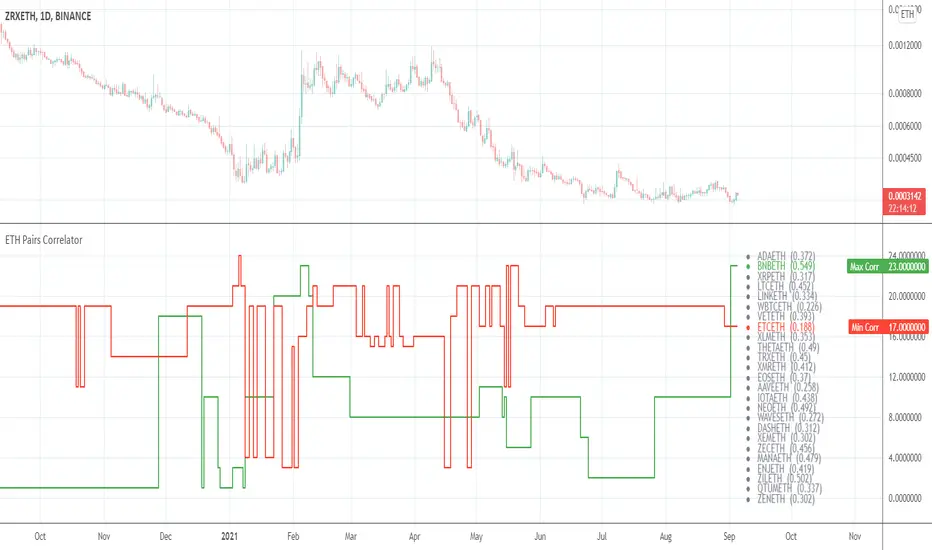
ETH Pairs CorrelatorHey there!
This tool helps to identify the best positive and negative correlated pairs from 38 */ETH cryptocurrency pairs.
By default it will find the best correlations for your current ticker.
If you are a newbie in Correlation Analysis you can find a brief explanation here .
Settings
Lookback for correlations (default: 14 )
Option to use or not to use current ticker (default: true )
Custom ticker (default: BTCUSDT )
Choose as many pairs as you want from 38 available pairs.
Available pairs
ADAETH
BATETH
BCDETH
BCHETH
BNBETH
BSVETH
BTGETH
DASHETH
DGBETH
EOSETH
ETCETH
HOTETH
ICXETH
IOTAETH
LSKETH
LTCETH
MKRETH
NANOETH
NEOETH
NPXSETH
OMGETH
ONTETH
QKCETH
QTMETH
REPETH
TRXETH
TUSDETH
VETETH
WAVESETH
XEMETH
XLMETH
XMRETH
XRPETH
XTZETH
XVGETH
ZECETH
ZILETH
ZRXETH
Good luck!
ETHUSD Total VolumesHello traders!
This tool shows you ETHUSD total trade volumes from the all (well, almost) cryptocurrency exchanges on different timeframes.
Supported timeframes
"1"
"3"
"5"
"10"
"15"
"30"
"45"
"60" - 1 hour
"120" - 2 hours
"180" - 3 hours
"240" - 4 hours
"300" - 5 hours
"360" - 6 hours
"420" - 7 hours
"480" - 8 hours
"540" - 9 hours
"600" - 10 hours
"660" - 11 hours
"720" - 12 hours
"780" - 13 hours
"840" - 14 hours
"900" - 15 hours
"960" - 16 hours
"1020" - 17 hours
"1080" - 18 hours
"1140" - 19 hours
"1200" - 20 hours
"1260" - 21 hours
"1320" - 22 hours
"1380" - 23 hours
"D"
"2D"
"3D"
"W"
"M"
How to get access
Buy for only 25$ to get lifetime access to this indicator
Like and follow for more cool indicators!
Happy Trading!

Crypto Correlations HeatmapHello friends,
This tool is designed for crypto traders who want a fast, visual way to understand how different coins move relative to each other. It builds a correlation heatmap between your current chart symbol and a customizable list of crypto pairs, helping you immediately see which assets tend to move together, move opposite, or behave independently.
🛠️ How It Works
You provide a comma-separated watchlist of cryptocurrency tickers (for example, a list of USDT or USD-margined pairs). The script then:
Filters this list using your chosen Display Mode - All pairs, or only BTC, ETH, USDT, or USDC-related pairs.
Splits long watchlists into pages of up to 40 tickers , so you can smoothly navigate large universes of coins using the page selector.
For each symbol on the active page, it calculates the Pearson correlation over a user-defined lookback period, based on your selected Correlation Source (close, alternative price averages, or other supported inputs via the custom source module).
The results are rendered as a color-coded heatmap: color and intensity reflect both the strength and direction of correlation with your chart symbol.
You can switch between multiple professional color palettes to fine-tune how positive, negative, and neutral correlations are visually separated on the chart.
🔥 Key Features
Custom watchlist input via a simple text area (paste long lists directly from your exchange or screener)
Pagination support - view up to 40 tickers per page for stable performance
Flexible Display Modes : All pairs, BTC pairs, ETH pairs, USDT pairs, USDC pairs
Adjustable correlation lookback length
Advanced correlation source selector via the custom source module
Multiple color palettes : Blue/Red, Blue/White/Red, Green/Pink, Green/Red, Green/Yellow/Red, Purple/Orange, Spectral, Viridis
Clear visual mapping of correlation strength and sign using color intensity and hue
👋 Good luck and happy trading!


[ssabu] self macd indicator───────────────────────────────────────────────────────────
This is an indicator that allows users to type in inputs data for MACD which will show you trading signal visually on your chart.
We also added some features to compare how total balance changes as you trade based on trading signals. We want to let you know that this will help you measure the reliability of your specific inputs data from long term perspective.
Slippage and fee are 0.1% which is a default value.( you can modify this value as same as your exchange platform)
You can also set the date to start trading with your inputs data.
Trading signals appear as 1:1 and there's no repainting issue.
───────────────────────────────────────────────────────────
MACD에 사용자가 인풋값을 넣어서 매매신호가 발생하는 것을 차트에 시각적으로 볼 수 있도록 구현한 지표 입니다.
위의 신호에 맞춰서 매매를 할 시에 시드변화가 어떻게 변하는지 측정 할 수 있는 기능도 넣어 놨기 때문에 장기적으로 사용자는 해당 인풋값의 신뢰도를 측정 할 수 있습니다.
슬리피지 및 수수료는 기본적으로 사고 팔 때 0.1%씩 발생하도록 기본값을 넣어놨습니다. (거래소에 맞게 수정 가능)
날짜 인풋 설정값으로 원하는 매매시작 날짜도 정할 수 있습니다.
매매신호는 1:1의 신호로 발생하도록 되어있고 리페인팅은 없습니다.
───────────────────────────────────────────────────────────
✅ Chart when using this indicator // 사용시의 차트화면
BTC / USD, 30, BITFINEX
ETH / BTC, 30, BITTREX
✅ Chart you can check your seed comparison graph // 시드 변화그래프 확인하는 화면
BTC / USD, 12H, BITFINEX
ETH / BTC, 12H, BITTREX
## 사용방법 및 설치방법만 Basel과 동일 (알고리즘 및 시그널을 띄우는 퀄리티는 등등 Basel이 30000배정도 좋음)


B LAODA trend analysis 6.2Thank for JayRogers
1 hardly any repaint ,suggest 2 hour frame for bitcoin or use hekin ashi K line with 90 minute frame, suggest 1 Day or more for stock exchange

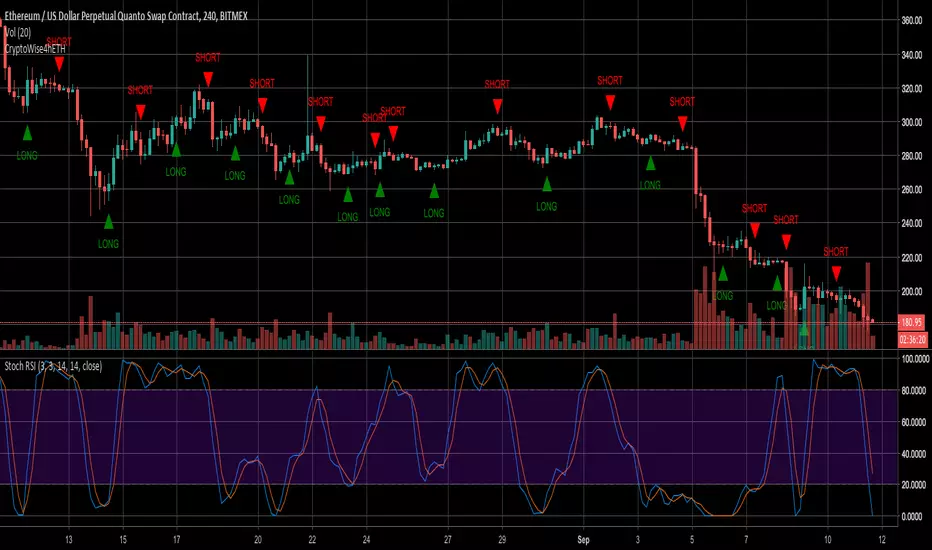
CryptoWise4hETHCrypto Wise 4h ETH Trading Script with Alerts
ETH is very volatile, and that's what makes this script great: Being able to catch the next Move Up or Down.
No repainting.
Better to be used on a 4hr Chart.
No indicator is perfect, but when it gets integrated into a great strategy, and used together with other indicators like the Stoch RSI , you can easily make great trades.
You can get access to the script for $20 / month. Payments accepted in BTC, ETH, LTC, BCH.
72hr Trial given upon request.
XBT Volatility Weighted Bottom Finder. [For Daily Charts]An update to:
Made it into and indicator.
v. 0.0.1
DESIGNED FOR DAILY CHARTS


RELEASE THE BEAST! Tortuga V4 FULL RELEASE!GOOD EVENING FELLOW TRADERS!
The Tortuga V.4 indicator is now fully finalized and ready for trading. This indicator utilizes a combination of momentum, volume, volatility, and price action to create top tier condition signals for both long and short positions. In the Tortuga V.4 indicator, I have updated lines of code to: make long signals more common, make long signals more precise, make short signals more precise, and make short signals more common.
If you are interested in the Tortuga V.4 indicator, shoot me a PM.
As always, trade happy!
James

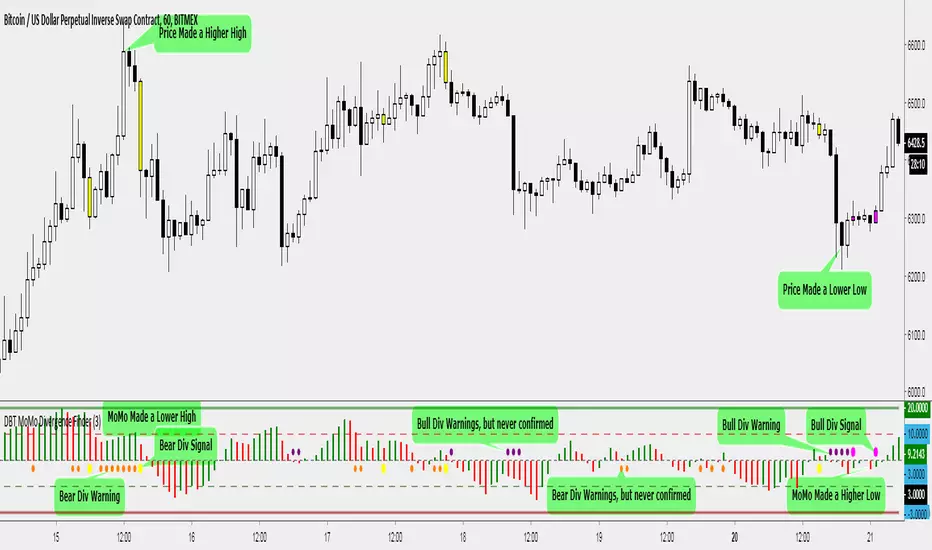
DBT MoMo Divergence FinderThis is a variation of the DBT MoMo created to help find divergence patterns on any time frame.
A divergence is found when price makes a higher high, but the MoMo makes a lower high (bear divergence) or when price makes a lower low, but the MoMo makes a higher low (bull divergence).
This indicator has warning signals and confirmation signals when a divergence is found. Due to the extreme difficulty in coding a divergence indicator properly there are still false signals. Make sure to use basic technical analysis to confirm a divergence signal before trading it.
This indicator allows you to make alerts for Bull and Bear divergence signals, also crossing above 10 or below -10 signals.
You may use this indicator for momentum, but I do not recommend it. If you would like to use this indicator to find momentum signals please use the original version of the DBT MoMo. This indicator was made specifically to showcase divergence signals.
In the settings there is an option to change the histogram colors to match your warning colors.
The default colors are made for a dark background, if you trade on a light background like myself please feel free to change the colors to suit your needs.
Use at your own risk. This is not financial advise and this indicator is not guaranteed to make you profits. Please message me if you have any questions or feedback. Enjoy.
This indicator is apart of my indicators package, if you would like a trial access please feel free to message me.
Volatility Across CoinsCompare the recent volatility of 8 cryptocurrencies, based on percentage change per candle.
Useful for volatility strategies to find the highest volatility coins over recent periods or to get an at-a-glance view of volatility correlations.
Options to change the resolution and find average % change per candle over user defined length.
Key:
BTC = Yellow/Gold
ETH = Purple
LTC = Gray
NEO = Green
IOTA = Light Blue
XMR = Orange
BCH = Red
Dash = Blue

GDAX Coin CorrelationPretty viz of how correlated/uncorrelated price of coins BTC ETH LTC BCH are on GDAX.
From the ref:
"Correlation coefficient. Describes the degree to which two series tend to deviate from their sma values."

DBT MoMo v2DBT MoMo v2 uses everything in the MoMo v1 and more. The MoMo finds areas of extension, to the downside and upside. These areas create good opportunities for long and short positions. It consist of a 3 candle back MoMo line and 24 candle back MoMo line. When both lines are above 10 this shows the bulls are very extended and a pullback or trend reversal is imminent, this will be signified as a gold background on the MoMo. When both MoMo lines are below -10 this shows the bears are very extended and a pullback or trend reversal to the upside is imminent, this will be signified as a purple background on the MoMo. When both MoMo lines are correlating and moving in the same direction the trend is strong. If they are showing inverse signals or the 3 MoMo is rapidly moving while the 24 MoMo is flat this means the trend is choppy or weak. When both MoMos are below -10 or above +10 and the 3 momo rapidly moves to +10 or -10, but the 24 momo remains flat this typically shows a trap is being played and you want to be careful taking a trade in the direction of the 3 MoMo. The midline is a trend line that shows trend direction, green for up red for down and white for sideways.
Use at your own risk. This is not financial advise and this indicator is not guaranteed to make you profits. Please message me if you have any questions or feedback. Enjoy.
This is the Official release of the DBT MoMo. It will be available on my website upon launch. Please do not ask for access. If you would like access please go to my website once it releases, Thank You.

40 DOMINANT ALTCOINS BINANCEThis indicator is a combination of 40 different altcoins which are found on Binance exchange.
I have listed all Binance altcoins in the order of the oldest listed and the newest.
Due to limitations on TV for calling only 40 securities at the same time, I have limited myself with adding only the oldest ones (9+ months) and some 8+ to make up at least 40 for more data.
I have excluded BTC, BCC, ETH, USDT, BNB from list as these are the trading pairs.
I have some updates in mind and will try to add more options in coming months
Regularly updating 40 altcoins list by sorting them by market cap and available historical data from Binance
Adding Bitfinex, Bittrex and other exchanges separetly, as there is only 40 security call limit
Adding ETH; USDT pairs for all above exchanges.
You can add any indicator to this indicator - such as MACD, RSI, EMA and so on to help you analyse it more deeper
When you load this indicator, it takes about 1 min wait as it takes and calculates a lot of data. After it is loaded, it works perfectly.
Currently there is only 40 oldest altcoins to gather enough data, but as time passes, I will change some of them to create better picture of alt coins.
Please report any problems and give feedback.
Any idea of improvement is welcome and I will try my best.
Please support me an consider to give a small tip to addresses bellow. It would greatly help me to free more time for improvements as I am working to support family and my time is limited for markets.
ETH: 0xac290B4A721f5ef75b0971F1102e01E1942A4578
BTC: 39p3rKuJYKGqph1Qs35yEfNWoPvpUJBBcy
This will greatly help me to keep update this indicator and give me more time to analyse and sort out all altcoins my their market cap, volume and influence.

Bull ComparisonBull Comparison is a script that compares the Bull trends for upto 10 coins. This could be dizzying, so for starters start with 3 coins and turn off the 7 remaining in the settings. Default 3 coins are BNB, BTC, ETH USDT. User can customize the coins they want to check, just follow the format in the settings - to see if there is meaningful correlation with other pairs.

Gap finder (gold minds)This tool highlights where gaps happens and outlines in the chart where the gap zones are. If there is a gap up there is a green line, a gap down it is red. The gap zone is highlighted in blue. You can choose the size of your gap with the input menu to the desired size. Feel free to ask comment below. Made for the Gold Minds group

Rainbow RoadRainbow Road allows you to visualise the price in relation to the barriers of support and resistance that are the moving averages. The price can be observed breaking above barriers , or falling below them.
Rainbow Road displays these bands like a ribbon so that the strength or weakness of a security such as Bitcoin, can be observed in a very vibrant and obvious fashion.
The name "Rainbow Road" is inspired by the final course of the Special Cup featured in all Mario Kart games and is the climactic course of each game it appears.
.,-'"*.,-'"*Housekeeping*"'-,.*"'-,.
In order for you to make your chart look exactly like this one when you apply the Rainbow Road indicator, you will need to follow these simple steps.
1. Right click on your chart -> Price Scale -> Undo Indicator Labels
2. Right click on your chart -> Price Scale -> Undo Indicator Last Value
3. Right click on your chart -> Color Theme -> Black
4. Right click on your chart -> Properties -> Background -> Vert Grid Lines -> Slide transparency bar -> Horz Grid Lines -> Slide transparency bar
@#$%@#$%@#$%@#$%@#$%@#$%@#$%@#$%@#$%@#$%@#$%@#$%@#$%@#$%@#$%@#$%@#$%@#$%@#$%@#$%@%
I appreciate the feedback of all of my followers!
Like and follow for more awesome indicators!
