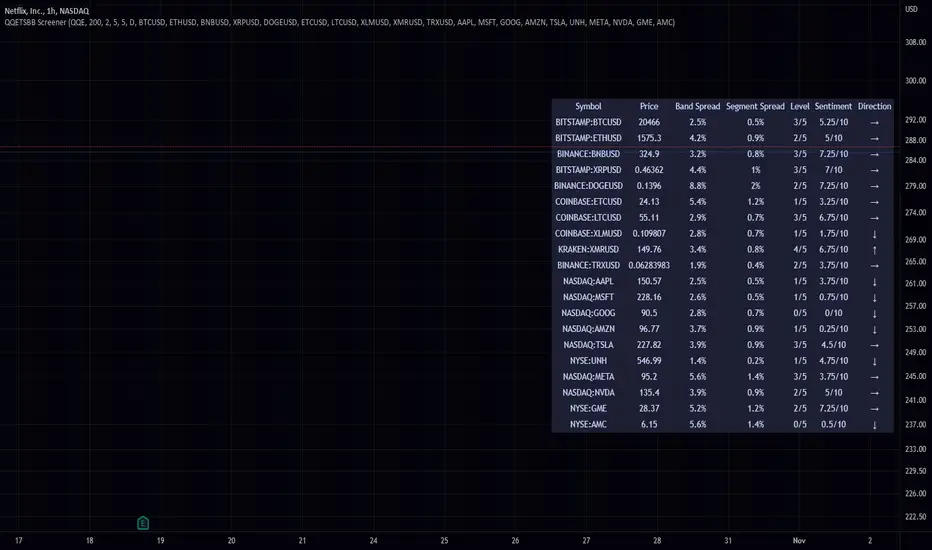
QQE Student's T-Distribution Bollinger Bands ScreenerThis script scans 20 custom symbols and displays the QQE Students T-Distribution Bollinger Bandwidth as a percentage, the quarter segment percentage, a score that tells you what segment of the band the price is in, and what direction the market is going in. This is useful because it can tell you how volatile a market is and how much reward is in the market. It also tells you what direction the market is going in so you can pick a symbol that has the best looking reward. I really hope that this script complements the group of indicators I have made so far. Here is a list of the other two indicators related to this script.
Please enjoy!
D-ETH
Crypto Map Dashboard v1.0🔰Overview
Charts are an essential part of working with data, as they are a way to condense large amounts of data into an easy to understand format. Visualizations of data can bring out insights to someone looking at the data for the first time, as well as convey findings to others who won’t see the raw data. There are countless chart types out there, each with different use cases. Often, the most difficult part of creating a data visualization is figuring out which chart type is best for the task at hand.
What are the types of metrics, features, or other variables that you plan on plotting? Although it depended on some multiple factors!
But my choices of the chart type for this Crypto datas was Pie chart or Donut char for crypto dominances ,and Colum (Bar) chart for Total MarketCaps .
The audiences that I plan on presenting this for them could be all tradingviewrs , especially crypto lovers ,or those who just aim to have an initial exploration for themselves ,like me!
so this indicator mostly could be an educational indicator script for pine coders !
We can use the " Crypto Map Dashboard " indicator to Get an quick overview of the crypto market and monitor where the smart money Flow changing by comparing the dominances and totals Caps .
In general, it consists of 4 parts:
✅1 =>> Table1 : If you like to see and compare and monitor the changes of dominances of (Bitcoin, Ethereum, Usdt , Usdc , etc.) and their market cap in different times you can see the table on The upper-right corner.
✅2 =>> Table2: Also, in the table lower-right corner, you can see the changes of the totals(Total, Total2 , Total3 and TotalDefi) in the same time periods.
✅3 =>> pie chart or donut chart: By viewing this , you understand better about Table1 Datas, that it depicts exactly how Dominance is distributed and specialized.
✅4 =>> column chart (bar chart) : And in the last you can clearly compare the total marketcaps and see how far they are from their ATHs.
You also can even notice the entry and exit of liquidity from the crypto market!
I must also mention that I am definitely still a beginner compared to more experienced pine coders, and there may be some bugs in my codes and calculations, but I am an open person and I welcome your comments ,Also Let me know if you have any questions.
Lots of Love to all tradingviewers and pineCoder ,Cheers!💚❤️💙

Trendmaster - Crypto Social Sentiment OscillatorWhat it is:
The Crypto Social Sentiment Oscillator looks at several social metrics for both Bitcoin and Ethereum more deeply than a simple Fear and Greed Indicator,
to produce a general market sentiment for cryptocurrency.
What it does:
Social Sentiment tries to gain insight into the current retail opinion and mindset on the Crypto sector.
Analyzing multiple social networks and the positive/negative posts and engagement throughout,
we can establish a broad overview of the underlying emotion in reaction and anticipation of price movement.
How to use it:
A value of 100 can indicate extreme market greed, with 0 indicating extreme fear.
Generally, the more Greedy a market is, the more it is punished to the downside.
The more Fearful a market is, the more it is surprised by the upside.

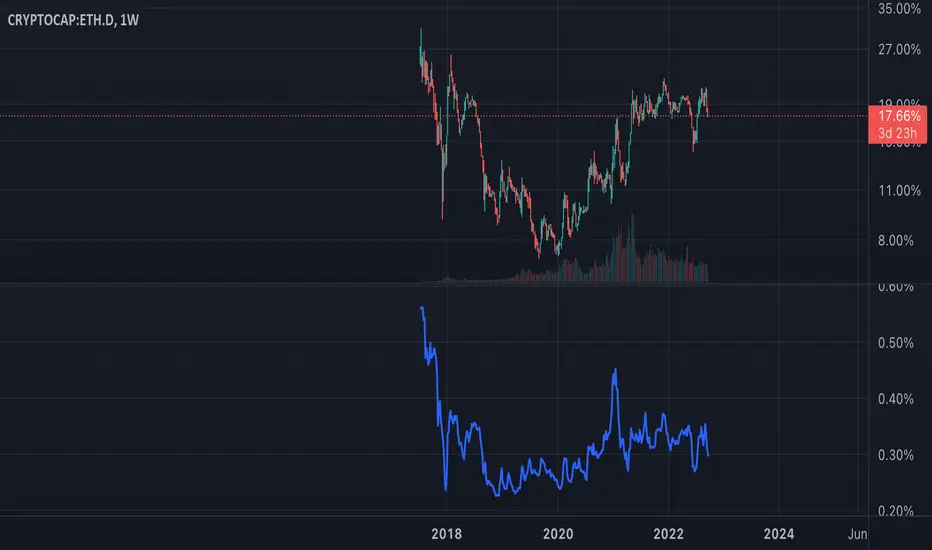
ETH Dominance Excluding BTCThe indicator shows when ETH is undervalued or overvalued with regard to other alts. BTC capitalization is not taken into account.
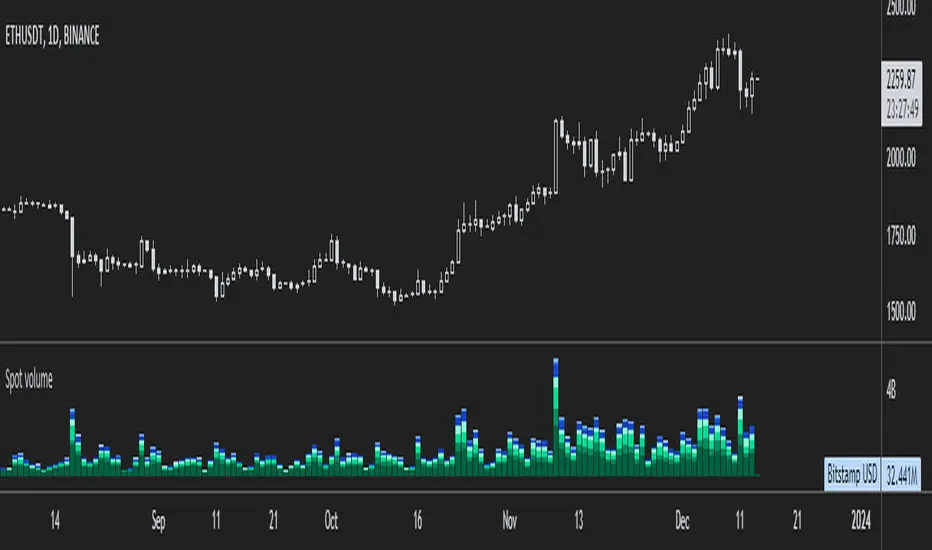
ETH spot volumeIndicator with aggregated volume for all the most actively traded ethereum spot markets.
Can be denominated in either US dollars or the number of coins traded.
Can be displayed as stacked volume or an index that shows the percentage market share each market has.
In the settings you can exclude any market so that it only shows the individual and total volume of the markets you're interested in.
The currency it's traded against is always specified (e.g. USDT, BUSD, ...).
It's public and free for anyone to use.
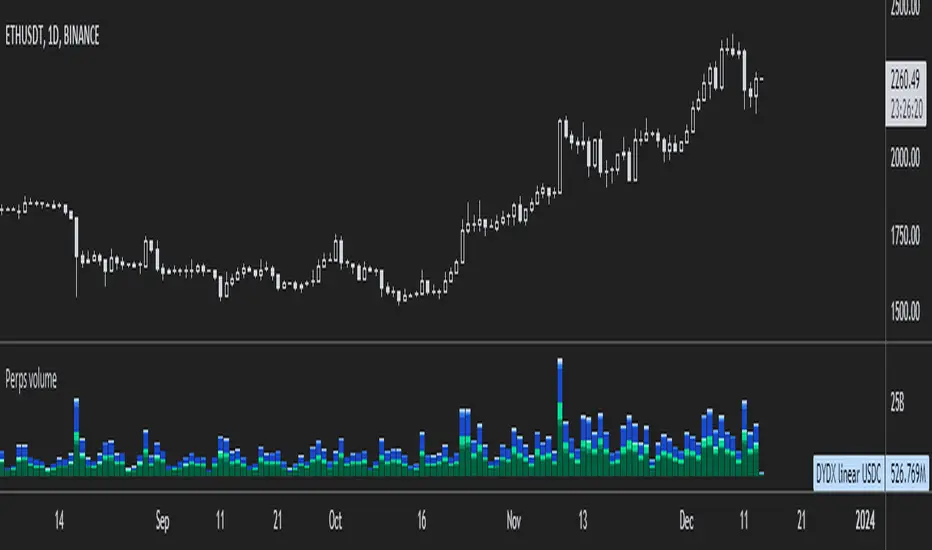
ETH perpetual swaps volumeIndicator with aggregated volume for all the most actively traded ethereum perpetual swaps.
Can be denominated in either US dollars or the number of coins traded.
Can be displayed as stacked volume or an index that shows the percentage market share each contract has.
In the settings you can exclude any contract so that it only shows the individual and total volume of the markets you're interested in.
"Linear" or "inverse" refers to the type of perpetual swap contract it is.
Inverse contracts use coin margin, so in this case ETH.
Linear contracts use some type of dollar equivalent margin like USDT for example.
The margin is always specified for the linear contracts.
It's public and free for anyone to use.
Trendmaster - Crypto Collated Open Interest OscillatorThe Crypto Collated Open Interest Oscillator collates Open Interest for Crypto Futures
Across the Crypto Exchanges and updated on the Daily Timeframe.
This is then smoothed to be actionable when massive Green structure on the oscillator
shows potentially a top before dumping and massive Red structure on the oscillator

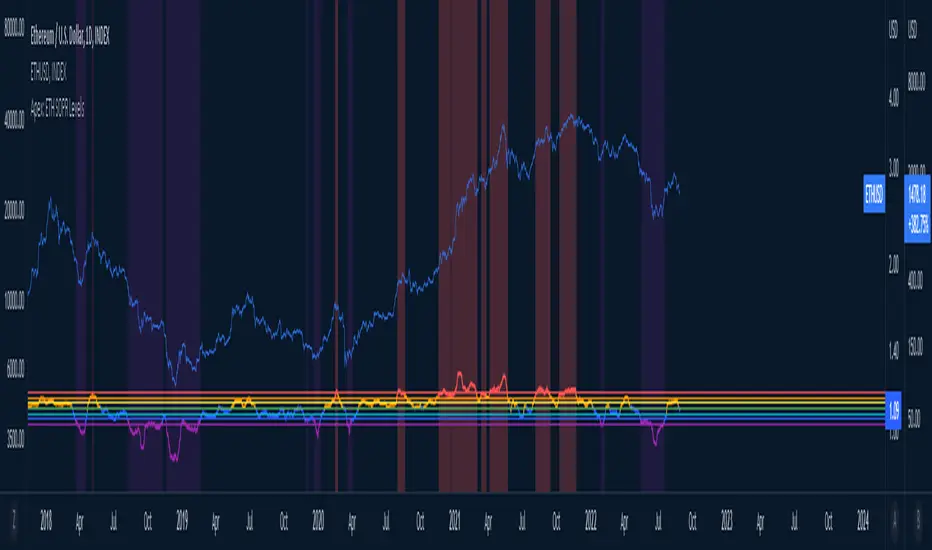
Apex ETH SOPR LevelsThe SOPR (Spent Output Profit Ratio) indicator provides insight into macro market sentiment, profitability, and losses taken over a specific time frame.
It reflects the degree of realized profit for all coins moved on-chain.
This indicator SOPR is for Ethereum only
Personal settings:
Control for the SOPR average for the long or short term (Minimum number is 7)
Control for colors of the SOPR average
Red = High: Greed
Purple = Low: Extreme fear
Parabolic SAR with the ADX overlayThe following indicator and chart pattern is based on a twist from Welles Wilder's parabolic stop and reverse . This is a trend following system which is essentially a dynamic trailing stop loss for longs and shorts. The system is often criticized for it's poor performance in choppy rangebound markets so people often combine it with other signals that attempt to identify a "trend" the ADX is a popular indicator with three indicators, the DI+ "Positive Directional Indicator" the DI- "Negative Directional Indicator" and then a combination of the two, the ADX "Average Directional Indicator". Generally speaking, if the DI+ is above the DI- and the ADX is greater than 25 then we are in a positive trending market. If the DI+ is less than the DI- and the ADX is greater than 25 then we are in a negative trending market. If the ADX is less than 25 then there is no trend in place and we are in a range bound "choppy market".
So, I created this chart to show when the ADX is > 25 (or you can enter your own number) and the DI+ is > DI- then the background will be green. Vice versa, when the ADX is >25 and the DI+ is < DI- then we are in a negative trending market and the background color will be red. If the ADX is < 25 (or whatever you choose) then we are in a choppy 'range-bound" market.
Regarding the ParSAR. Pay attention to the "+" marks. they indicate whether we are bullish or bearish. When we cross through a + then we revert to the opposite. "Stop And Reverse". They are a simple calculation of a starting percentage, an incremental increase in that percentage, and a max percentage increase. If you want your system to trade less, decrease the "maximum" If you want it to trade more, increase the maximum.
Tinker around with these and you might find a healthy strategy you can trade on.
If you add Take Profit Targets and Stop Loss Targets, this is an even more productive strategy. Try it out on BINANCE:ETHUSDT with a 2hr time horizon and 0.02, 0.023, 0.2.

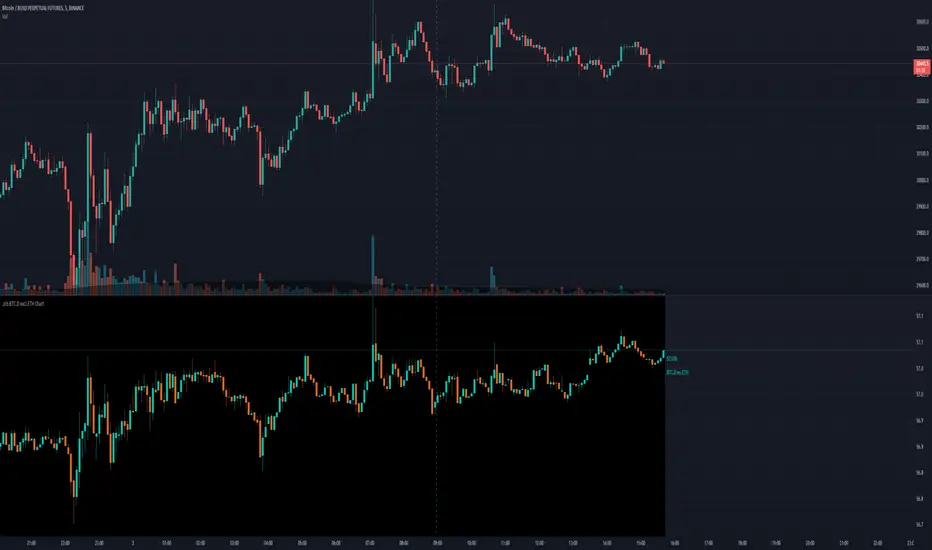
.srb BTC.D excl.ETH Chart.srb BTC dominance excl.ETH Chart
Thanks for BTC dominance excl.ETH Idea to @BLUE43 on tradingview.
The script (originaly .srb) may be freely distributed under the MIT license.
Basic calc :
BTC.D excl.ETH = ( CRYPTOCAP:BTC / ( CRYPTOCAP:TOTAL - CRYPTOCAP:ETH )) * 100
You can switch Candle - Line
On/Off Tracking line
On/Off Last Price Label
On/Off BTC.D excl.ETH <----> regular BTC.D
VMC Oracle This is Oracle. It is a momentum driven indicator with behind-the-scenes filters designed to best indicate the oversold and overbought points on most assets. Oracle partially uses a regression equation displayed in line format with a predetermined spacing to indicate different support and resistance points within the last 100 bars. When used in combination with the smoothed oscillator and moving averages it becomes a powerful tool in your box. It is important to keep in mind that because this indicator is always looking at the last 100 bars the user will need to use the “replay” function on Tradingview for the best manual back-testing to the triggers as possible. It should become clear that when its in the red zone above the ‘zero’ line that the potential for downward movement is greater. The bottom or below ‘zero’ green zone indicates a potential time to buy.
In addition to the regression lines, the indicator is supplied with a basic moving average application involving cross analysis. The two lines in cooperation help the user determine when the overall trend is shifting. As an example, when the overall trend may be indicating a bearish market or downtrend it may be beneficial to consider any of Oracle’s triggers that may be opposite more closely. Some of the alerts will trigger in what appears to be opposite trending areas such as a buy trigger when the averages indicate a bearish period. When this happens, it is up to the user utilize other confirmation type tools to assist in the decision of the oracle triggers. The reason for this is that Oracle is designed to predict the change in the market before or during a peak or through area on the graph. The success can be large but this can reduce the automatic trigger’s success in which loss management must be executed.
The custom alert function built in is designed to automate the visual comparisons of the two items above. By considering trend, immediate resistance and support lines, and momentum we can help visually indicate the points of possible exhaustion in either direction.
When setting up the alert it's as simple as a new alert creation and selecting the VMC Oracle Indicator in the top drop down. After that its as simple as selecting Long Alert or Short alert. As with any tool it is recommended to understand the asset being traded and providing yourself with the best risk management rules to minimize unfavorable movements.

COT Report Crypto█ OVERVIEW
Showing the Commitments of Traders (COT) report(*) for Crypto contract Open Interest and Traders - CHICAGO MERCANTILE EXCHANGE (futures only) with COT charts on TradingView data.
* COT reports are released each Friday (except for U.S. holidays) by the CFTC.
* Each COT report release includes data from the previous Tuesday.
* Original data is www.cftc.gov
Data currently displayed are through April 12, 2022
█ FEATURES
You can switch the display for each of the following CFTC Ticker :
BITCOIN www.cmegroup.com
MICRO BITCOIN www.cmegroup.com
ETHER CASH SETTLED www.cmegroup.com
*MICRO ETHER www.cmegroup.com is currently not supported by TradingView at April 2022
You can switch the display for each of the following Positions :
Long
Short
Net
*Net Position limits the Chart Format that can be displayed
You can switch the display for each of the following Target :
Open Interest
Traders
You can switch the display for each of the following Categories :
Dealer
Asset manager
Leverage funds
Other reportable
Non reportable
*Non reportable has no Traders data
You can switch the display for each of the following Chart Format :
Normal Line
Stacked Column
Indexed Column
Difference StepLine
*Net Position can be displayed only for Normal Line
And, convert contract unit to coin unit is available.
BITCOIN/MICRO BITCOIN is converted to BTC and ETHER CASH SETTLED/MICRO ETHER is converted to ETH.
Then, percent by ALL data is available.
This Option use Open Interest(ALL) or Traders Total(ALL) by Target.
Info Display shows coin unit converts info and reason that cannot display a chart.
Of course, this display position and size are changeable.
█ HOW TO USE IT
This indicator allows you to see changes in each category within TradingView without having to refer directly to each report.
In addition, it provides a detailed means of analysis by offering Traders as well as Open Interest and a variety of visualization methods.

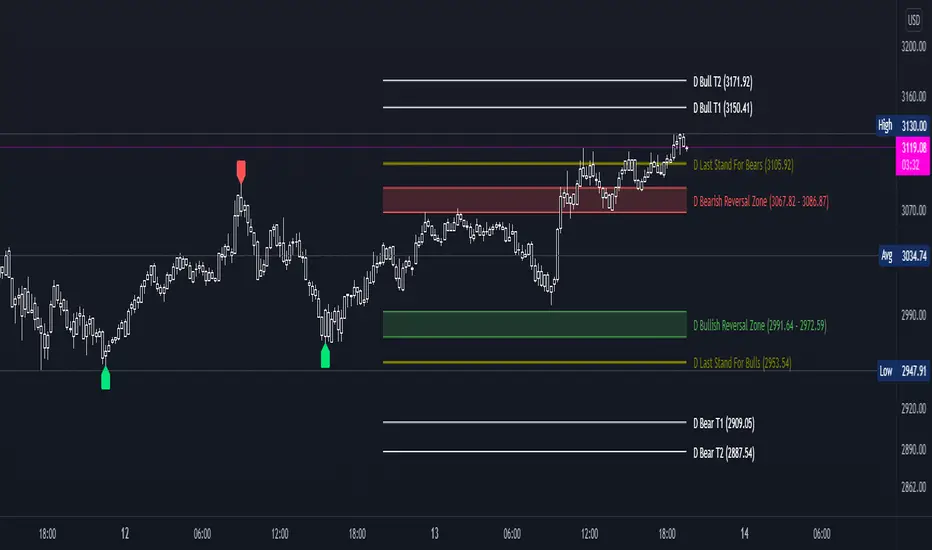
DDG PivotsDDG Pivots is an indicator that autonomously plots current reversal zones, areas of possible pivotal points for intraday trading, price targets, and true lows/highs.
This indicator will identify FINAL pivots (H/L) accurately, plotting either a green or red label to identify true lows/highs.
Once you are able to determine possible reversal areas and pivotal points, you will have a better idea on the current trend and whether these areas are respected/denied, after you can identify the correct trend, this indicator will then help by projecting predicted price targets on screen.
From entry to exit, this indicator helps ease your stress trading.
STOP STARING HOPELESSLY AT YOUR SCREEN, THIS INDICATOR HAS PUSH ALERTS FOR EACH OF THESE VITAL LEVLS.
*Turn on PUSH NOTIFICATIONS to alert you when these vital areas are touched*
Macro EMA Correlation
This script is useful to see correlation between macroeconomic assets, displayed in different ema line shown in percentage to compare these assets on the same basis. Percentage will depend on the time frame selection. In the higher timeframe you will see higher variation and in small timeframe smaller variation.
You can select the timeframe who suit your trading style. The 1h and 4h fit well for longer trend swing trade and the lower time frame 15m, 5m, 1m are good for scalping or daily trading.
The following asset are available:
Bitcoin
Ethereum
Gold
Crypto total market cap excluding bitcoin (total2)
United state 10-year government bond (US10Y)
Usdt dominance show the concentration of usdt hold. For example, when trader are fearful they sell their crypto position to keep more usdt in their portfolio (USDT.D)
The USD/JPY pair the dollar usd versus the Japanese Yen one of the most forex traded pair.
You can clic on parameter to select the asset you want to analyse.
The main correlation observed are:
bitcoin negatively correlated with the usdt dominance.
bitcoin negatively correlated with the usd/jpy pair
bitcoin is positively correlated to eth, total2 (altcoin)
bitcoin positively correlated with gold
bitcoin is mostly negatively correlated to us10y
The basis of correlation is that positively correlated asset goes in the same direction and that the negatively correlated goes in opposite direction.
So, the idea is to use these information to see trend reversing.
Example 1: when bitcoin and usdt dominance are extended in opposite direction we look for a possible retracement toward 1% wich is the middle base.
Example 2 : when bitcoin make a move we look for ethereum and total 2 to follow

EMP PEG / TWAP 1.01 Crypto DefiThis script is for my EMP friends. This addon is based upon Etherium price. It will take the Etherium price and divide by 4,000 to get the PEG price. From there, it will multiply by 1.01 to get the TWAP 1.01. Since it takes 1.01 for the boardroom to print, the yellow line is the important line. TWAP will be showed by default. You can switch between or have both indicators on. You can drag the indicator screen up to get a bigger chart. You can also use this for looking back to see where PEG or TWAP 1.01 was during certain EMP prices. Understand this will get you close to seeing when Boardroom will print. Nothing is exact. How I use it: I place a green and yellow horizontal line on an EMP chart from Dexscreener dexscreener.com You can check this chart to find out what to move your horizontal lines to. Come join the fun at emp.money


Market Hedge RatioRatio of crypto (total, Bitcoin, or Ethereum market cap) to major stable coins.
A low ratio suggests a lot of people are sitting in cash (sidelined if crypto rallies).
A high ratio suggests possible demand saturation.

ETH Bottom FinderThis indicator is a 3 step process for confirming a short term bottom on ETH. Using the setting that are preset, there is are 1, 2 hour and 4 hour alerts. Going top down, if the 4H alert fires and a 1 or 2 hour signal is plotted, the long signal is confirmed. This will only plot on these timeframes and the "ETH 2H Bottom" and "ETH 4H Bottom" will only plot and signal for the ETHUSD ticker. The HigherTimeKLimit is for limiting the 2H slowstoch(21,3) k value for the 1H signal. Used on different pairs, I set it customized with target/stop loss percentages as follows:
upper K STB T:SL
CRV 11 2 3:4.5
LINK 13 2 4:2.2
ATOM 15 1 4:2.8
AVAX 11 1 5:5
AXS 9 2 3:4
STORJ 11 1 4:2.8
XTZ 11 2 no
VET 13 2 4:2.8
UNI 17 2 no
SOL 13 2 4:2.8
ONE 16 2 5:2
FTM 20 1 7:2
ADA 10 2 3:2.2
MATIC 11 1 5:2
HBAR 2H 17 1 5:5
ATOM 2H 1 5:5
LTC
ETH 17 2 no
The STB 1 or 2 refer to showatomstb or showonestb (just a name).

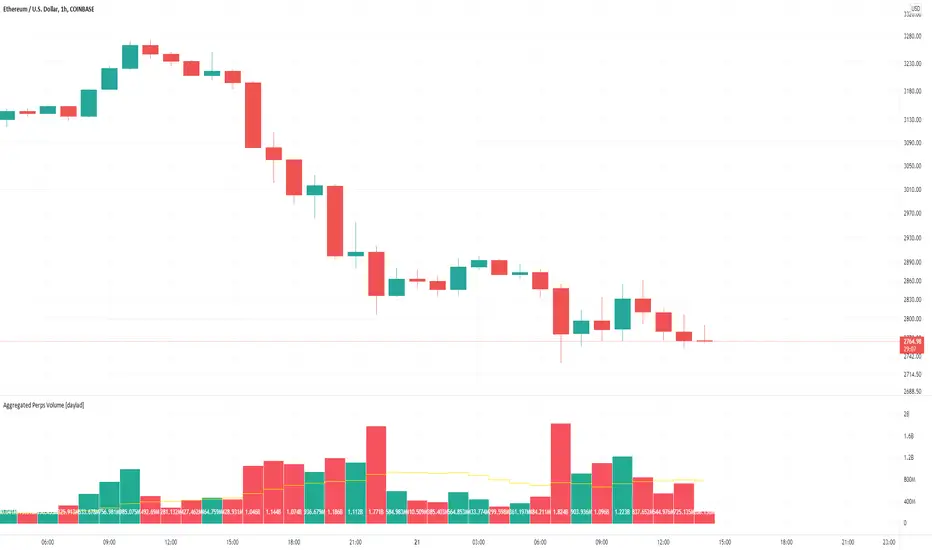
Aggregated Perps Volume [daylad]Same thing as my aggregated spot volume indicator, but for crypto perpetual futures contracts ().
Works with any crypto chart! No need to manually update symbols, this indicator will detect if there is a matching symbol and add it automatically!
The price labels display the total volume per bar in USD.
Pulls data for the following pairs (when available):
BINANCE: + base_symbol + PERP
BINANCE: + base_symbol + BUSDPERP
BINANCE: + base_symbol + USDTPERP
OKEX: + base_symbol + USDTPERP
OKEX: + base_symbol + PERP
FTX: + base_symbol + PERP
PHEMEX: + base_symbol + USD
BYBIT: + base_symbol + USD
BYBIT: + base_symbol + USDT
DERIBIT: + base_symbol + PERP
HUOBI: + base_symbol + PERP
BTSE: + base_symbol + PFC
EXAMPLE -- If you're looking at the COINBASE:SOLUSD chart the indicator will automatically aggregate the volume from BINANCE:SOLPERP, FTX:SOLPERP...etc... BYBIT:SOLUSDT...etc... BTSE:SOLPFC. If an exchange does not have a corresponding pair, then that pair returns 0 and does not add to the total.
If you have any questions feel free to ask. Happy trading!
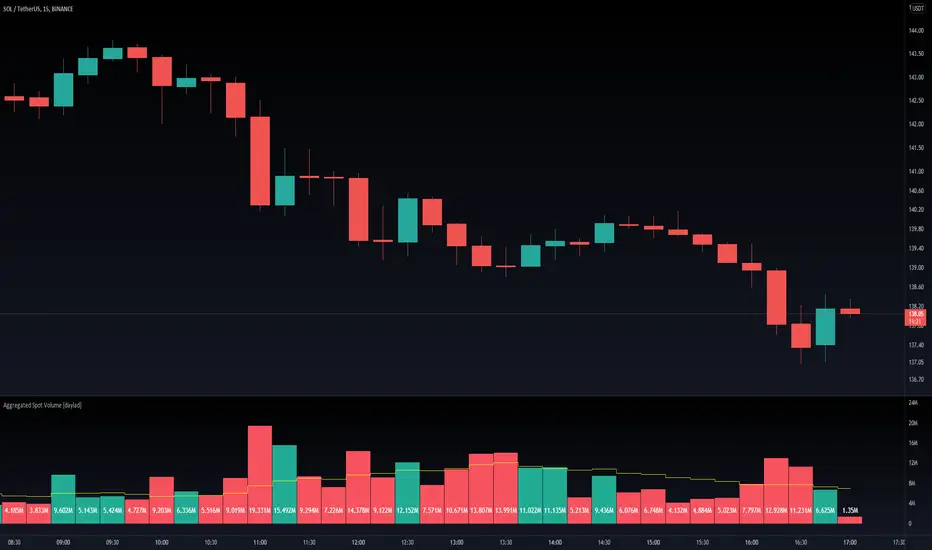
Aggregated Spot Volume [daylad]Works with any crypto chart! Automatically pulls and aggregates trading volume for the top stop pairs.
No need to manually update symbols, this indicator will detect if there is a matching symbol and add it.
Pulls data for the following pairs (when available):
COINBASE: + symbol + USD
COINBASE: + symbol + USDT
COINBASE: + symbol + EUR
BINANCE: + symbol + USDT
BINANCE: + symbol + BUSD
BINANCEUS: + symbol + USD
OKEX: + symbol + USDT
OKEX: + symbol + USDK
FTX: + symbol + USD
HUOBI: + symbol + USDT
BITFINEX: + symbol + USD
KRAKEN: + symbol + USD
KUCOIN: + symbol + USDT
CURRENCYCOM: + symbol + USD
POLONIEX: + symbol + USDT
UPBIT: + symbol + KRW
BITHUMB: + symbol + KRW
EXAMPLE -- If you are looking at the BINANCE:ADAUSDT chart, the indicator will automatically aggregate the volume from COINBASE:ADAUSD, COINBASE:ADAUSDT...etc... BINANCE:ADAUSDT...etc... BITHUMB:ADAKRW. If an exchange does not have a specific pair, then that pair returns 0 (does not add to the total).
If you have any questions feel free to ask. Happy trading!
CRC.i Bollinger Bands ®This script is yet another variant of the famous Bollinger Bands® TA tool used to track price volatility as it deviates from the mean of a security using standard deviations (positive &negative). Built for my own personal preferences. But perhaps you might like it, too.
Includes
+ Chart Lines: price, upper and lower bands
+ User Options: SMA length, stdev value
+ Heads up Display (HUD) with TARGET's and other related stats
Bugs? Comments? Requests? Ping me @calmrat

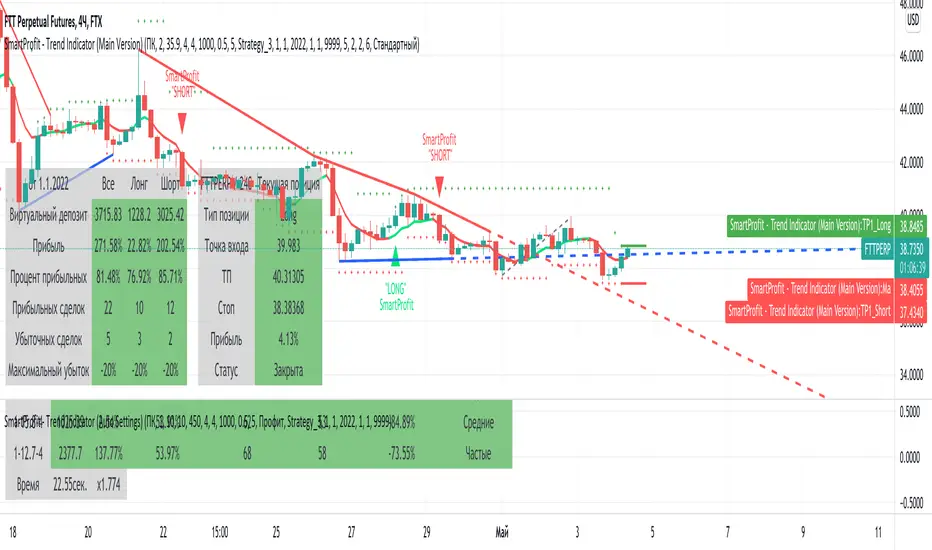
SmartProfit - Trend Indicator (Main Version) - RUSmartProfit - Trend Indicator (Main Version) detects trend direction and gives trading signals for Short and Long positions.
You can use "SmartProdit - Trend Indicator" for any timeframe, from daily, 4h, to fewer ones, even minute timeframe.
We recommend using those timeframes:
4h. and 3h. - for swing trading
15min. и 30min. - for scalping
"SmartProfit - Trend Indicator" features:
1. Sell and Buy signals ( For setup, we have three parameters: HB, sensitivity, and stop )
2. TakeProfit values for Long and Short signals ( Prices for profit fixing )
3. Profit table ( Show profit of current indicator settings for chosen time range )
4. Current position table ( Show data for the current position in real-time. At this table you have all that you need to enter the position )
5. Trend lines ( Draw Global and local trend lines. )
6. Fibonacci levels ( Automatically draw global and local Fibonacci levels )
7. Fibonacci channel ( Automatically draw global and local Fibonacci channels )
8. Auto setting - sorts out more than 6000 variants of settings at one loop and gives the best one.
For best results, you should set up an indicator for each trading pair. For setup, we have three parameters: HB, sensitivity, and stop. We have an additional feature for auto setting, which sorts out more than 6000 variants of settings at one loop and give the best one.
For work with indicators we made 3 strategies:
First - we enter the position after the signal is approved. Close and reenter to position with approved signal for another side.
Second and third - the same, we enter the position after the signal is approved, but we use TakeProfit and StopLoss values to fix the position.
"SmartProdit - Trend Indicator" определяет направления тренда и дает торговые сигналы для входа в Короткую или Длинную позицию.
Индикатор позволяет торговать на любых Таймфреймах , как на дневных, так и на более мелких временных интервалах, вплоть до минутных.
Мы рекомендуем использовать Таймфреймы:
4ч. или 3ч. - для Свинг-торговли
15мин. и 30мин. - для Скальпинга
Подробнее о функционале индикатора SmartProfit:
1. Сигналы Покупки или Продажи ( Для настройки используется уникальные параметры HB и Чувствительность )
2. Значения TakeProfit для Long и Short сигналов ( Зоны фиксации прибыли )
3. Таблица прибыльности ( Отображает прибыльность текущей настройки на выбранном интервале времени )
4. Таблица Текущей позиции ( Показывает текущую позицию в режиме реального времени - в ней есть всё, что нужно для входа в позицию )
5. Трендовые линии ( Рисует как Глобальные, так и локальные трендовые линии, в зависимости от настроек )
6. Уровни Фибоначчи ( Автоматически строит уровни Фибоначчи, как Глобальные так и Локальные )
7. Каналы по Фибоначчи ( Автоматически строит каналы по Фибоначчи, как Глобальные так и Локальные )
8. Автоподсчет всех настроек индикатора - автоматически делает подбор более 6000 вариаций настроек за раз и выдаёт лучшие под каждый актив. Вам не надо тратить недели и месяцы чтобы вручную подбирать настройки, наш инструмент подберет лучшие настройки для Вас.
Для более лучших результатов, для каждого актива индикатор настраивается отдельно !
Для настройки индикатора используются три Уникальных параметра:
HB, Чувствительность, Стоп.
Для работы с индикатором разработаны три стратегии:
Первая - мы входим в позицию при закреплении сигнала и переворачиваемся (то есть выходим из позиции и заходим в противоположную сторону) по обратному сигналу.
По 2-ой и 3-ей стратегии мы также входим после закрепления сигнала, но для фиксации прибыли используем зоны TakeProfit, указанные индикатором.
Подробнее о всех возможностях стратегий, а также настройке и работе с индикатором, вы узнаете из нашей инструкции, которую выдаем персонально.
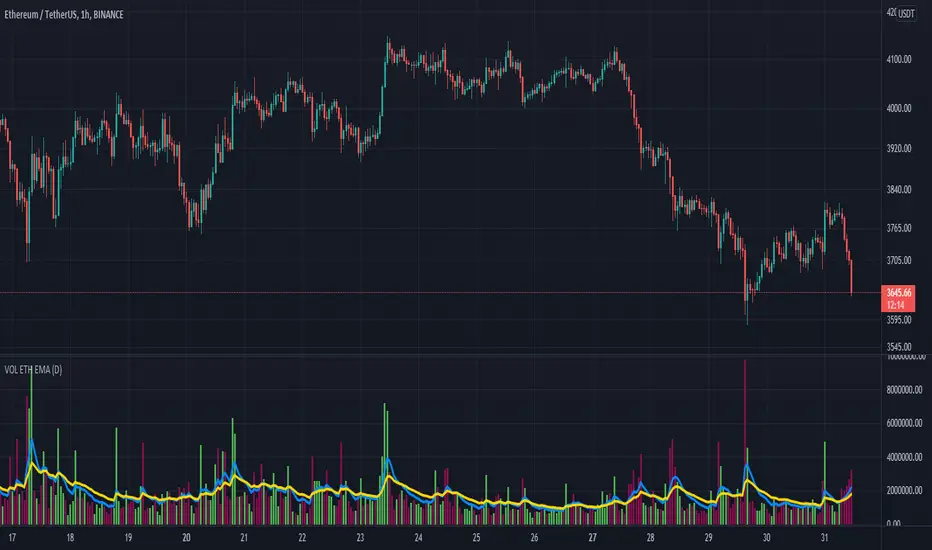
Performante's Average Ethereum Volume Indicator EMAThis indicator takes the volume from the biggest exchanges and plots the average volume. Exchanges incorporated in this average include Bitfinex, Coinbase, Bitstamp, Bitmex, Kraken, Binance, Bithumb, Flyer, OkEx, and CEX. The chart also has two Exponential Moving Averages (9-candle EMA & 21-candle EMA) added onto the volume pane to better understand relative volume. Thank you Julio and Mitch for this indicator