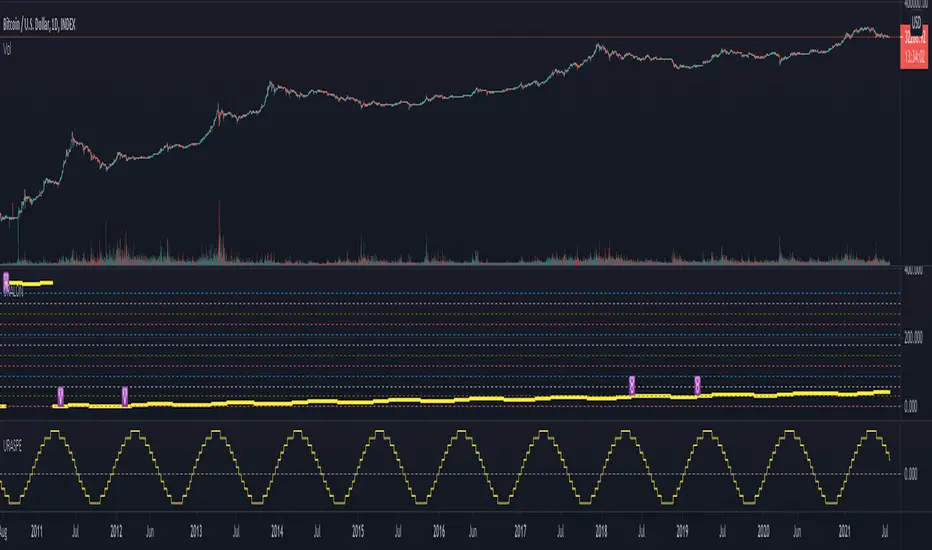
Financial Astrology Uranus LongitudeUranus energy influence the wish to change, to innovate, to disrupt the confort zone, is the spirit of the inventions, revolutions and technology. Rules the industries of electricity, computing, aviation, technology, fin-tech and internet (because without web servers that needs electricity the network cannot operate). Through the course of the zodiac Uranus will reveal the human sectors that will be disrupted, at this moment 2021 is moving through Taurus so is expected that human finances are disrupted which is currently happening with all the innovations and momentum of the fin-tech startups that are innovating applications of the blockchain.
Note: The Uranus longitude indicator is based on an ephemeris array that covers years 2010 to 2030, prior or after this years the data is not available, this daily ephemeris are based on UTC time so in order to align properly with the price bars times you should set UTC as your chart timezone.
Cycleanalysis
Financial Astrology Uranus DeclinationWe have observed that when planets are located in North declination there is a tendency to produce more strong effects when the planet is emitting or receiving aspects. However, in the case of Uranus declination is hard to judge if the boom of technology and crypto-currencies experienced in the last decade could be attributed to the fact that since April 2011 Uranus crossed zero declination toward the North. In this indicator we only have historical declination since 2010 and is hard to do conclusions. Anyways, if Uranus is the reason of the great momentum of crypto-currencies we will see a complete adoption and disruption on the financial sector with the blockchain in the next years because Uranus will continue increasing declination until reach the maxima.
Note: The Uranus declination indicator is based on an ephemeris array that covers years 2010 to 2030, prior or after this years the speed is not available, this daily ephemeris are based on UTC time so in order to align properly with the price bars times you should set UTC as your chart timezone.
Financial Astrology Neptune SpeedNeptune retrograde and stationary phases indicates periods of delusion, on that moments the traders optimism bubble is burst, as consequence, we can see that most of this retrograde speed phase periods correlates with BTCUSD price correction or consolidation periods. Is very clear to see in the chart that only once, the Neptune retrogradation occurrence in September 2020, resulted in price growth. Therefore, periods of price growth and optimism are more likely when Neptune is direct.
Note: The Neptune speed indicator is based on an ephemeris array that covers years 2010 to 2030, prior or after this years the speed is not available, this daily ephemeris are based on UTC time so in order to align properly with the price bars times you should set UTC as your chart timezone.
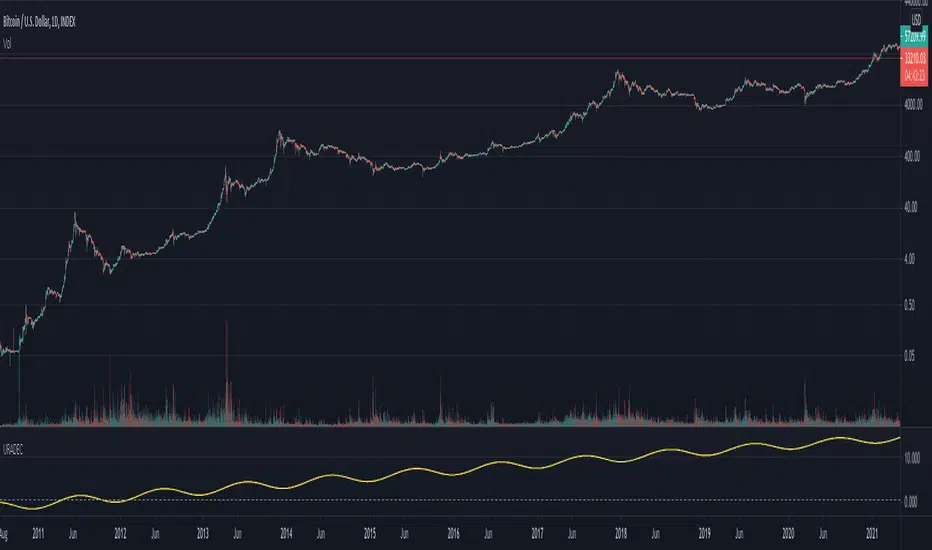
Financial Astrology Uranus SpeedWhen Uranus is accelerating in speed from retrograde to direct phase, there is a quick acceleration of price change. We can observe very clearly that in BTCUSD the most relevant price growth periods happened after the retrogradation period, when Uranus was moving direct and accelerating. Additionally, is very clear that when Uranus is decelerating in speed a period of correction or price congestion occurs. Very similar speed effect pattern was observed for multiples planets speed cycles so is clear that what is good for price growth is that most of the planets are in direct motion.
Note: The Uranus speed indicator is based on an ephemeris array that covers years 2010 to 2030, prior or after this years the speed is not available, this daily ephemeris are based on UTC time so in order to align properly with the price bars times you should set UTC as your chart timezone.
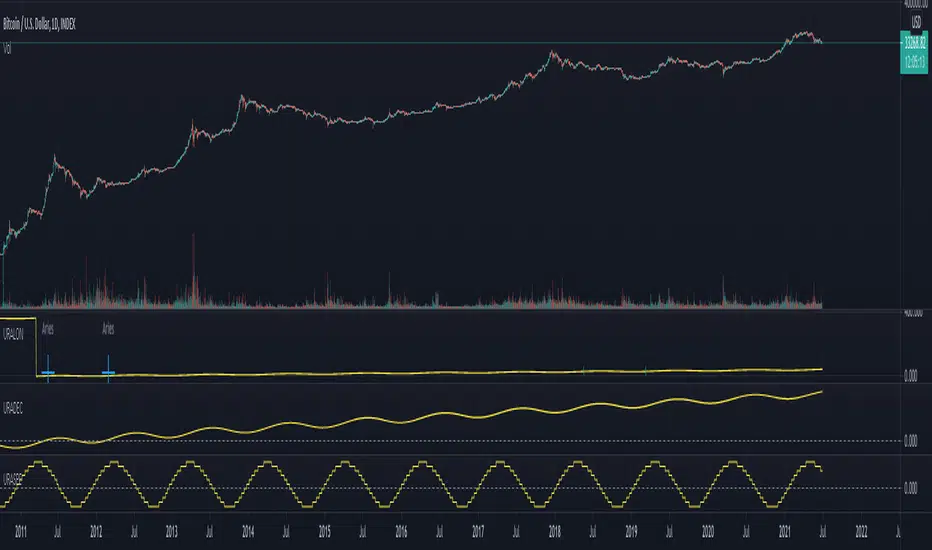
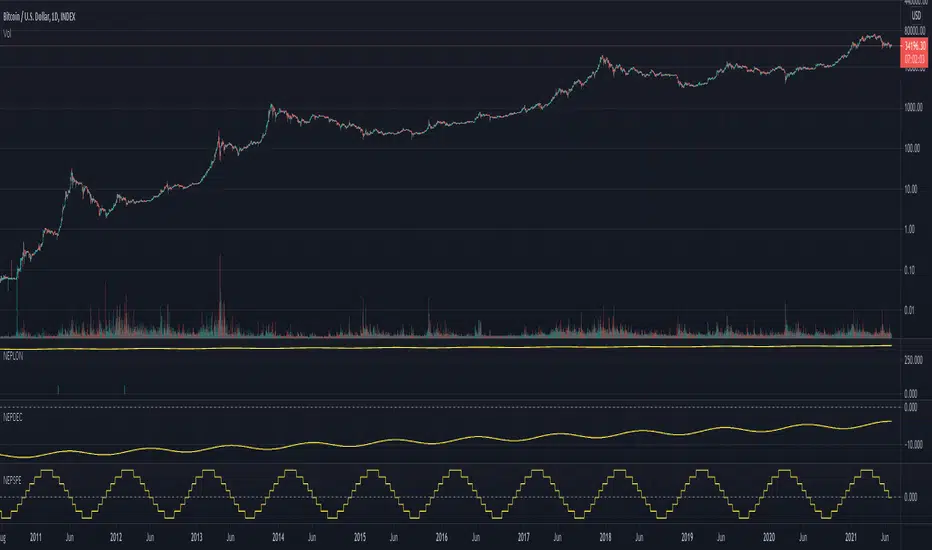
Financial Astrology Saturn SpeedSaturn maximum/minimum speed and stationary periods (zero speed) correlate quite well to determine high/low pivot points at BTCUSD, from using the speed indicator alone we cannot determine the direction of the trend, is clear to see that relevant tops occurred very close to maxima or minima values. Usually when there is a dominant trend and speed deceleration goes from maxima to zero degrees per day (stationary) will indicate a period of traders indecision (waiting) and as consequence a congestion within limited price range, once the speed accelerates and reach the average speed, a breakout tends to happen.
Note: The Saturn speed indicator is based on an ephemeris array that covers years 2010 to 2030, prior or after this years the speed is not available, this daily ephemeris are based on UTC time so in order to align properly with the price bars times you should set UTC as your chart timezone.

Financial Astrology Sun SpeedSun speed from geocentric view represents the apparent daily move (in degrees) of the Sun through the Zodiac wheel, we know well that is the Earth which is moving and this Sun dance through the tropical Zodiac is just apparent. The maximum speed 1.02 degrees per day is reached at the perihelion (closest to Sun) which occurs in January at the zodiac sign of Capricorn, the minimum speed is 0.97 at aphelion (further to Sun) and occurs at July at the sign of Cancer. The speed is inversely correlated to the Sun declination so at the maximum value in North declination we get the minimum value in speed and viceversa.
Is interesting to note that at the speed maxima, minima or exact average (that coincide with the start of the different Earth seasons) we can identify some of the most relevant top and bottoms in BTCUSD. Is said that "gold" metal is ruled by the Sun so would be great to analyse if there is a relevant correlation of top and bottoms in GLD market with in speed extreme value, I will leave this as homework to some of the amazing astro traders that do research with Trading View charts.
Note: The Sun speed indicator is based on an ephemeris array that covers years 2010 to 2030, prior or after this years the speed is not available, this daily ephemeris are based on UTC time so in order to align properly with the price bars times you should set UTC as your chart timezone.

Financial Astrology Saturn LongitudeSaturn energy strengthen the temperance, rectitude, constancy, greed, pessimism and precautionary. Under this influence the crowd will move with caution, slow and with strong and rigorous sense, analysing the environment in detail and deducting all the possible action outcomes based on the past experiences and utilising all the accesible wisdom. This cycle rules the land and real state, the state and institutions, officials, and regulations.
Due to the essential nature of this energy is expected that traders take more caution and reflexion in their investment decisions where Saturn transits through earth element (Taurus, Virgo, Capricorn) because the persons become more prudent and rigid. In water elements (Cancer, Scorpio and Pisces) traders will be reducing exposure to risky assets because the emotions are more unstable and the fear to loss results in risk aversion.
This cycle takes 29 years to complete so we don't have enough observations in the crypto-currencies sector to evaluate the potential effect of Saturn through all the zodiac signs but with the historical data available, there are some interesting patterns: the most bearish zodiac signs was Scorpio (water) and Capricorn (earth) and the most bullish was Sagittarius and Aquarius. This correlates well with other planet cycles where we have observed that air zodiac signs are usually bullish.
This indicator provides longitude since 2010 so will be limited in the zodiac signs that is possible to be analysed, however the periods of retrogradation and stationary speed phases could give interesting trading signals. We encourage you to analyse this cycles in different markets and share with us your observations, leave us a comment with your research outcomes. Happy research!
Note: The Saturn tropical longitude indicator is based on an ephemeris array that covers years 2010 to 2030, prior or after this years the longitude is not available, this daily ephemeris are based on UTC time so in order to align properly with the price bars times you should set UTC as your chart reference timezone.

Financial Astrology Jupiter LongitudeJupiter energy influence the expansion, enthusiasm, joviality, optimism, devotion, administration and judgement. Is associated with people of nobility and good social position: ministers, bishops, religious leaders, judges, bankers, lawyers, merchants, influencers and so forth. This cycle is relevant for the industries of consumer goods, travel, publishing, higher education, banking, gambling and legal.
For most of the crypto-currencies is hard to analyse the impact of the Jupiter transit across different zodiac signs due to the emergent nature of this disrupting financial industry, many coins was launched in 2017 and have not experienced the complete Jupiter cycle. However, in BTCUSD we almost have a complete orbit and through the buy/sell frequency analysis we have observed the following patters: the bullish zodiac signs was Virgo, Libra, Capricorn and Aquarius, the bearish was Leo, and Scorpio. We was not able to obtain price data for the period when Jupiter transited Aries to Cancer so we are pending to analyze the trend direction during those zodiac positions.
This indicator provides Jupiter longitude since 2010 so will be limited to the analysis of 1 cycle, however we noted that the periods of retrogradation and stationary could give interesting trading signals. We encourage you to analyse this zodiac sign / speed phases cycles in different markets and share with us your observations, leave us a comment with your research outcomes. Happy research!
Note: The Jupiter tropical longitude indicator is based on an ephemeris array that covers years 2010 to 2030, prior or after this years the longitude is not available, this daily ephemeris are based on UTC time so in order to align properly with the price bars times you should set UTC as your chart reference timezone.

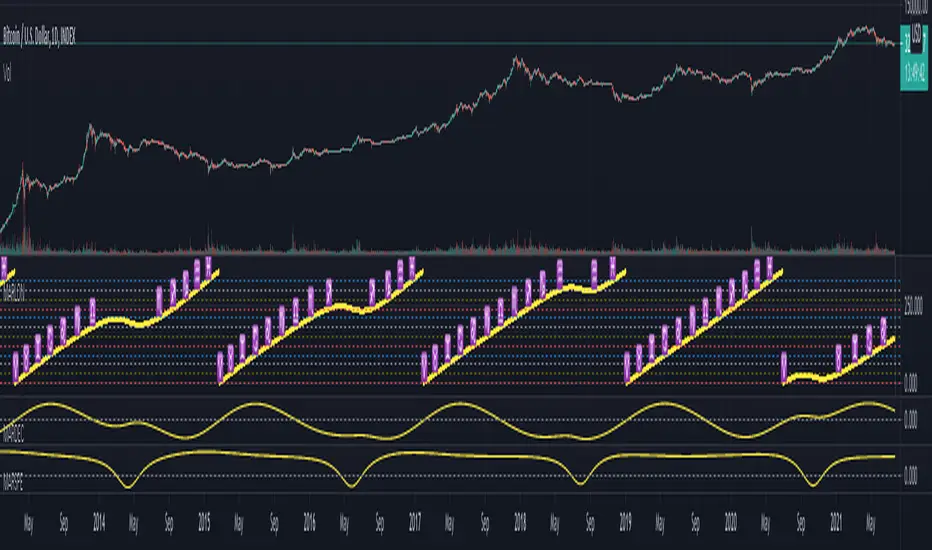
Financial Astrology Mars LongitudeMars energy control the initial impulse, the courage to execute a risky action or to start a new entrepreneurship, to declare the war and fight. It allow us to focus our energy into impulsive action that will require a lot of our forces to produce the initial movement and momentum. Mars drives and directs our motivation into quick and impulsive actions. This planet also rules the angry, fight, conflict, wars and explosive reactions. Therefore, from trading perspective, Mars rules all the industries that imply a higher risks: sports, military, defence, startups (new entrepreneurship), high volatility industries and so forth. Aries zodiac sigh, the domicile of Mars is the archetype of the persons that are willing to move quick from the idea into the action, that are looking to explore new territories and take high risks.
With the manifestation of this impulsive and initiating energy through the zodiac signs we can predict the level of risk that the traders influenced by Mars and dominated by fire will take. This individuals, will desire higher risks when Mars is located in a zodiac sign that strengthens the fire force. Is not a surprise that BTCUSD is more bullish when Mars transits Aries, Gemini (air strength fire) and Sagittarius and bearish when transits Leo (this energy becomes more oriented to pleasures, parties, romance, passions), Virgo (challenge the impulse with the analytic thinking), Aquarius (boring of the existing holding needs to move into another stuff and is desiring a change), Pisces (period of reflexion and mediation of the results of the impulsive cycle that completes).
The most relevant Mars bullish zodiac signs positions for BTCUSD are: Aries 62% days, Gemini 66% days, Sagittarius 58%. The all history buy/sell frequency distribution is 55% (bull) 45% (sell) so BTCUSD has bias to the bullish side, even considering that, the bull frequency on this signs seems to be very relevant and can be analysed with this indicator in the BTCUSD TradingView index that provide historical price since 2010.
With this indicator there is unlimited possibilities to explore the impulsive risk prone actions across different markets to study how this plays out, no more manual chart annotations to identify the zodiac sign location of Mars. We encourage you to analyse this zodiac sign cycles in different markets and share with us your observations, leave us a comment with your research outcomes. Happy research!
Note: The Mars tropical longitude indicator is based on an ephemeris array that covers years 2010 to 2030, prior or after this years the longitude is not available, this daily ephemeris are based on UTC time so in order to align properly with the price bars times you should set UTC as your chart reference timezone.
Ehlers Adaptive Center Of Gravity [CC]The Adaptive Center Of Gravity was created by John Ehlers and this is a regular center of gravity indicator combined to be use with the current cycle period. If you are not familiar with stock cycles then I would highly recommend his book on the subject: Cycle Analytics. Buy when the indicator turns green and sell when it turns red.
Let me know if there are any other indicators you want me to publish!

Cycle Swing MomentumAdaptive Ultra-Smooth Momentum indicator
The Cycle-Swing-Indicator "CSI" provides an optimized "momentum" oscillator based on the current dominant cycle by looking at the swing of the dominant cycle instead of the raw source momentum. Offering the following improvements:
Smoothness
Zero delay
Sharpness at turning points
Robust and adaptable to market conditions
Accurate deviation detection
The following common problems with standard indicators are solved by this indicator:
First, normal indicators introduce a lot of false signals due to their noisy signal line. Second, to compensate for the noise, one would normally try to add some smoothing. But this only results in adding more delay to the indicator, which makes it almost useless. Third, standard indicators require a length adjustment to derive reliable signals. However, you never know how to set the right length.
All three problems described above are solved by the developed adaptive cyclic algorithm.
The above chart shows current Bitcoin 4h data from the last days as of writing with the proposed signal reading for this indicator. The standard momentum indicator is included for comparison.
HOW TO USE
The indicator works without any parameter and can be applied to any chart and any time-frame. It will adapt automatically to the Dominant Cycle and use the dominant cycle of the source data to derive the ultra smooth momentum curve. Adaptive upper/lower bands are included and highlight areas with extreme readings. Automatic divergence detection can be turned off/on.
HOW TO READ
The indicator can be used like any oscillator. In addition, it provides adaptive high and low bands.
* Look for turns above the upper/lower bands
* Look for divergences between source and signals line
Further reading/Original source:
The indicator uses the dominant cycle to optimize signal, smoothing and cyclic memory. To get more in-depth information on the Cycle Swing Indicator, please read Chapter 10 "Cycle Swing Indicator: Trading the swing of the dominant cycle" of the book "Decoding the Hidden Market Rhythm, Part 1" available at your favorite book store.
Related ideas:
Please also check the cyclic RSI indicator which also uses cyclic information to improve the signal.

RSI cyclic smoothed v2Cyclic Smoothed Relative Strength Indicator
The cyclic smoothed RSI indicator is an enhancement of the classic RSI , adding
additional smoothing according to the market vibration,
adaptive upper and lower bands according to the cyclic memory and
using the current dominant cycle length as input for the indicator.
The cRSI is used like a standard indicator. The chart highlights trading signals where the signal line crosses above or below the adaptive lower/upper bands. It is much more responsive to market moves than the basic RSI.
You can also review this short idea where BTC went down from 4300 USD (3 Sept 17) to 3700 USD (15 Sept 17) after the idea was posted and showed the clear short exit with the next low:
The indicator uses the dominant cycle as input to optimize signal, smoothing and cyclic memory. To get more in-depth information on the cyclic-smoothed RSI indicator, please read Chapter 4 "Fine tuning technical indicators" of the book "Decoding the Hidden Market Rhythm, Part 1" available at your favorite book store.
This is the open-source code version of the requested script already published as protected indicator back in 2017 "RSI cyclic smoothed". Now made public as v2. Would love to receive feedback and see your ideas.

Ehlers Cyber Cycle [CC]The Cyber Cycle was created by John Ehlers (Cybernetic Analysis For Stocks And Futures pg 34) and this is one of my favorite Ehlers indicators. I use it personally for exits but it has several uses. It gives great entry and exit signals when you enter when it is at the bottom or at the very top during a cycle. When it is above 0 then the stock is in a strong uptrend and when it is below 0 then the stock is in a strong downtrend. It is also very reactive as well with zero lag according to Ehlers. Buy when the indicator line is green and sell when it is red.
Let me know if there are other scripts you would like to see me publish or if you want something custom done!

Stochastic Pop and Drop by Jake Bernstein v1 [Bitduke]I found a simple strategy by Jake Bernstein, modified it a little and created a strategy with Risk Management System (SL+TP); After that I test it on the different cryptocurrency pairs.
About the Indicator
Basically it's the strategy of 2 indicators: Stochastic Oscillator to define the bias and Average Directional Index to confirm it.
One again, It uses Stochastic Oscillator to define the trading bias. In particular, the trading bias was deemed bullish when the weekly 14-period Stochastic Oscillator was above some default value (in him paper - 50) and rising and vice versa.
Once the trading bias is established, Steckler used the Average Directional Index (ADX) to define a slowdown in the trend. ADX measures the strength of the trend and a move below 20 signals a weak trend.
Modifications
I didn't implement Average Directional Index (ADX) and test just different sources for data, oscillator periods and different levels in relation to the crypto market.
So, it shows good results with two tight thresholds at 55 and 45 level.
The bar chart below the defining the bullish and bearish periods (green and red) and gives a signal to enter the trade (purple bars).
Backtesting
Backtested on XBTUSD , BTCPERP (FTX) pairs. You may notice it shows good results on 3h timeframe.
Relatively low drawdown
~ 10% (from 2019 to date) FTX
~ 22% (4 years from 2016) Bitmex
I backtested on the different altcoin pairs as well, but the results were just not good.
Relatively good results were shown by some index pairs from the FTX exchange ( FTX:SHITPERP ), but I think there is a few data for backtesting to be asure in them.
Bitmex 3h (2017 - 2020) :
i.imgur.com
FTX 3h (2019 - 2020):
i.imgur.com
Possible Improvements
- Regarding trading algorithm it would be good to check with strategy with ADX somehow. Maybe for the better entries
- As for Risk Management system, it can be improved by adding trailing stop to the strategy.
Link: school.stockcharts.com

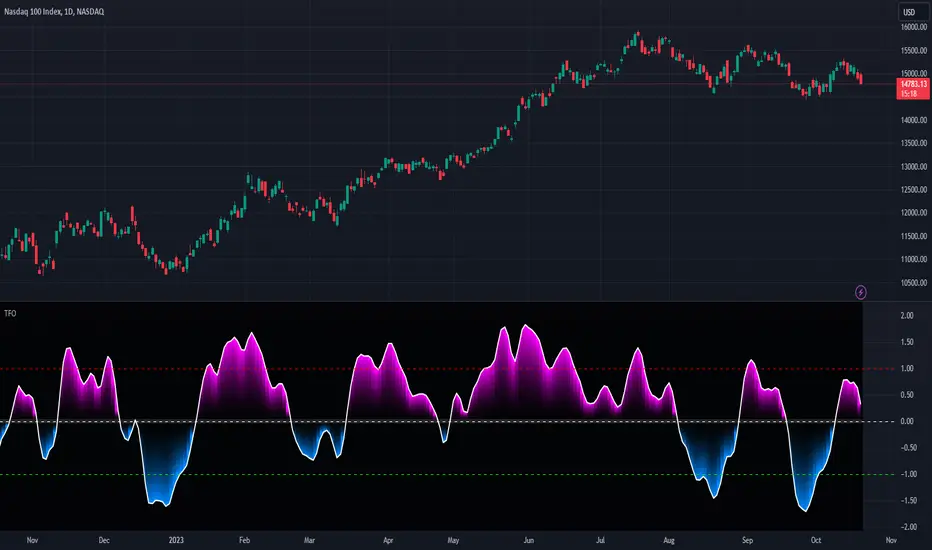
TrendFlex Oscillator - Dr. John EhlersHot off the press, I present this NEW "TrendFlex Oscillator" employing PSv4.0, originally formulated by Dr. John Ehlers for TASC - February 2020 Traders Tips. John Ehlers might describe it's novel characteristics as being a reversal sensitive near zero-lag averaging indicator retaining the TREND component. Also, I would add that irregardless of the sampling interval, this indicator has a bound range between +/-2.0 on "1 second" candles all the way up to "1 month" candle durations. This indicator also has a companion indicator entitled "Reflex Oscillator". I have published it in tandem with this one in my scripts profile.
One notable difference between this and the original formulation is that I have added an independent control for the Super Smoother. This "tweak" is enabled by applying the override and adjusting it's period. There is a "Post Smooth" input() that "tweaks" the internal TrendFlex EMA too. Keep in mind that my intention of adding tweaks is solely for experimentation with the original formulation.
I also added adjustable levels for those of you that may wish to employ alertcondition()s to this indicator somehow. Providing a more utilitarian approach, I created this with an easy to use reusable function named trendflex(). As always, I have included advanced Pine programming techniques that conform to proper "Pine Ettiquette". Being this is one of John Ehlers' first two simultaneously released indicators for 2020, I felt a few more bells and whistles were appropriate as a proper contribution to the Tradingview community.
Features List Includes:
Dark Background - Easily disabled in indicator Settings->Style for "Light" charts or with Pine commenting
AND much, much more... You have the source!
The comments section below is solely just for commenting and other remarks, ideas, compliments, etc... regarding only this indicator, not others. When available time provides itself, I will consider your inquiries, thoughts, and concepts presented below in the comments section, should you have any questions or comments regarding this indicator. When my indicators achieve more prevalent use by TV members, I may implement more ideas when they present themselves as worthy additions. As always, "Like" it if you simply just like it with a proper thumbs up, and also return to my scripts list occasionally for additional postings. Have a profitable future everyone!
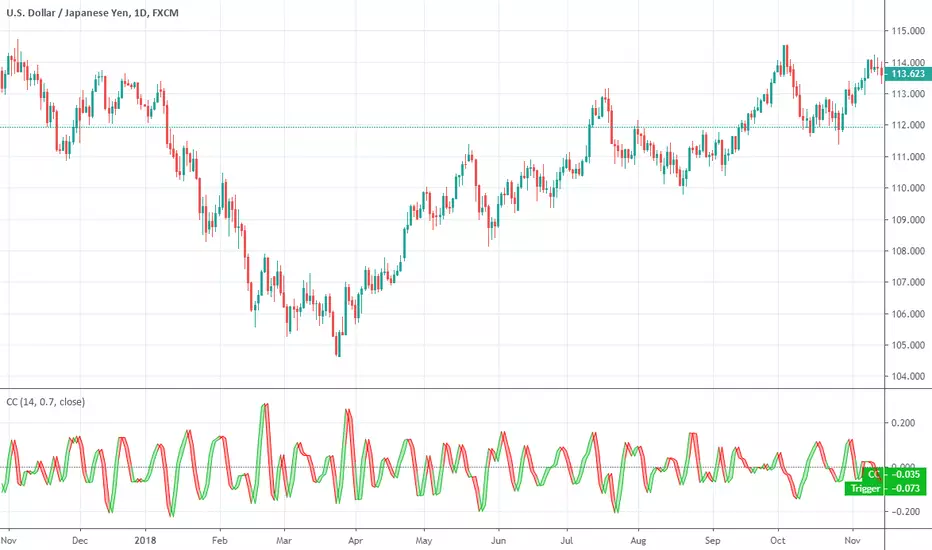
CCI Cycle (Modified Schaff Trend Cycle)This is a modified Schaff Trend Cycle (STC), which is designed to provide quicker entries and exits.
I've been a huge fan of the STC for a long time, but being based on the MACD means its signals often lag by a bar or two (especially in fast moving markets). All I've done here is take the base STC script (all credit to user @LazyBear), and change the source to a modified CCI.
The CCI Cycle provides more timely entries and exits, often by 1-2 bars. The flip side of the increased responsiveness is a prevalence for more false signals (a perfect example is the 17th August on the above chart). It's the nature of the beast! Still, I've been using this for a few months now and it's (in my opinion) an upgrade on the standard STC.
As always, you will need to pair this with another indicator or method of technical analysis to provide a trade bias, as the CCI Cycle (and STC) aren't designed to trade every signal. In my experience, either divergence identification, or using one or more moving averages works particularly well.
The indicator is also MTF capable, so you can get some interesting results from that.
Any queries let me know.
DD

Ehlers Stochastic Cyber CycleEhlers Stochastic Cyber Cycle indicator script.
This indicator was originally developed by John F. Ehlers (see his book `Cybernetic Analysis for Stocks and Futures`, Chapter 8: `Stochasticization and Fisherization of Indicators`).

Ehlers Cyber CycleEhlers Cyber Cycle indicator script.
This indicator was originally developed by John F. Ehlers (see his book `Cybernetic Analysis for Stocks and Futures`, Chapter 4: `Trading the Cycle`).