PpSignal Algorithmic trading system this strategy uses
1) trend
2) volatility
3) volume
Also, you can find in additional tools, rsi wilders on the chart and its standard deviation.
CFB composite fractal behavior and smoothed atr.
Candle converter MTF.
The strategy uses these four indicators to generate inputs and outputs.
Basically buy when cfb, rsi and atr go in the same direction upwards and the movement is accompanied by a rising volume (cfb green color and rsi Aqua ATR).
Idem in reverse for sell, when cfb, atra and rsi are giving a sell signal (Red color) and the volume is descending.
It is important that you also use other trading systems that you consider convenient. Support and resistance and also fibonacci levels all help to better trading.
Not all assets have or use the same configuration, for this, you must find the appropriate parameters with the variables, long length, short length, source, and period.
for example for btcusd the optimal parameters for me are:
long length = 2
short length = 2
signal length = 2
source = ohlc4
period = 9
It also has a take profit and stops loss tool in percentage.
remember to use parameters according to your tolerance as a trader or investor.
enjoy it
PD: you can write to me privately I have many optimizations and settings already done
este estrategia usa
1) trend
2)volatilidad
3)volumen
Tambien usted podrá encontrar en herramientas adicionales, rsi wilder on the chart y su desviación estándar.
CFB composite fractal behavior y atr suavizado.
Candle converter MTF.
La estrategia usa estos cuatro indicadores para generar entradas y salidas.
Básicamente buy cuándo cfb, rsi y atr van en la misma dirección hacia arriba y el movimiento está acompañado por un volumen ascendente (color verde cfb y rsi Aqua ATR).
Idem a la inversa para el sell, cuando cfb, atra y rsi están dando señal de venta (color Rojo) y el volumen es descendente.
Es importante que también use otros sistemas de trading que usted crea conveniente. Soporte y resistencia y también niveles fibonacci todo ayuda a un mejor trading.
No todos los activos tienen o usan la misma configuración para esto usted deberá encontrar los parámetros adecuado con las variables, long length, short length, source y period.
por ejemplo para btcusd los parámetros óptimos para mi son:
long length = 2
short length = 2
signal length = 2
source = ohlc4
period = 9
También posee una herramienta de take profit y stop lose en porcentaje.
recuerde usar parámetros acorde a su tolerancia como trader o inversor.
disfrutelo
Cryptotrading

Crypto Trend Following StrategyThis is the strategy script indicator of Crypto Trend Following Strategy which can be used for back testing. With study script indicator, strategy can be easily automated.
To set alerts, see Crypto Trend Following Study indicator.
Script is using several moving averages to keep you on the right side of the trend. Signals are also filtered based on other indicators to prevent buying already overbought or selling already oversold coins and avoid ranging markets.
MAIN GOAL
Main goal of the strategy is long-term stable profit. No strategy has 100% accuracy therefore there always will be some false signals. But patience pays, with Trend Following Strategy, you will get couple of small loses while waiting to get big wins when coin is trending strongly. As you never know the right time you must sustain and be in all trades to make sure that you will not miss the big move.
BACKTEST
This script is for free to play with so you can back test and see for yourself how the strategy performs on any of your favourite coins.
Strategy is optimized and back tested for USDT and BTC pairs on 6h timeframe but it can be used on any pair and any timeframe.
RISK & REWARD
Strategy does not use safety orders as DCAs usually leads to bag holding sooner or later. It does not use take profit either as strategy will tell you when to buy and when to sell based on the actual market condition.
You should always use stop loss to protect your account from drawdown or even being liquidated.
You can change stop loss or take profit as you like or even back test the strategy with your preferred settings to find what suits you best.
STRATEGY SETTINGS
You can use the strategy script for fine tuning and find best settings for yourself.
If you need any help with settings do not hesitate to ask. I would also appreciate any feedback and ideas how to improve the script.
==== Indicators settings ====
RSI Long < and StochRSI Long <
• used to filter out buy signals of already overbought coins - ( stoch ) RSI must be under set value to fire a BUY signal
RSI Short > and StochRSI Short >
• used to filter out sell signals of already oversold coins - ( stoch ) RSI must be over set value to fire a SELL signal
ADX >
• used to filter out buy or sell signals in ranging markets - ADX must be over set value to fire a BUY or SELL signal
MA Fast and Slow Length
• Two moving averages to indicate an actual short-term trend
Baseline Length & Type
• Baseline is a moving average which confirms the longer-term trend. You can set length and type of the moving average
==== Test period settings ====
• You can set the back tested window
==== Strategy settings =====
• Target Take profit and Stop loss in %
• Only LONG trades – tick if you do not want to calculate SHORT trades in the back test
• Plot key levels on chart – if you use stop loss and/or take profit, you can turn on levels of price to reach (yellow – bought price, red – stop loss – green - take profit)
Back test calculates with commission and fixed order size. You can change these settings on Properties Tab

MACD Bull Crossover and RSI Oversold 5 Candles Ago-Long StrategyHello everyone, I've been having a great time perfecting this strategy for a few weeks now. I finally feel like it's time to release it to the public and share what I have been working on.
This strategy only enters a long trade when the MACD crosses over the signal line and the RSI was oversold looking back 5 candles ago. The logic behind this is to wait for RSI to enter the oversold territory, and then when the market starts to recovery the MACD will crossover telling us the sell off is over.
This strategy will close once these 2 conditions are met.
1. MACD Histogram is above 0 and MACD crosses under the signal line.
2. RSI was overbought 5 previous candles ago.
In the strategies settings, you'll be able to enable visual stop-loss and profit levels and change those levels to what you like, enable up to 5 EMA'S,
ADDONS That Affect Strategy:
* Enable visual stop-loss and profit levels as soon as a buy signal is triggered.
* Modify stop-loss and profit levels.
* Modify RSI oversold and RSI overbought levels.
* Modify MACD Fast and Slow moving average.
ADDONS That Do Not Affect Strategy:
* Enable up to 5 EMA's. (This will not affect strategy, and is the only purpose is for people who like following EMA's.)
Thank you for taking the time to try my strategy. I hope you have the best success. I will be making a short strategy, and alerts for this strategy soon. Follow me for updates!

Strategy BTBTBTBT — strategy for only long positional trading of top cryptocurrencies. BTCUSD and ETHUSD are best suited for this strategy.
The main idea of the strategy is to buy cryptocurrency with a leverage of up to 1: 3 when the market is growing, and get rid of cryptocurrency when the market is not growing or falling.
The strategy is working on a daily timeframe .
To determine the trend, the strategy uses a combination of indicators MA25 and MA99.
To determine overbought (pump) and oversold (dump), the strategy uses the oscillator "SPPO".
The strategy has three trading conditions:
1) SPPO SPPOoverBought - "pump" market. Close all long positions or leave a position with a micro-leverage of 1: 0.1 for a period of 28 days.
3) Closing> MA25 > MA99 - uptrend in the market. We open the "long" position with a leverage of 1: 3.
If market conditions do not meet the above criteria, then the strategy does not have open positions.
Input parameters
Recommended timeframe D1.
FastLength - period for fast MA. Default = 25.
SlowLength - period of slow MA. Default = 99.
SPPOoverSold - trigger for determining the dump in the market. Default = -30.
SPPOoverBought - trigger to determine the pump in the market. Default = 35.
SPPOmaxForLong - the maximum value of SPPO for opening a long position. Default = 10.
LeverageLong - leverage when entering the market with a "long" signal. Default = 3.
LeveragePamp - the amount of leverage when entering the market with a "pump" signal. Default = 0.1.
LeverageDamp - the amount of leverage when entering the market with a "dump" signal. Default = 1.
Log equity chart - If true, use a logarithmic scale for a graph of equity. Default = false.

Squeeze Momentum Strategy SL TP v2Improved version of my Squeeze Momentum Strategy.
Changes:
Possible to change source: ohlc4, hl2, hlc3, close
Enter your stop loss and take profit in %, NOT ticks
Working and robust even without take profit / stop loss
Yearly drawdown lower than 20%
Backtesting
Backtested on BTCPERP (FTX). It shows much better results on 1h timeframe (about 200% yearly, 55% in 2020) and relatively low drawdown to date.
Initial Capital: $1000
Capital per trade: $1000
Including fee: 0.075% (buy + sell) side, type "taker"
Strategy doesn't repaint.
Shortly about Squeeze Momentum Indicator:
This is a derivative of John Carter's "TTM Squeeze" volatility indicator, as discussed in his book "Mastering the Trade" (chapter 11).
----------
To access : sign up on FTX using ref link from my signature.

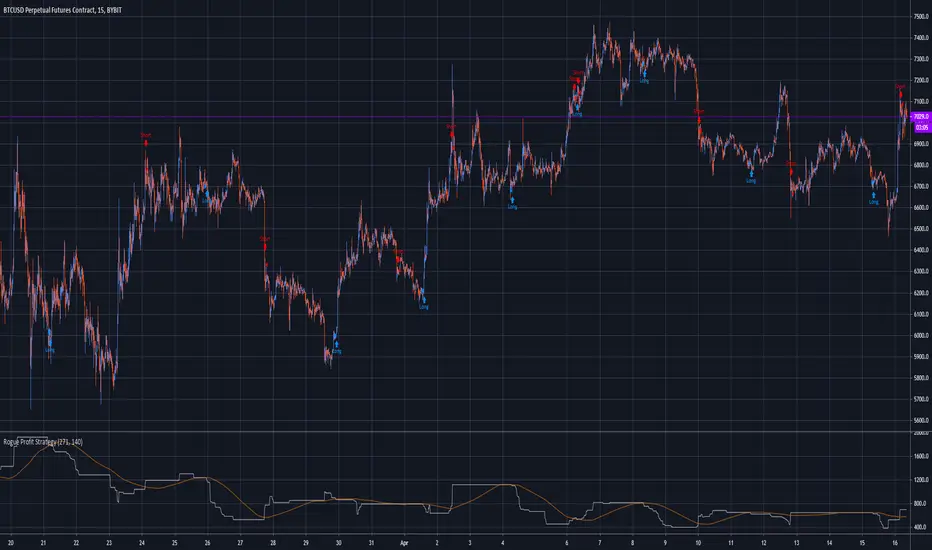
Rogue Profit StrategyThis is a complex script developed to measure specific volatility parameters and enter trades based on predetermined rules which are proprietary and will not be released, so don't ask for specific strategy settings.
The strategy keeps you in the market at all times either long or short. Parameters can be changed to better suit the asset your are trading, time frame and your particular trading style but the overall volatility rules for entering and exiting remain the same. It can be used to trade any asset but be aware the parameters you use for one asset, lets say Bitcoin, will not work with another asset like Forex. If the asset is on TradingView, you can use this indicator to trade it.
It is meant to trade pure price action candlesticks so do not use anything but a typical candlestick chart. You are going to have to put in some work and play around with the input parameters to make this strategy the most profitable for your trading style. Trading is hard but hopefully this strategy will help flatten the learning curve. This strategy is accompanied by an indicator study named "Rogue Profit Alert Indicator" that will work with setting alerts for manual or automated trading.
This strategy does NOT repaint.
This is a very powerful and profitable script that will simplify your trading and has been in development and tested for three years. Message for details on how to obtain access. Please allow up to 24 hours for a response.
Gekko DEMA StrategyThis script is based upon the Gekko trading strategy.
This strategy uses Exponential Moving Average crossovers to determine the current trend the market is in. Using this information it will suggest to ride the trend. Note that this is not MACD because it just checks whether the longEMA and shortEMA are % removed from each other.
* short is the short EMA that moves closer to the real market (including noise)
* long is the long EMA that lags behind the market more but is also more resistant to noise.
* the down threshold and the up threshold tell Gekko how big the difference in the lines needs to be for it to be considered a trend. If you set these to 0 each line cross would trigger new advice.
The base strategy has had money management logic added and has been tested for best results. Once you have access, you can modify these settings to find what works best for you.
Access to this strategy is FREE! Message me for more information on how to get access.

hamster-bot HiDeep strategy// DESCRIPTION OF STRATEGY
HiDeep Strategy
Author foresterufa
This is a counter-trending strategy that is gradually gaining a position against the trend at the best price.
A prerequisite for completing a position is the price exit from the internal channel on the chart and the appearance of the HiDeep indicator.
The condition for closing the position is touching the opposite side of the internal channel.
A condition for facilitating closure along the middle line of the channel, with high price volatility , is that the price touches the border of the external channel.
Input signals are generated by HiDeep indicators. Closing a position by moving averages.

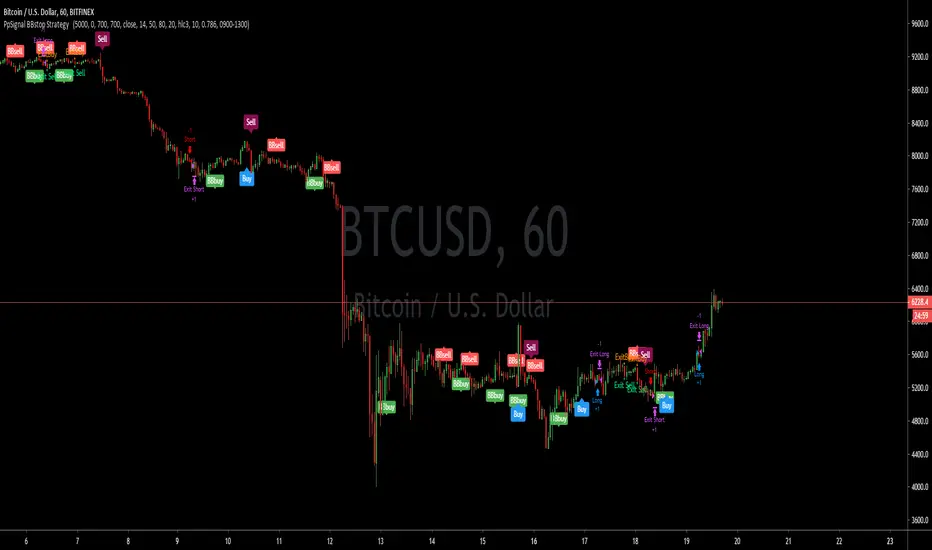
PpSignal BBstop Strategy strategy based on rsi of ma, in the example with btc usd we have as tp 1000 trailing stop 700, but you should adopt the money management to your criteria.
it has an alarm system when you see bbbuy or bbsell is a pre-notice only buy when the signal is Buy in blue or sell in maroon, it also has a buy exit and sell exit warning.
hamster-bot REP strategyThe strategy basically contains RSI + EMA + Parabolic = REP.
Entry: RSI
Trend Filter: EMA
Exit: Trailing Stop Parabolic

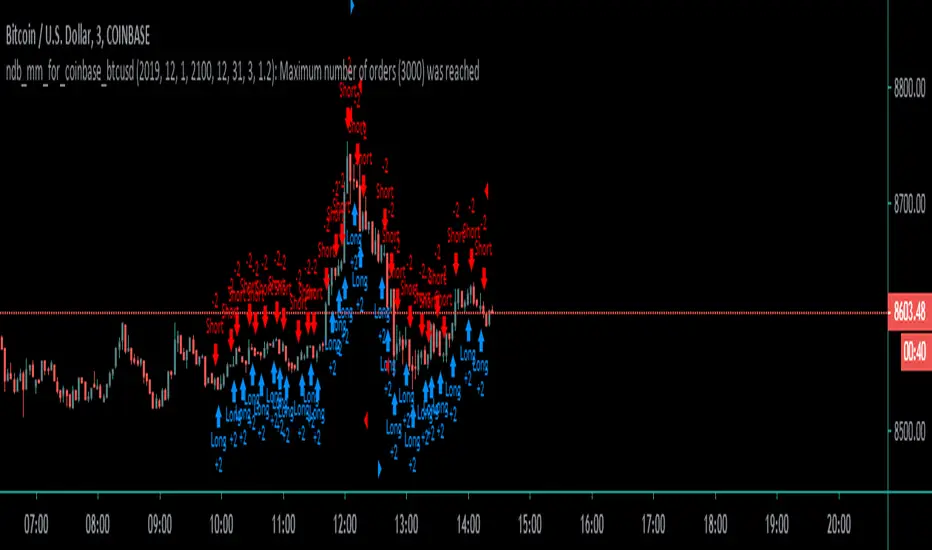
Coinbase_3-MIN_HFT-StrategyThis conceptual strategy trades against the short-term trend. The first position can be either long or short.
In the short-term, prices fluctuate up and down on wide spread exchanges.
And if the price moves to one side, the price tends to return to its original position momentarily.
This strategy set stop order. Stop price is calculated with upper and lower shadows.
[B] hamster-bot ZZ Breakout reversal strategyAttention! This is a beta version of the strategy script >> <<
A backtest should only be done if you understand how the options work. Otherwise, do a test in the release version

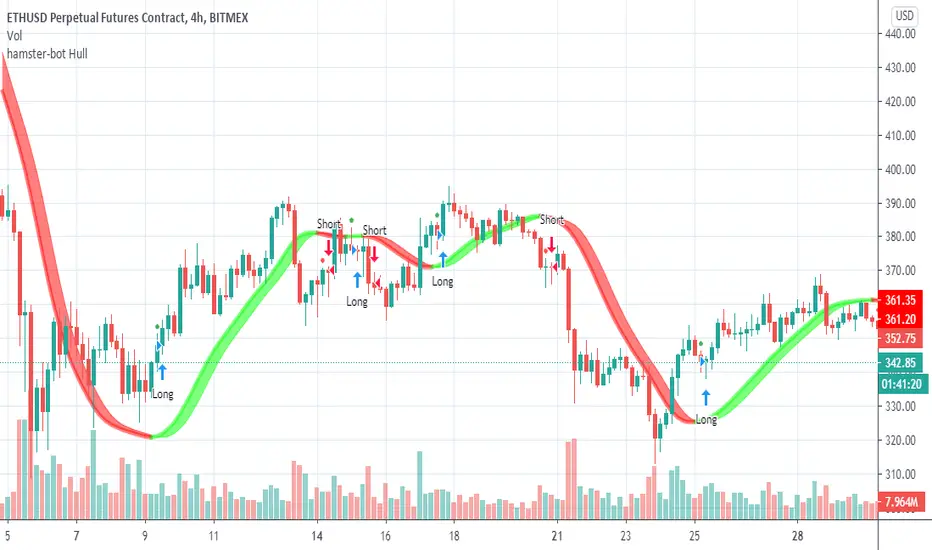
Hull Suite strategy + alerts hamster-botThis is a trading strategy on the Hull Suite indicator. 3 Hull variations: HMA, THMA (3HMA), EHMA. The strategy is always in position according to the trend of the indicator.
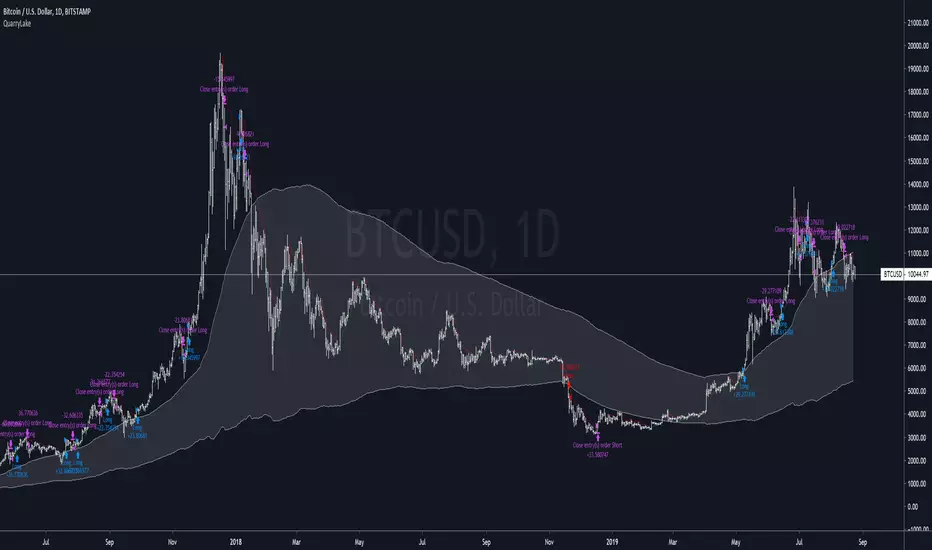
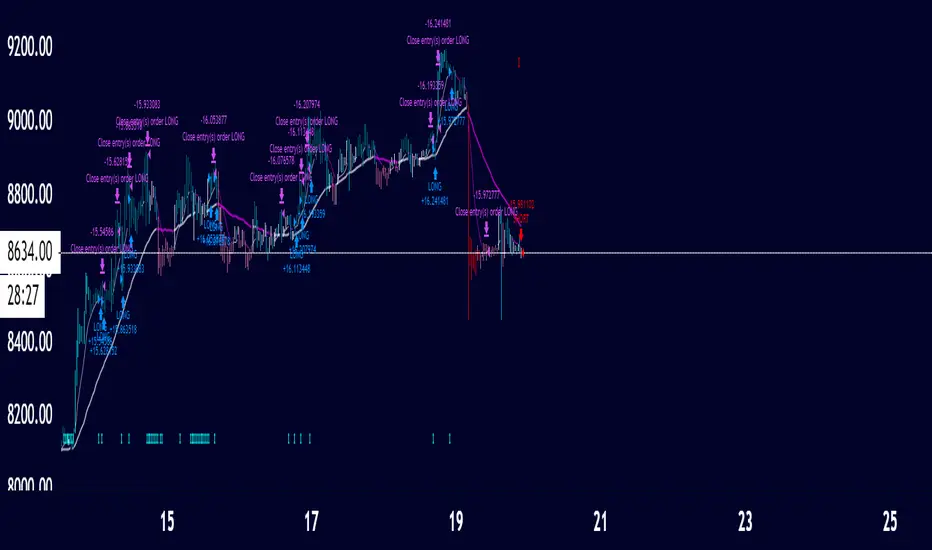
QuarryLake - An ATR base strategyThis strategy consists of 3 indicators that I found works quite well together.
Keltner Channel, Waddah Attah Explosion, and Volatility Stop.
You can find WAE here
KC Period = 200
KCATR = 5
Vstop Period = 3
Vstop Mult = 1.5
Long when close > KC, close > Vstop, WAE trendUp
Short when close < KC, close < Vstop, WAE trendDown
Works well on BTCUSD XBTUSD, as well as other major liquid Pair.
This strategy utilized a modified Kelly position sizing for BTCUSD Bitstamp, feel free to modify it to your needs.
More information can be found here dqydj.com
Feel free to follow me on Twitter @Lancelot_Auger for more free Alpha.
TrendaidTrendaid
is exactly what the name says
an Aid to Trend
Use this strategy to understand when the trend may shift and then use it to stay in the trends longer
simple strat
Buy when it says BULL in BLUE
Short when it says BEAR in RED
you may close your orders when it says to in PURPLE but unneeded if you want
You can adjust the stop which affects the scripts performance
You may also change from a Long to a Short line but the standard has proven to be the best overall
Let Trendaid guide you to riches
this was primarily designed for #forex but can be used in any market including #crypto
get access by joining the #CCV trading family by visiting the link below
- Cheers
SatoshiHeavy Market analyst for CCV Trading
www.cryptocurrentlyvip.com
PerPro Crypto ScalperPerPro Crypto Scalper es un algoritmo que funciona con 4 robot internos que trabajan sincronisadamente para enviar una senal de trading.
Según el crypto que se desee tradear es la configuración que le debemos colocar en trailing stop y take profit.
PerPro Crypto Scalper (CS) is an algorithm system with
with 4 internal robots that work synchronously to send you a trading signal.
Depending on the type of crypto you want to trade, it is the setting that must be configured. that I sent it by private message

PerPro V7 V3 Crypto ScalperIn this version of PERPRO Crypto you will be able to trade btcusd in 5 minutes and 1h, according to the recommendation enclosed. You can also look for other configurations at other times.
Money management for 1h
Take Profit = 12000
Stop Loss = 0
Trailing Stop Loss = 8000
Trailing Stop Loss Offset = 8000

PpSignal RENKO Strategy Versionwe did a strategy from renko indicator.
we added some highlight, MTF and Smooth Ppsignal KC.

PerPro V5 Publish updatedSend me a private message to be enabled
Algorithmic system with 80% assertiveness. DO NOT REPAINT
Please read
Use the system using other trend indicators. I attach some.
ideal for use in channels, resistances supports and Fibonacci levels.
Setting recommendation
- "For 1min TF = 15min"
- "For 5min TF = 60"
- "For 1H Forex TF = 4H Or D, for stock 1H TF = D"
- "For Day use TF = W"
- "For Week TF = M"
COINBASE:BTCUSD
Attached some indicators that may be useful

Simple Alt Coin Strategy - EMA and MACD w/Profit and StopThis script prints BUY and SELL signals based on settings you input. I use it to save time while scrolling through charts deciding what alts I want to look at.
BUY SIGNALS
Positive EMA Crossover
Positive MACD Crossover
Single Candle Gains
SELL SIGNALS
Profit Capture
Stop Loss
I don't trade based just on the BUY or SELL from this strategy, but I have found that these indicators do very well well looking at the large cap alt coins. It backtests well.
Default Settings EMA 5/12/50, MACD 9/12/26, Single Candle Gain 10%, Stop 10%, Profit Capture 45%

MACD + Stochastic + RSI StrategyMy strategy uses a combination of three indicators MACD Stochastic RSI.
The Idea is to buy when (MACD > Signal and RSI > 50 and Stochastic > 50) occures at the same time
This strategy works well on stocks and cryptos especially during market breaking up after consolidation
The best results are on Daily charts, so its NOT a scalping strategy. But it can work also on 1H charts.
The strategy does not have any stops and profit targets, so we can take all the market can give us at the moment.
The exit point only when MACD goes under Signal
Its Preformance is quite stable.
So, use it, trade it.
If it will help you to imprive your trading results, please donate me
BTC: 12kd1F8buWisUBdq27BBwRkUvzW7Ey3og5

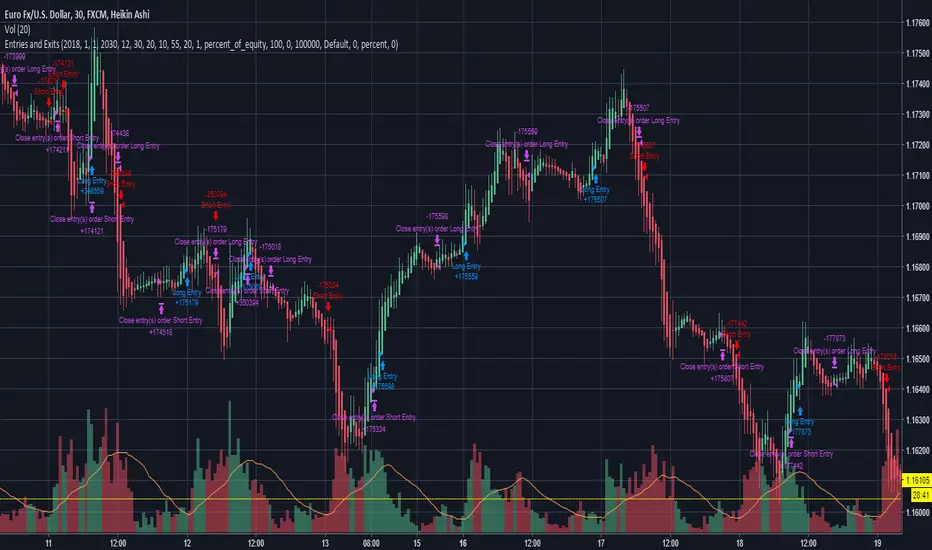
Entries and Exits (plus alerts)Simple breakout strategy that can be used for most equities, FOREX and cryptocurrencies. Inputs can be customized to suit your trading style and can be applied to any time frame chart. Comes with matching alert indicator which is useful for autotrading or just simply never missing a trade for manual trading. Please message me for access. Happy trading!
loscuentosdelacryptoThe stories of the crypto indicate possible areas to enter or exit with crossings of macd
Recommendations of this indicator
Use and compare with macd crossovers and the distance direction
Use zoom in the candle chart to see all the signs
Do not operate in lateral
Use temporality 15 minutes.
To request access I like it and send your request I will deliver it without cost
Español:
Los cuentos de la crypto indica posibles zonas en donde entrar o salir cumpliendo con cruces de macd
Recomendaciones de este indicador
Usar y comparar con cruces de macd y la direccion de la distancia
Usar zoom en el grafico de velas para poder ver bien todas las señales
No operar en lateral
Usar temporalidad 15 minutos.
Para pedir acceso dele me gusta y enviar su solicitud se lo entregare sin costo
