ScalpiusTrendCrypto trader and trading system developer Scott Phillips recently introduced a crypto trading system that specifies a set of rules for determining whether the crypto is in a trend. While the rules are not overly complex, they are complex enough that manual trend determination is somewhat laborious and prone to error. The ScalpiusTrend script is designed to automate this process. It operates is briefly summarized as follows:
1. It looks for a bar that breaks the Bollinger Band. That starts a pending trend.
2. When we find another bar with a higher high and higher close (uptrend) or lower low and lower close (downtrend), then the trend is confirmed.
3. The trend ends when the price touches the opposite Bollinger Band, or goes 20 bars without making a new low and new close.
The indicator is shown as a histogram plot below the main chart window. By default, the short black pending trend bars are off, but you can enable the Pending Bars checkbox in the indicator Settings menu to turn them on.
Kriptopara

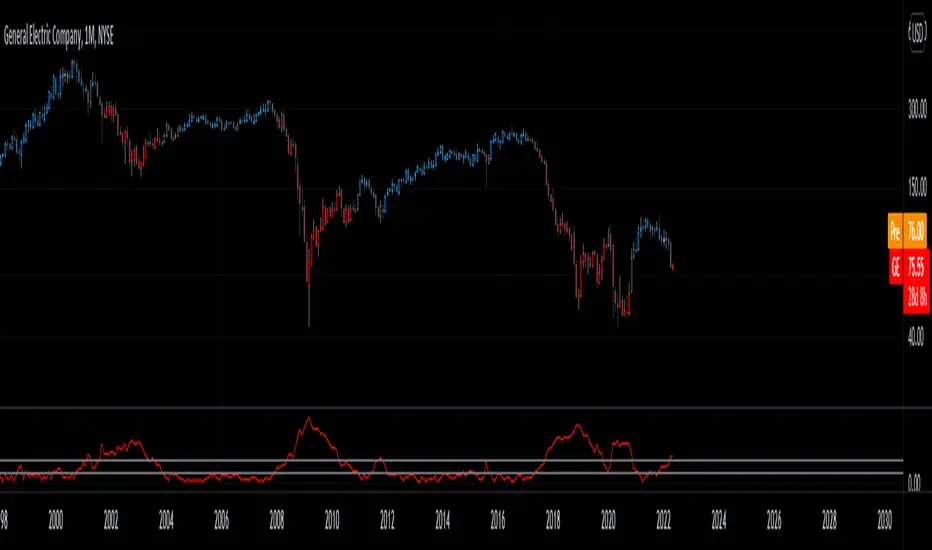
VIX FixSistema de trading hecho por Larry Williams, basado en VIX, optimizado para cualquier activo.
Formula:
(Highest (Close, 20) - Low) / (Highest (Close, 20)) * 100
Donde “Highest (Close, 20)” representa el cierre mas alto de los ultimos 20 periodos
Larry Williams Mechanical Trading System based on VIX.
The VIX Fix applies the same general formula that is used to calculate the stochastic indicator, so can be used for any asset:
(Highest (Close, 20) - Low) / (Highest (Close, 20)) * 100
Where “Highest (Close, 20)” means the highest closing value in the past 20 periods and the low refers
to the current period’s low. The formula can be applied to any timeframe.
Level 1 - Learn to code simply - PineScriptThe goal of this script is honestly to help everyone learn about trading with bots and algos.
At least, to get started.
Level 1:
10 lines of code.
learn to plot 2 moving averages on your chart.
learn to create a signal from a crossover.
learn the very basics of Pine Script algo.

Candle Colored by Volume Z-score [Morty]This indicator colors the candles according to the z-score of the trading volume. You can easily see the imbalance on the chart. You can use it at any timeframe.
In statistics, the standard score (Z-score) is the number of standard deviations by which the value of a raw score (i.e., an observed value or data point) is above or below the mean value of what is being observed or measured. Raw scores above the mean have positive standard scores, while those below the mean have negative standard scores.
This script uses trading volume as source of z-score by default.
Due to the lack of volume data for some index tickers, you can also choose candle body size as source of z-score.
features:
- custom source of z-score
- volume
- candle body size
- any of above two
- all of above two
- custom threshold of z-score
- custom color chemes
- custom chart type
- alerts
default color schemes:
- green -> excheme bullish imbalance
- blue -> large bullish imbalance
- red -> excheme bearish imbalance
- purple -> large bearish imbalance
- yellow -> low volume bars, indicates "balance", after which volatility usually increases and tends to continue the previous trend
Examples:
* Personally, I use dark theme and changed the candle colors to black/white for down/up.
Volume as Z-score source
Any as Z-score source, more imbalances are showed

Moving Averages With Cross AlertsA simple way to add up to 5 moving averages with optional crossover/crossunder alerts.
Available options for Moving Average Type are:
SMA
EMA (default)
HMA
RMA
WMA
VWMA
VWAP
ALMA
By default, 5 moving averages are enabled and set to the following:
MA1 set to 5
MA2 set to 13
MA3 set to 50
MA4 set to 200
MA5 set to 800
Each moving average has the following options:
Enable/Disable
Source (default is close)
Length
Color
Premium IndexThis indicator shows the premium index data for the market (only crypto) you're currently looking at.
The premium index is the difference in price between the perpetual swap contract and the spot index price.
In plain and simple English: it shows whether the spot market for a specific coin is trading at a discount or at a premium.
This is official data from the exchange itself.
At the moment of publishing TradingView only has data for Binance.
So only use this indicator on Binance charts right now (USDT perps and BUSD perps).
Make sure you're looking at a perpetual swap contract, if you're looking at the spot market for example the indicator won't work.
Once TradingView adds more data like this I'll try to make sure that the logic of the code will also work for other markets.

4 EMA & 2 SMA Gen6Indicador hecho con mucho cariño para la comunidad de CRIPTO BUZZ.
Espero les sirva Mucho y puedan ahorrarse espacios de indicadores. Luis S. G6

Buy/Sell Aggregated Delta Pressure - InFinitoModified & Updated script from MARKET VOLUME by Ricardo M Arjona @XeL_Arjona that Includes Aggregated Volume , Delta Buy/Sell Pressure
Aggregation code originally from Crypt0rus
***The indicator can be used for any coin/symbol to aggregate volume , but it has to be set up manually***
***The indicator can be used with specific symbol data only by disabling the aggregation option, which allows for it to be used on any symbol***
- Calculated based on Aggregated Volume instead of by symbol volume . Using aggregated data makes it more accurate and allows to compare volume flow between different kinds of markets (Spot, Futures , Perpetuals, Futures+Perpetuals and All Volume ).
- As well, in order to make the data as accurate as possible, the data from each exchange aggregated is normalized to report always in terms of 1 BTC . In case this indicator is used for another symbol, the calculations can be adjusted manually to make it always report data in terms of 1 contract/coin.
- Buy/Sell Pressure: Smoothens the buy and sell volume into a signal for each. Which makes it easier to identify Buy and Sell Volume Flow.
- Buy/Sell Delta Pressure: Calculates the difference between Buy & Sell Pressure and plots a Delta signal that shows who is in control currently.
- Buy/Sell + Delta Pressure: Displays both Buy & Sell Pressure and Delta pressure. This can help to visualize who is in control but also how much pressure there is on each side.
- A Moving Average can be plotted to the Delta pressure. This, with confluence, can give great entries/exits
Things to look for:
- Divergences: If price keeps moving in one direction but the pressure to that side decreases it can be inferred that the move might slow down soon or revert. As well if pressure to one side increases but price does not react to it, it signals that the other side is stronger.
- MA/Zero Crossovers: Delta Pressure Crossover of its moving average or the 0 Line can indicate direction changes prematurely

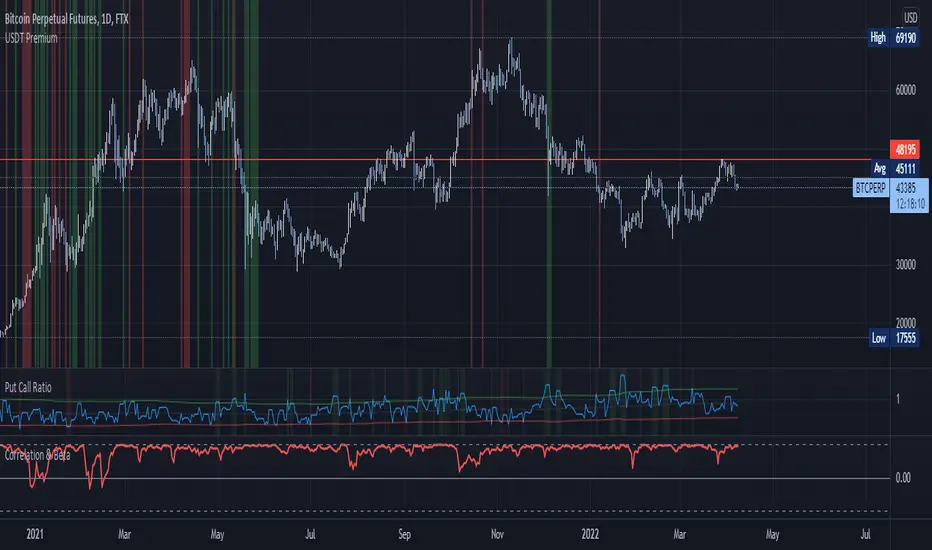
USDT/USD PremiumKraken + FTX USDT premium indicator.
Inspired by John J Brown, forked from IAmSatoshi (Migrated to V5 and few changes + more markets coming).
John J Brown: "
USDt premium/discount exist because of conversion fees.
It is a good market indicator:
If USDt>USD, then market is growing and in need of liquidity;
If USDt
Aggregated Money Flow Index - InFinitoModified Version of In-Built Money Flow Index Indicator. Aggregated Volume is used for it's calculation + a couple of other features.
Aggregation code originally from Crypt0rus
***The indicator can be used for any coin/symbol to aggregate volume , but it has to be set up manually***
***The indicator can be used with specific symbol data only by disabling the aggregation option, which allows for it to be used on any symbol***
- Calculated based on Aggregated Volume instead of by symbol volume . Using aggregated data makes it more accurate and allows to compare volume flow between different kinds of markets (Spot, Futures , Perpetuals, Futures+Perpetuals and All Volume ).
- As well, in order to make the data as accurate as possible, the data from each exchange aggregated is normalized to report always in terms of 1 BTC . In case this indicator is used for another symbol, the calculations can be adjusted manually to make it always report data in terms of 1 contract/coin.
- Added Moving Average ( SMA , EMA , WMA , RMA, VWMA ) that can be plotted to the MFI
- Added 10/90 level and 45/55 range level
Things to look for:
- Divergences: Can be a very good reversal signal
- MA crossovers & Oversold/Overbought levels crossover: With proper confluence, entering a position at MA crossover and exiting at oversold/overbought levels can give very good swing setups (Or scalps on LTF)
- Center range retests: Once in a trend, retesting the middle range can give very good entries and confirmations of the trend
- Confluence of the latter: In combination, if more than one of these occur at the same time it can give more clarity regarding the current state of the market.

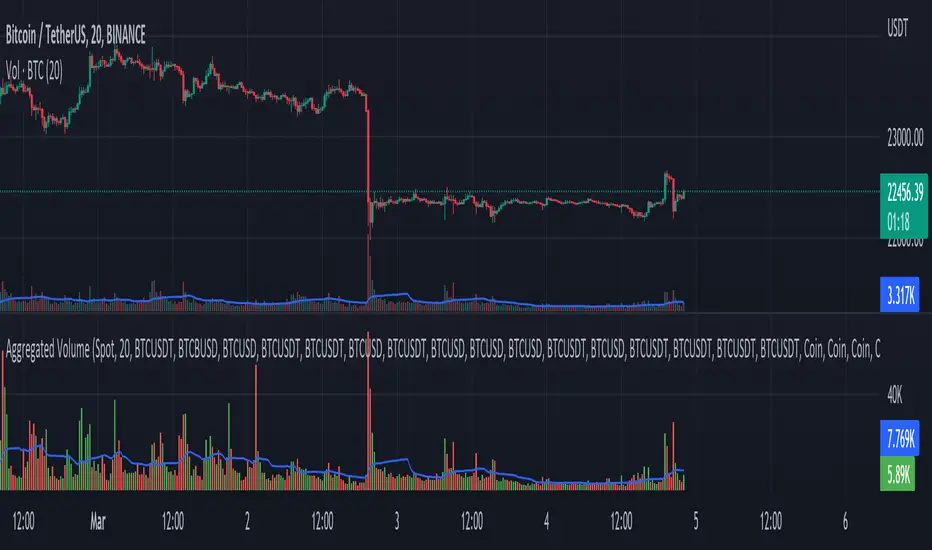
Aggregated Volume - By InFinitoVolume indicator that works like a normal Volume indicator with the following additional features:
- Aggregates Volume across different exchanges and Market Types - *Original Aggregation Code By Crypt0rus*
- Displays data by Market Type and combinations of Market Types (Spot, Futures , Perpetuals, Futures+Perpetuals & All Volume )
- Allows for the user to select the exchanges from which to aggregate Volume (This allows for the aggregation of any other pair i.e ETH, SOL, LUNA)
- Normalizes the Volume reported through TradingView by every exchange in order to homogenize the data (i.e Binance reports Bitcoin Volume in BTC terms BUT FTX reports Bitcoin Volume in USD)
- Allows for manual input of how Volume is reported in a particular Pair/Exchange (i.e If you want to aggregate data from the BTCEUR pair, you can select 'Other' and introduce the Value of EUR in USD terms)
COIN: Select this option if the volume is reported in terms of the asset traded ( BTC , ETH, SOL, etc....)
USD: Select this option if the Volume is reported in terms of the USD amount traded
OTHER: Select this option in case the Volume is reported in another currency (EUR, ETH, etc....)
NOTE: *ALL VOLUME IS AGGREGATED IN TERMS OF THE ASSET TRADED, FOR EXAMPLE IN THIS CASE: BTC . BUT IF YOU'RE AGGREGATING BNB PAIRS, VOLUME WILL BE CALCULATED TO BE DISPLAYED IN BNB TERMS*
Feel free to leave suggestions/questions in the comments or to message them directly to me
Triple SWMA + EMA Crossover Color Candle+ ADX Color Candle V2! IMPORTANT !
To better see the color of the bars I suggest you deactivate the Borders option in the chart settings / Symbol, LIKE THIS:
════════════════════════════════════════════════════════════════════════════════════════════════════════════════════
The indicator is the same as the previous version, with the only difference that now the indicator is composed of an addition of secondary candles colored according to the EMA cross, while the main candles based on the ADX, the SWMA are inserted into secondary candles
════════════════════════════════════════════════════════════════════════════════════════════════════════════════════
1) SWMA
There are 3 SWMA , with the possibility of modifying the Source and the length of each one, also each SWMA can be removed or can all of them be removed with the ON / OFF option in Inputs-STYLE. (ALL SWMA?)
════════════════════════════════════════════════════════════════════════════════════════════════════════════════════
2) EMA Fast and Slow, Cross
There are two EMAs, fast and slow, both with the possibility of changing the source and length, in the chart settings it is possible to change the color of EMA Long and EMA Short:
EMA Long = Ema Fast > Ema Slow
EMA Short = Ema Slow > Ema Fast
Ema cross has a style choice option, the possible choices are:
NONE = nothing
ALL = all choices
LINE = ema200 colored based on Ema Long-Short
BAR COLOR = color candles based on Ema Long-Short
PLOTSHAPE = signals based on Ema Long-Short
LINE + BAR COLOR = line + bar color
BAR COLOR + PLOTSHAPE = bar color + plotshape
════════════════════════════════════════════════════════════════════════════════════════════════════════════════════
3) ADX Candle
The candles are colored according to 4 inputs:
Color 1 ( Silver ) = ADX < 20
Color 2 (Black) = ADX cross-ADX Index (adx+adx 14 period back) / 2
Color 3 (Lime) = ADX > 0 and DI delta (DI plus - DI minus) > 0
Color 4 (Red) = ADX > 0 and DI delta (DI plus - DI minus) < 0
all colors are editable and if you don't want to have ADX Candle on the chart, just remove the ON / OFF option in Inputs-STYLE. (BAR COLOR ADX )

Triple SWMA + EMA Crossover Color Candle+ ADX Color CandleIMPORTANT
The indicator allows you to view the Color Bars only if it is in the foreground, to do this just put the indicator before the description of the symbol, LIKE THIS:
════════════════════════════════════════════════════════════════════════════════════════════════════════════════════════════════
This indicator is composed of:
1) Tiple SWMA
There are 3 SWMA, with the possibility of modifying the Source and the length of each one, also each SWMA can be removed or can all of them be removed with the ON / OFF option in Inputs-STYLE. (ALL SWMA?)
════════════════════════════════════════════════════════════════════════════════════════════════════════════════════════════════
2) EMA Fast and Slow, Cross
There are two EMAs, fast and slow, both with the possibility of changing the source and length, in the chart settings it is possible to change the color of EMA Long and EMA Short
EMA Long = Ema Fast > Ema Slow
EMA Short = Ema Slow > Ema Fast
Ema cross has a style choice option, the possible choices are:
ALL = all choices
LINE = ema200 colored based on Ema Long-Short
BAR COLOR = color candles based on Ema Long-Short
PLOTSHAPE = signals based on Ema Long-Short
LINE + BAR COLOR = line + bar color
BAR COLOR + PLOTSHAPE = bar color + plotshape
if you don't want to have EMA Fast and Slow, Cross on the chart, just remove the ON / OFF option in Inputs-STYLE. (EMA style)
════════════════════════════════════════════════════════════════════════════════════════════════════════════════════════════════
3) ADX Candle
The candles are colored according to 4 inputs:
Color 1 (Silver) = ADX < 20
Color 2 (Black) = ADX cross-ADX Index (adx+adx 14 period back) / 2
Color 3 (Lime) = ADX > 0 and DI delta (DI plus - DI minus) > 0
Colo 4 (Red) = ADX > 0 and DI delta (DI plus - DI minus) < 0
all colors are editable and if you don't want to have ADX Candle on the chart, just remove the ON / OFF option in Inputs-STYLE. (BAR COLOR ADX)

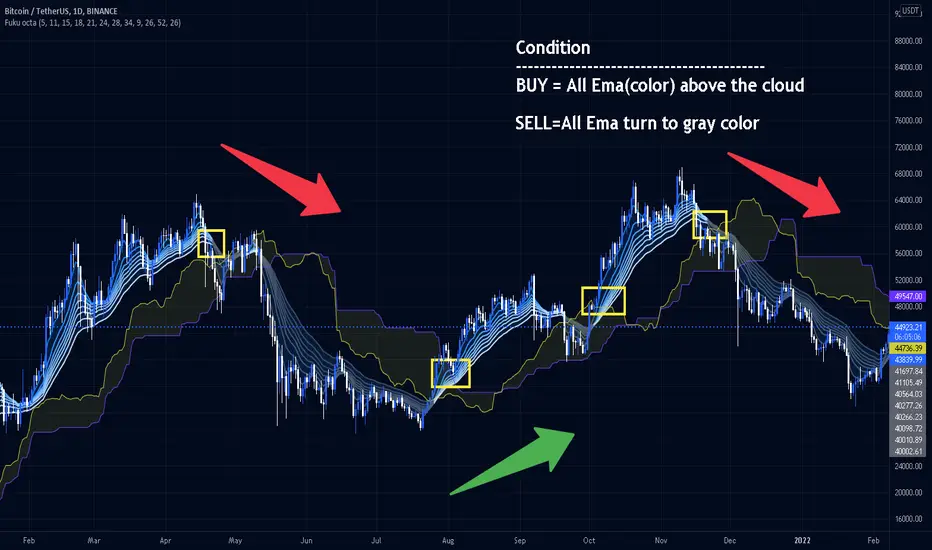
Fukuiz Octa-EMA + IchimokuThis indicator base on EMA of 8 different period and Ichimoku Cloud.
#A brief introduction to Ichimoku #
The Ichimoku Cloud is a collection of technical indicators that show support and resistance levels, as well as momentum and trend direction. It does this by taking multiple averages and plotting them on a chart. It also uses these figures to compute a “cloud” that attempts to forecast where the price may find support or resistance in the future.
#A brief introduction to EMA#
An exponential moving average (EMA) is a type of moving average (MA) that places a greater weight and significance on the most recent data points. The exponential moving average is also referred to as the exponentially weighted moving average. An exponentially weighted moving average reacts more significantly to recent price changes than a simple moving average (SMA), which applies an equal weight to all observations in the period.
I combine this together to help you reduce the false signals in Ichimoku.
#How to use#
EMA (Color) = Bullish trend
EMA (Gray) = Bearish trend
#Buy condition#
Buy = All Ema(color) above the cloud.
#Sell condition#
SELL= All Ema turn to gray color.
Concept Dual SuperTrendSimple SuperTrend indicator giving you the option to display two SuperTrends on a single script plus additional customization features. Dual setup inspired by Income Sharks 🦈

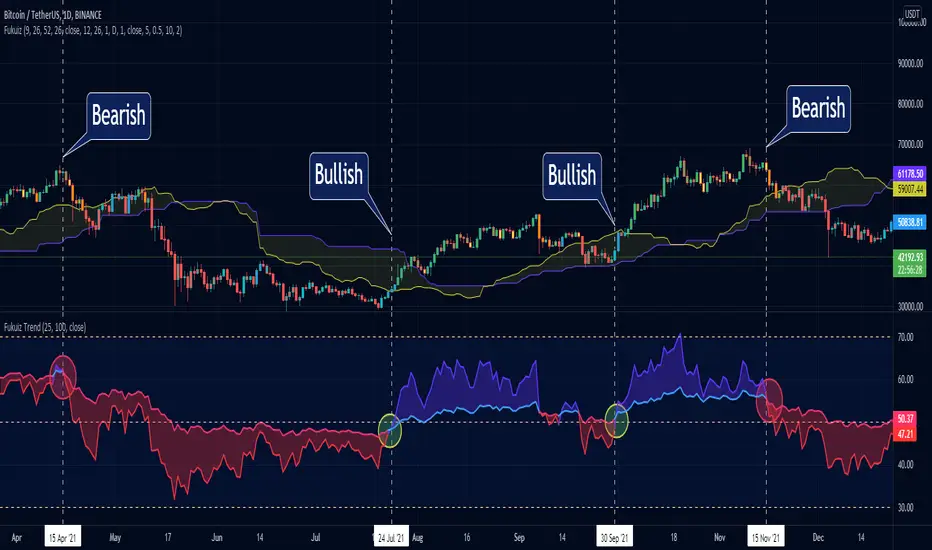
Fukuiz TrendThis indicator base on RSI of 2 different periond.
#A brief introduction to RSI #
The relative strength index (RSI) is a momentum indicator used in technical analysis that measures the magnitude of recent price changes to evaluate overbought or oversold conditions in the price of a stock or other asset. The RSI is displayed as an oscillator (a line graph that moves between two extremes) and can have a reading from 0 to 100. The indicator was originally developed by J. Welles Wilder Jr. and introduced in his seminal 1978 book, “New Concepts in Technical Trading Systems.”
Traditional interpretation and usage of the RSI are that values of 70 or above indicate that a security is becoming overbought or overvalued and may be primed for a trend reversal or corrective pullback in price. An RSI reading of 30 or below indicates an oversold or undervalued condition.
#In this indicator#
I see that you can use 2 RSI with different periond to suggest Bullish trend and Bearish trend.
#Conditions between short and long RSI crossing#
Crossover = Bullish trend (blue zone)
Crossunder = Bearish trend (red zone)
Lankou VS BTC all
/!\ To make it work well use -> pin at new right scale
This script displays the comparison with BTCUSDT
it permits to see if an asset is gaining value against BTC, and fastly scan USDT asset to determine if they are bullish
It works for ANY asset, as it's dividing it's price by the BTCUSDT one

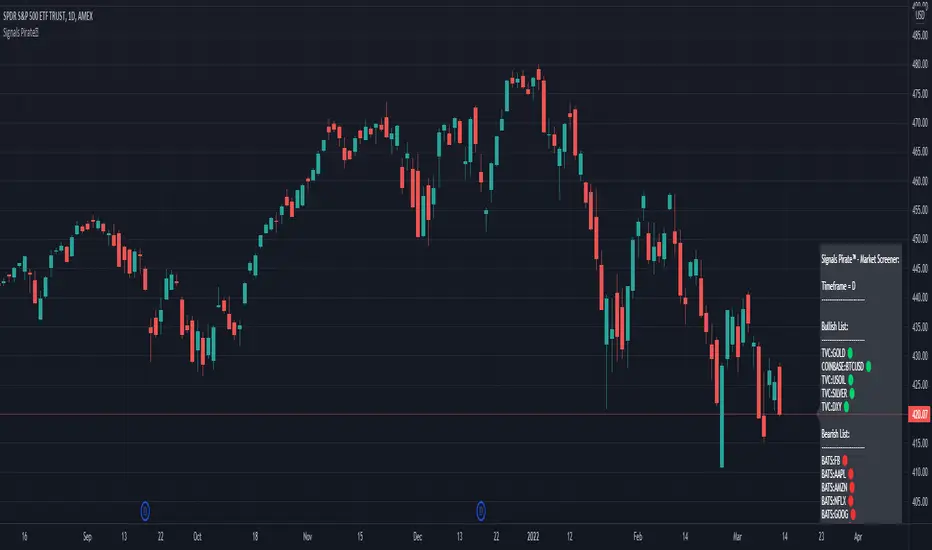
Signals Pirate™ Market ScreenerSignalsPirate™ Market Screener provides users with the ability to quickly and easily check the current trend of up to 40 different assets on any timeframe! With a simple ‘Bullish’ or ‘Bearish’ trend easily defined using accurate and reliable calculations, this tool could massively cut down the amount of time your TA takes!
The main Input options are 'Reactivity' and 'Depth', which allow for a dynamic trend following strategy that works on all time frames and assets. Using these values the strategy will print the bundles main ‘Buy’ and ‘Sell’ signals to try and identify the trend early and accurately. Their main functions are to dynamically calculate volatility and current trend direction – but we’ve gone more in-depth below!
Reactivity:
Reactivity controls how quickly the Algo reacts to changes in trend. This part of the bundle takes into account the Average True Range (ATR) to gauge current market volatility and direction of the trend. Lowering the reactivity value will generate quicker reaction times of the algorithm as it will lower the threshold of volatility required for a signal to be generated. Therefore, it’ll show trades more frequently.
Depth:
Depth controls the position of the signals according to the trend swing. Calculated using a variation of the Average Direction Index (ADX) to measure the changes in prices over a given period, when running parallel to the Reactivity volatility filter the trend can be identified quickly and accurately on any given time frame or asset. Higher Depth will allow for less frequent and slower entries. In contrast, lower Depth will give more frequent and earlier entries.
The default settings are the best settings we’ve found so far but you can change them to build your own unique trading strategy. We’d recommend experimenting with these values to find the best results for the asset you are trading, and your own personal trading and investing style.
Direction for use:
1. Use on any asset class and time frame and add the tickers of any asset you want included in the screener.
2. Fine tune the Reactivity (volatility) and Depth (trend sensitivity).
3. Consider longing assets that appear in the ‘Bullish List’ after candle close, and consider shorting assets that appear in the ‘Bearish List’ after candle close.
4. Exit positions once an asset has switched from one list to the other.
As mentioned previously, this Market Sceener uses a trend base system that dynamically operates to function with superior accuracy regardless of what you’re trading. But with the level of customisation available, this can easily be fine tuned to accommodate scalping, reversal trading, or even long term investing.
We hope you love this Screener, and it takes your trading and investing to the next level. Please let us know if you have any questions or queries regarding the logic behind the bundle, or if you have any suggestions for improvements etc. We love your feedback and are constantly striving to continuously improve!
Volatility indicator based on ATR Hello,
I'm sharing to you a volatility indicator I've done in the last few weeks based on ATR. There is multiple functionalities on this indicator, the first one is an overlay displaying when an asset is in an "overvolatily zone"
(displayed with red cross) and when we are in an "undervolatily zone" (displayed with green cross). You can change the sensibility of the signals in the parameters if you wish to have more or less greedy signals
(it will only modify the overvolatility signals). By the way those signals are not working for week-ends because volatility works differently on week-ends and it's not a good idea to count week-ends in the calculations, so do not worry if you see no signals on weekends.
Second part of the indicator is something I called "Atr bands" it's an equivalent to the famous Bollinger-Bands but based on ATR. I haven't backtested them yet but they seems really interesting in low ut
(15 mins seems to be the best ut for those) and they seems pretty bad in high ut so they can maybe be useful for low ut scalping.
Last thing, there is a parameter allowing you to display bands on the week-ends so you can easily see where the indicator won't give signals.
I would be really happy if I could have some feedsback if you try the indicator :)
Have a wonderful day

RSI PRECISION (MACD & SMA Signals)RSI PRECISION (Plus MACD & SMA Signals)
Codded by Giorgos Protonotarios, March 2022
This is an enhanced version of RSI PRECISION that incorporates RSI readings and key TA signals into a single oscillator.
■ RSI PRECISION SHORT DESCRIPTION & WHAT IS NEW
RSI PRECISION is an oscillator designed to enhance the classic RSI with price volatility and make it more accurate at longer time frames and during choppy market conditions. The oscillator is ideal for analyzing volatile markets, such as the cryptocurrency market.
In this second version, the RSI Precision formula remains the same, however, there are additional features.
The new oscillator now includes three different trading signals:
• MACD Crossovers (•) -New
• SMA Death/Golden Crosses (x) -New
• RSI Crossovers/Crossunders (▲▼)
■ MACD BULLISH & BEARISH CROSSOVERS
The MACD signals are visualized by a green/red dot (•). The default settings are the standard MACD settings (12,6,9).
NOTE: In lower timeframes, MACD generates too many signals. You can switch off “MACD BULLISH & BEARISH CROSSOVERS” by clicking on ‘SETTINGS’, then ‘STYLE’, and then unselecting ‘Bullish MACD Cross’ and ‘Bearish MACD Cross’.
(i) Bullish MACD cross
• Symbol: Green Dot (•) on the Top
• Event: MACD crosses above its signal line
(ii) Bearish MACD cross
• Symbol: Red Dot (•) on the Bottom
• Event: MACD crosses below its signal line
■ SMA CROSSOVERS
The SMA crossovers are visualized by (X). By default, 50 periods for the fast SMA and 200 periods for the slow SMA (both are customizable).
NOTE: If you change the fast SMA to 1 period, the fast SMA becomes the closing price. Therefore, you can receive signals when the price crosses a key MA, for example, SMA(200).
(i) Bullish SMA Cross
• Symbol: Green (X) on the Top
• Event: The fast SMA crosses above the Slow SMA
(ii) Bearish RSI Cross
• Symbol: Red (X) on the Bottom
• Event: The fast SMA crosses below the Slow SMA
You can adjust the periods for both SMAs (Settings).
■ RSI CROSSOVER/CROSSUNDER
This signal corresponds to a bullish/bearish RSI Precision cross. By default, it is 5 for a bullish crossover and 100 for a bearish crossunder. Of course, these numbers are indicative and can be customized.
(i) Bullish RSI Precision Cross
• Symbol: Green arrow (▲) on the Top
• Event: The RSI Precision crosses above level 5
(ii) Bearish RSI Precision Cross
• Symbol: Red arrow (▼) on the Bottom
• Event: The RSI Precision crosses below level 100
■ RSI PRECISION MISSION
To enhance RSI and make it more accurate on longer time frames, choppy market conditions, and especially during market tops/bottoms.
■ RSI PRECISION OBJECTIVES
(1) identify overbought/oversold market levels in a simple and user-friendly manner
(2) make precise calculations near market tops and bottoms, where price volatility is always booming
(3) make precise calculations on longer time frames (monthly, weekly) where RSI readings are hardly readable
(4) offer three types of trading signals (RSI, MACD, SMA)
■ RSI PRECISION CALCULATIONS
The RSI PRECISION formula consists of 3 different modules:
(a) Relative Strength Index readings
(b) Price Volatility module
(c) RSI Volatility module (optional)
■ BASIC SETTINGS
--RSI PERIODS: -By default, 14.
---RSI PRECISION FORMULA
(i) RSI FACTOR (%)
-You can adjust the weight of RSI readings in the formula.
-By default, 100%.
(ii) PERIODIC PRICE VOLATILITY (%)
-You can adjust the weight of Periodic Price Volatility in the formula.
-By default, 100%.
(iii) RSI VOLATILITY (%)
-This is an extra measurement of volatility. This time the focus is exclusively on periodic RSI volatility, not on price volatility.
-By default, 5%.
--RSI CROSSOVER/CROSSUNDER LEVELS
You can adjust the levels for an RSI PRECISION crossover/crossunder.
- By default, 5 for a bullish crossover and 100 for a bearish crossunder.
--PERIODS FOR SMA CROSSOVERS
You can adjust the periods for the two SMAs.
-By default, 50 periods for the fast SMA and 200 periods for the slow SMA. Some traders describe the crossing of these two SMAs (50/200) as the “Golden/Death Crosses”.
■ FINAL THOUGHTS
The new RSI Precision combines everything in one place. I have been using this enhanced version, myself, as my only oscillator.
As always, happy trading... and remember to make charts, not war.
□ Giorgos Protonotarios,
Financial Analyst, Building Web
(March 2022)

Signals Pirate™ Buy Sell SignalsSignalsPirate™ Algo Premium includes standard Buy and Sell signals on the chart, All-in-One Premium Market Dashboard with current trades, and a wide variety of customizability to help you create your own, unique trading strategies.
The main Input options are 'Reactivity' and 'Depth', which allow for a dynamic trend following strategy that works on all time frames and assets. Using these values the strategy will print the bundles main ‘Buy’ and ‘Sell’ signals to try and identify the trend early and accurately. Their main functions are to dynamically calculate volatility and current trend direction – but we’ve gone more in-depth below!
Reactivity:
Reactivity controls how quickly the Algo reacts to changes in trend. This part of the bundle takes into account the Average True Range (ATR) to gauge current market volatility and direction of the trend. Lowering the reactivity value will generate quicker reaction times of the algorithm as it will lower the threshold of volatility required for a signal to be generated. Therefore, it’ll show trades more frequently.
Depth:
Depth controls the position of the signals according to the trend swing. Calculated using a variation of the Average Direction Index (ADX) to measure the changes in prices over a given period, when running parallel to the Reactivity volatility filter the trend can be identified quickly and accurately on any given time frame or asset. Higher Depth will allow for less frequent and slower entries. In contrast, lower Depth will give more frequent and earlier entries.
The default settings are the best settings we’ve found so far but you can change them to build your own unique trading strategy. We’d recommend experimenting with these values to find the best results for the asset you are trading, and your own personal trading and investing style.
Direction for use:
1. Use on any asset class and time frame.
2. Fine tune the Reactivity (volatility) and Depth (trend sensitivity).
3. Enter Long on ‘Buy’ signal after candle close, enter Short on ‘Sell’ signal after candle close.
4. Exit position on opposite entry signal, for example if you’re currently in a Long position and a ‘Sell’ signal is printed, close your Long position at the candle close, even if you do not plan on shorting and vice versa.
As mentioned previously, this is a trend base system that dynamically operates to function with superior accuracy regardless of what you’re trading. But with the level of customisation available, this can easily be fine tuned to accommodate scalping, reversal trading, or even long term investing.
The Dashboard shows the most relevant and real-time information within a simple panel on the chart. It includes three sections. The first section shows Volatility, Volume, Current Sentiment. The second section shows Trends from a 1-minute timeframe to a Month. The third section shows current trade with Variable TP 1, TP 2, TP 3 (calculated using a combination of S/R levels and ATR values), and Maximum Profit for the current trade that could have been entered using this bundle.
We hope you love this all in one package, and it takes your trading and investing to the next level. Please let us know if you have any questions or queries regarding the logic behind the bundle, or if you have any suggestions for improvements etc. We love your feedback and are constantly striving to continuously improve!

[Joy] AladdinDirectly used for entertainment purposes in figuring out the market trend:
Sell/bearish sign: I open a short position on the candle's close. I am bearish on the instrument.
Buy/bullish sign: I open a long position on the candle's close. I am bullish on the instrument.
Red circle: If I run a long position, I take at least 50% unrealized profit into a realized profit on the close candle. I might even convert some portion of the underlying spot into stable coins. I am essentially taking profit along the way as the trend is developing.
Green circle: If I am running a bearish short position, I take at least 50% unrealized profit into a realized profit on the candle's close. I am essentially taking profit along the way as the trend is developing.
Below are used for indications only:
Down Arrows: It is not directly used in opening/closing positions. When the down arrow finishes and the candle close, it sometimes indicates a local top. It does not mean the macro trend has changed.
Up Arrows: It is not directly used in opening/closing positions. When the up arrow finishes and the candle close, it sometimes indicates a local bottom. It does not mean the macro trend has changed.
Red Crosses: It indicates a squeeze may be incoming. When the red crosses finish, the price may move significantly in any one direction. It does not say which direction. It only gives me caution.
Experimental - Below Work in Progress may be from the config only:
>> Jasmine - Tweak of Aladdin
>> Candle color - Logic is different from Aladdin
>> Background color - Logic is different from Aladdin
FAQs
Q: Does it use some EMA /MA/Ichimoku/Parabolic SAR, etc? Does it use any indicator with tweaked settings?
Answer: No.
Q: What does it mostly use?
Answer: Volume and gradual flow of non-interrupted data. The logic depends on the correlation between volume , price bars and the wicks.
Q: Can you make it free or make it open source?
Answer: There is no free lunch in this world. I will never reveal or share the source code or make it free for all!
Q: Do you provide ongoing support for the indicator?
Answer: Yes, I will continue updating the indicator as long as I can. However it depends entirely on me. I may stop updating as well.
Q: Are the bullish /buy & the bearish /sell markers automatic?
Answer: Yes. I do not control it!
Q: Is this financial advice?
Answer: Any views expressed by the indicator are personal entertainment views & shouldn't form a basis for making investment decisions, nor be construed as a recommendation or advice to engage in investment transactions. It is not financial advice. I highly recommend not even think of using this for actual real-life trading with real money. Neither I nor the indicator is responsible for any misuses, including any profit/loss. There is no warranty on this entertainment product

Combo Ichimoku + CDC Action Zone by fukuizThis indicator combines the famous indicators Ichimoku and CDC ActionZone.
#A brief introduction to Ichimoku #
The Ichimoku Cloud is a collection of technical indicators that show support and resistance levels, as well as momentum and trend direction. It does this by taking multiple averages and plotting them on a chart. It also uses these figures to compute a “cloud” that attempts to forecast where the price may find support or resistance in the future.
#A brief introduction to CDC ActionZone #
CDC ActionZone is a very simple system, utilizing just two exponential moving averages. The 'zones' in which different 'actions' should be taken are highlighted in different colors. Calculations for the zones
They are based on the relative position of price to the two EMA lines and the relationship between the two EMAs.
The CDC ActionZone was developed by Piriya333, a Thai technical analyst.
#How to use #
The basic method for using Ichimoku+CDC ActionZone is to follow the green/red color and the cloud.
Buy condition
-Buy when the bar closes in green and closes above the cloud
Sell condition
-sell when the bar closes in red.
