B LAODA trend analysis 6.2Thank for JayRogers
1 hardly any repaint ,suggest 2 hour frame for bitcoin or use hekin ashi K line with 90 minute frame, suggest 1 Day or more for stock exchange
Kriptopara

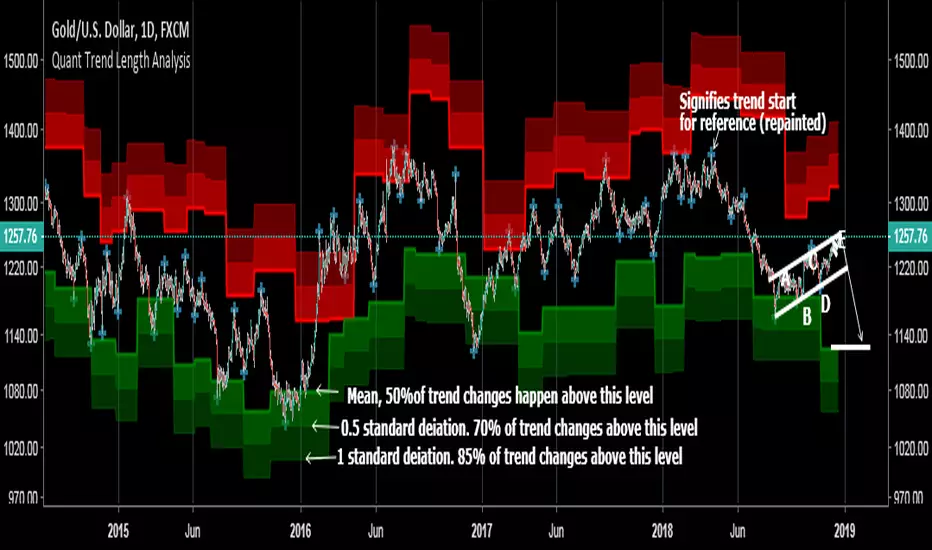
Statistical Trend Length Analysis (Quant indicator)This is the only Quantitative type indicator I can find on TradingView (which means it uses automated back testing to determine probability in a mathematical way), although there could be some I just haven't seen them.
This indicator back-tests ALL of the data, calculates the length of all past trends, and does a statistical analysis of trend changes at different levels. The more recent data is more accurate as it learns as the indicator goes along.
These levels can be used in regression to the mean trading, as it gives you an idea of the statistical likeliness of a trend change or pullback occurring in each zone. An average trend length is a very good point to enter when trading a pullback within a trend, although without a complex analysis like this it would be impossible to determine where that is.
PM me for access, and more details on strategies that can be implemented using this indicator.
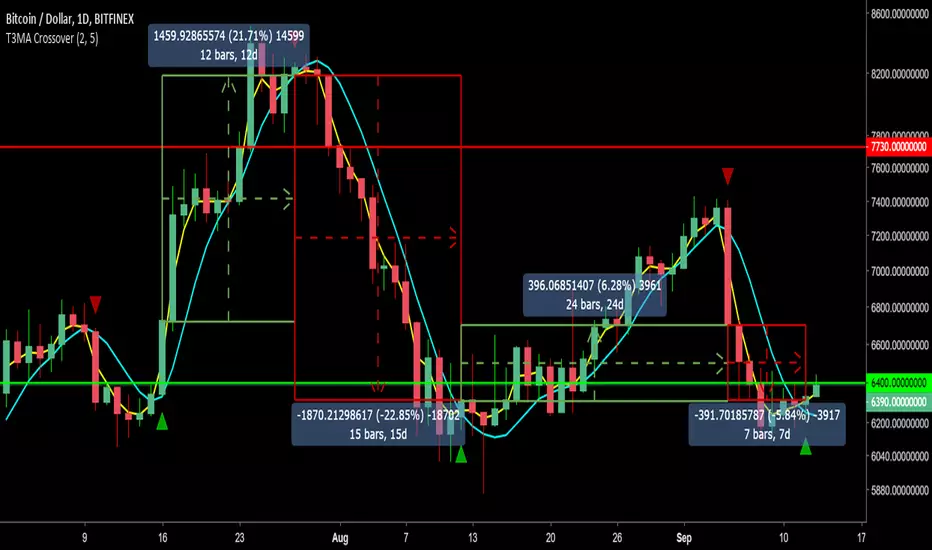
T3MA Crossover Strategy w/ Alerts v2.0Summary:
Using the T3MA formula developed by Tim Tillson, this differs from traditional SMA and EMA by providing a smoother curve and less lag. The smoothness is derived from the weighted sum of a single EMA through EMA 6 times.
How it works:
- Like any other crossover strategy.
- When fast MA crosses OVER the slow MA, go long.
- Close long and/or go short when the fast MA crosses UNDER the slow MA.
- Can keep flipping between long and short signals.
Quite a conservative strategy as it uses lagging indicators, not for intraday trading (you can, but I don't). Comes into it's own in trending markets as long as you stick to the signals.
Alert messages:
- Long
- Short
How I use it:
- My defaults are set at 2 fast MA and 5 slow MA to ride trends as close as possible.
- On BTCUSD and other altUSD pairs, I tend to use a daily time frame.
- On altBTC pairs, I tend to use a 12H time frame.
- Action on candle close at momentum confirmation (have seen numerous examples of a signal reversing mid candle into a dump).
Will need to be able to short altcoins to make the most of it, or it will at least keep you out of sustained downtrends (=/= holding).
Backtest it on bitcoin and other large cap alts on high time frames to see for yourself. For lazy trading, can set up alerts with AutoView.
0.1ETH for lifetime access. Message for details and support.
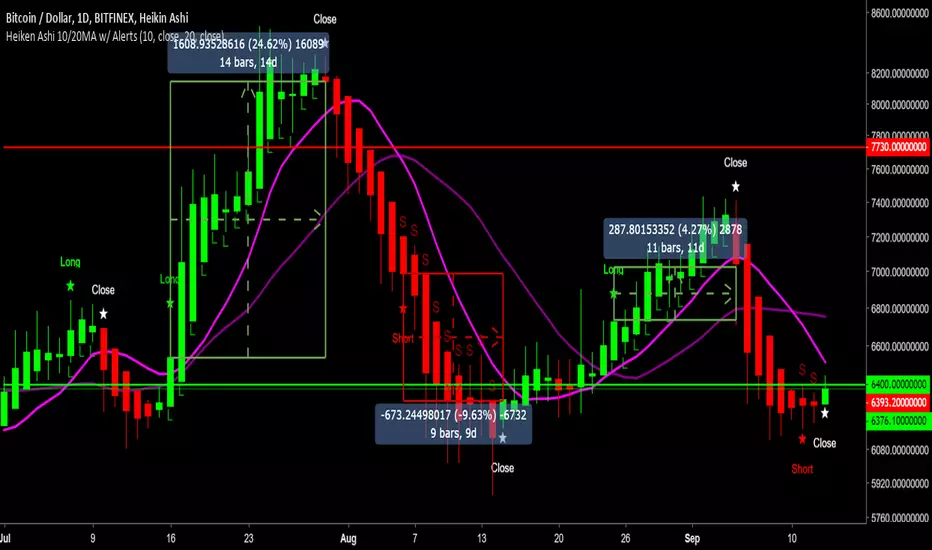
Heiken Ashi 10/20MA w/ Alerts v2.0Summary:
Using Heiken Ashi candles and default 10 and 20 Moving Averages for crossover signals to determine signals to go long, short and close trades.
How it works:
- Is the 10MA above the 20MA and a bullish candle? If yes, open a long.
- Will close the trade at the first bearish candle.
- Reverse this for going short.
- If you can't short, just close your long and hold till the next long signal.
Quite a conservative strategy, not for day trading. Comes into it's own in trending markets as long as you stick to the signals.
Alert messages:
- Long
- Short
- Close
Backtesting results:
XBTUSD = 85.9% (Bitmex)
LTCUSD = 75.6% (Bitfinex)
ETHUSD = 73.8% (Bitfinex)
NEOBTC = 83.9% (Binance)
TRXBTC = 79.4% (Binance)
EOSBTC = 88.1% (Binance)
Will need to be able to short altcoins to make the most of it, or at least will at least keep you out of sustained downtrends (=/= holding).
Backtest it on bitcoin and other large cap alts on high time frames to see for yourself. For lazy trading, can set up alerts with AutoView.
0.1ETH for lifetime access. Message for details and support.
Check out my other scripts.
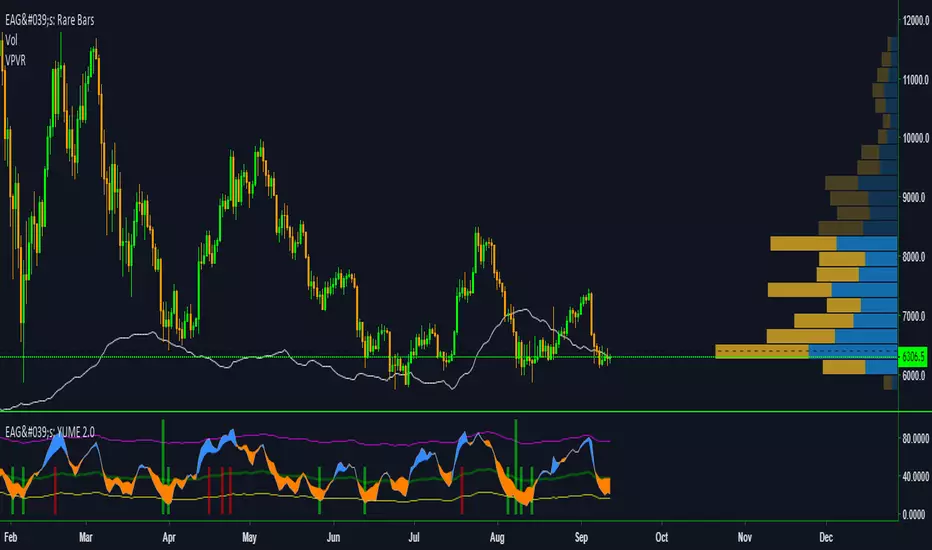
EdgeAnalysisGroup: Yume Wave 2.0This is a upgraded version of the wave with modified parameters for a higher success rate. 3 New Lengths and 75 more lines of code added to the overall algorithm. Also included are 2 sublevel signals based on the Fib MA and pattern trading.
The Wave:
+ The Yume is the Fast length
+ The Akume is the Slow length
+ The Miaku is a median weighted length
+ The Upper Limit is an overbought asset indication
+ The Lower Limit is an oversold asset indication
+ The Wave is the spread between Yume and Miaku
Bullish Indications:
+ The Yume is above the Akume
+ The Yume is above the Miaku
+ The Yume is below the Lower Limit
Bearish Indications:
+ The Yume is below the Akume
+ The Yume is below the Miaku
+ The Yume is above the Upper Limit
Signal Strength Weights:
+ 50 = Yume Wave crossed a Limit Line
+ 100 = Yume Wave crossed a Limit Line + Close to a Fib Moving Average
+ 100 = Edge's Market Bottom/Top Algorithm is marked 'True'
Setting up Signals (Based on a 100 Signal Height):
+ Set the "Bull Signal" to be at 50 or 100
+ Set the "Bear Signal" to be at 50 or 100
+ 50 is Agressive, 100 is Conservative.
+ Bull/Bear are separate so you can play conservative bull with aggressive bear.

DPD INDICATOR (DEMA PRICE DİFFERENCE PERCENTAGE )I use DEMA and Price difference in many strategies and and trade.
Finally , ı wanted to build an indicator for relation between them.
It calculates the percentage of difference between price and dema and estimates deviation from the main trend.
Formula = (price-dema)/price*100
There is some parameters;
DEMA Length is length of dema , ı think 50 is good enough,
there is upper and lower band for DPD Score .
You can change it based on volatilities of your pairs to find an optima.
and use it to be sure about your entry point.
I will developed and combine DPD with some other indicators and build strategies with it.
You can be part of that , I am waiting for your feedback.
Stay in Touch :)

Buy/Sell Points by CoinsolosWTCROSS indikatörü temel alınarak oluşturulmuştur. Aynı zamanda iyi sinyal vermek için RSI değerlerini de takip eder ve WTCROSS indikatörü kadar çok sinyal üretmez.
İlgilendiğiniz coin ve periyot için indikatörün eski verdiği sinyalleri inceleyin ve alış/satış sinyallerine alarm kurun. Alarm kurarken "Mum kapanışında bir defa (Once Per Bar Close)" ayarını kullanın.
Alış sinyali geldiğinde doğrudan market fiyatından almak yerine en son yeşil mumun açılış (OPEN) fiyatına Limit Order girin ve bekleyin. Ani hareketlerde kayıp yaşamamak için mutlaka stop-loss kullanın.
Bazen sat sinyali verdikten sonra fiyat tekrar yukarı hareket edebilir ancak satmak için bunu beklemek yerine doğrudan satış yapmanızı tavsiye ederim. Eğer fiyat hızlı şekilde düşerse satmak için fırsatınız olmayabilir.
4 saatten aşağı periyotlarda kullanılmasını önermiyorum.
It is based on wtcross indicator. Also follows RSI value to give good signals. It doesn't produce signals as much as wtcross indicator does.
Do your back test for the coin and the period you interested and set alarm for buy and sell signals with "Once Per Bar Close" setting.
Don't buy market price on buy signal. Put your buy order on the open price of the latest green candle and wait. Always use stop-loss to protect your buy funds.
Sometimes prices goes up after sell signal but to be sure sell on sell signal because it can go down rapidly.
It is not suggested to use period less than 4 hour.

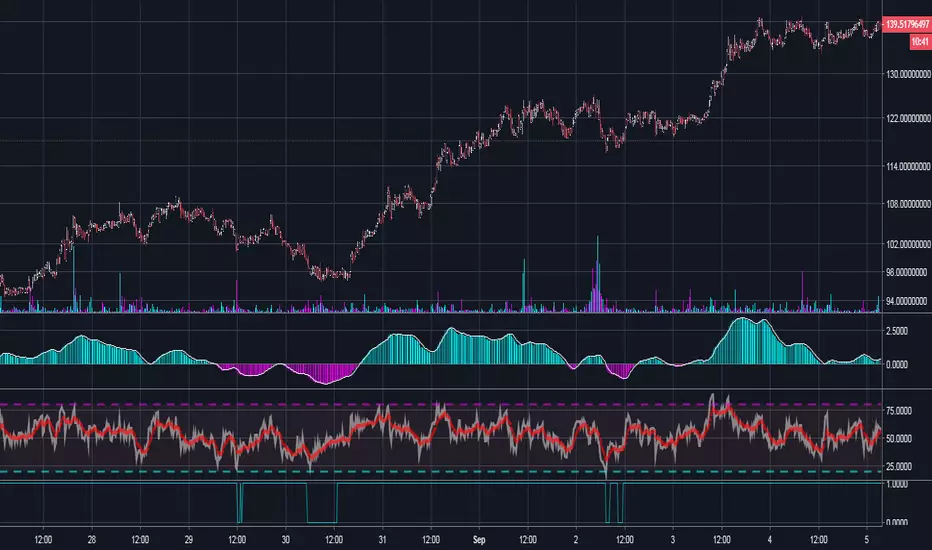
BB Squeeze Momentum Indicator [PPS]Buy when the oscillator is lime color and the background is green.

percentage distanceI do not know good english for explanation sorry.
Percentage distance of price to 21ma. Percentage distance of 21ma to 55ma
if such a thing is needed, it's here

QTi65Find low risk entry points with the QTi65 momentum Indicator formula.
How to used it :
1. Setting your chart for Swing Trading using momentum and breakout idea.
- Use it on 5M and 15M Charts
- You will need a good MACD indicator -> QLEMAC MACD (Already have the perfect setting!)
- You will need a Wilder's RSI indicator -> We already program one for you in our script.
- Volume indicator
QTi65 FORMULAFind low risk entry points with this momentum Indicator formula.
Swing Trading using momentum and breakout idea.


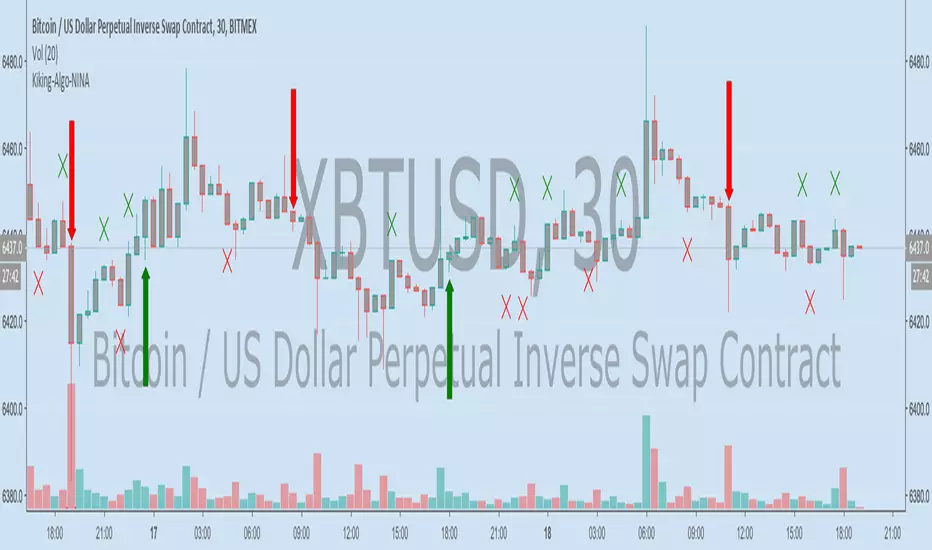
NINAHello Fellow Traders !
KikingAlgo has produced an amazing indicator which is now fully operational and ready for trading.
This indicator is called NINA and is based on Volume, Volatility, Momentum and Price to create spectacular signals based on the current market conditions.
The Indicator can operate on any market, any pair in any timeframe.
Feel free to PM me for details.
Regards
KikingAlgo
RELEASE THE BEAST! Tortuga V4 FULL RELEASE!GOOD EVENING FELLOW TRADERS!
The Tortuga V.4 indicator is now fully finalized and ready for trading. This indicator utilizes a combination of momentum, volume, volatility, and price action to create top tier condition signals for both long and short positions. In the Tortuga V.4 indicator, I have updated lines of code to: make long signals more common, make long signals more precise, make short signals more precise, and make short signals more common.
If you are interested in the Tortuga V.4 indicator, shoot me a PM.
As always, trade happy!
James

WMHA IndicatorFinalized name of my new indicator - WMHA - is now for sale for $40, on a monthly subscription basis. A free 15 day trial is offered for this indicator as well. This indicator can be used on timeframes above 5 minutes and below 4 hours. On a two week mock portfolio run, the indicator was 76% successful when placing a 0.69% stop-loss. That is right, a stop loss less than 1%. The two week mock portfolio yielded 75% profit compared to your initial trading stack value, and a 15% yield of profit for overall equity. This was using no leverage. With such a successful test run, utilizing such a low stop-loss, one could use 3x-10x leverage when using this indicator to make their profits grow exponentially and successfully. More videos of the WMHA Indicator will be posted shortly, if you have any interest in subscribing to my indicator, shoot me a PM.
As always, trade on.
James

Squeeze indicator V1This is the fifth indicator I am releasing. Will update description, releasing currently for subscribers. If you have any questions about subscribing to any of my indicators, send me a Direct Message.

Crypto Reversal Scalper STARTER KIT AlertsThis is alerts for automated trading for:
This is a starter kit for people to try out.
Since many people were confused to how to properly config the original script, I decided to create this script.
This script uses the original script but is compiled to have presets.
Simple to use, EASY AS 1,2,3
1. Choose PAIR
2. Sync chart with chosen pair (Symbol and Timeframe)
3. DONE!
4. (Optional) Adjust Stoploss and Takeprofit
This will be FREE for people to consider giving it a try.
To automate the trades, you will need to have the alerts for the script.
If you want to automate the trades, PM me.

[FREE INDICATOR] Cyatophilum Relative Strength Index DIVERGENCESAn advanced RSI indicator to help you spot divergences with the price action.
Everyone can use the indicator.
Leave a like if you find it helpful !

Bitcoin Trend AnalysisThis is the most accurate signal script for Bitcoin you will find for free.
(This script uses ATR to create buy and sell signals and has been shown to be quite accurate.)

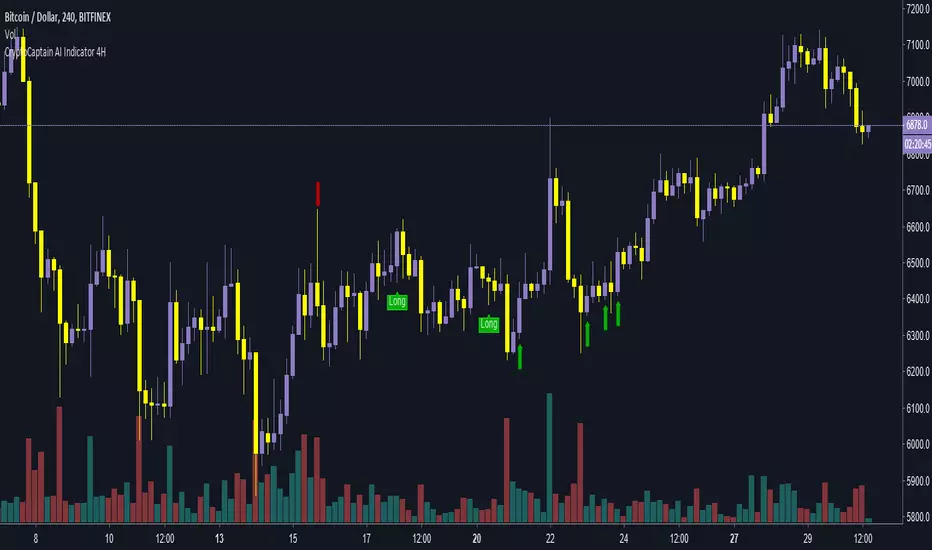
CryptoCaptain AI Swing Indicator 4H
This indicator is private and not for public use.
If someone wants to try and check it out then I can give a temporary access for a few hours.
No, It does not repaint.
It is deadly accurate .
Specially designed for swing trading for BTC/USD Bitfinex.
Works perfectly with 4H Time frame.
It has 2 types of indications
1. Strong buy/sell long/short signal which is labeled.
2. Weak buy/sell signal which is shown by an arrow.
It took me 6 months to make it.
Powered by some cool logics of EMAs and Confluence of more than 7-8 indicators.
Not your old school RSI_MacD indicator. Its latest, complex to make and easy to use B)
It reacts to price action.
Never miss the bus again.
Time for some money minting.
Happy trading :)
Looking for a scalper which is as accurate as this indicator?
check this out :