Kriptopara

Mining Cash Flow LineTakes QUANDL Bitcoin blockchain difficulty data, three variables (hashrate in THs/sec, power consumption in kWh, and electricity costs in cents/kWh) and calculates the base line for cash flow in US dollars. The default is an AntMiner S15 at 10 cents/kWh.
When price is above this line, miners with the given conditions have positive cash flow (i.e. they make more money mining than their running costs), and when below the line, they would be better off turning their rigs off (if this simple model can be applied to their particular circumstance).
Assumptions:
1. All costs are consolidated into one "electricity cost" variable, including things like rent and wages for mining farms.
2. 12.5 BTC/block emission schedule (update source code upon next halving).
Warnings:
It is likely that actual costs to miners varies in complex ways. This indicator only shows a cash flow calculation for a very simple set of parameters that will generally apply to miners, but not necessarily all of them. (For example, a miner may be locked into a prepaid contract for cheap electricity, or sell exhaust heat in the winter for extra revenue.)
Positive cash flow is also different from ROI, as this model does not take into account the cost of acquiring an ASIC mining rig.

Bitmex Alanovski_SuperStrategyBitmex Alanovski_SuperStrategy
Try it at different timeframes.
Contact me via Telegram @Alanovski for more info.

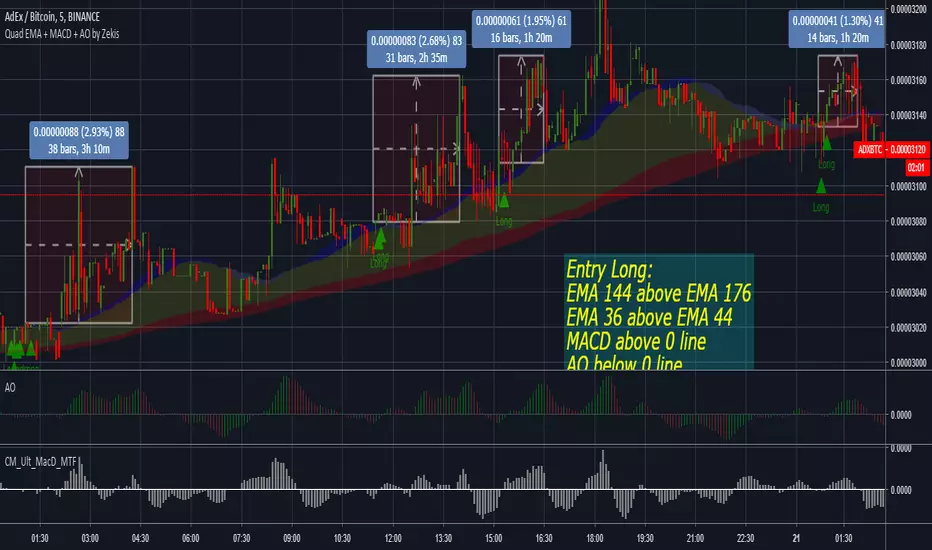
Quadruple EMA + MACD + Awesome Oscillator by ZekisThis strategy is based on quadruple EMAs, MACD and Awesome Oscillator, developed by Nenad Kerkez and simplified by me.
Scalping strategy (lower time frames)
Entry Position
Before we take a buy trade the two above criteria must be met. The 144 EMA must be above the 176 EMA and the 36 EMA must be above the 44 EMA. We then wait for AO to fall below the 0. The final „trigger‟ to the entry is when the MACD closes above the 0 line.
Sell trade is vice versa. 36 EMA must be below 44 EMA and 144 EMA must be below 176 EMA.
TAKE PROFIT and STOP LOSS
10-40 pips. Pivot Point targets.
STOP LOSS above/below last highest high
Enjoy!
@Zekis
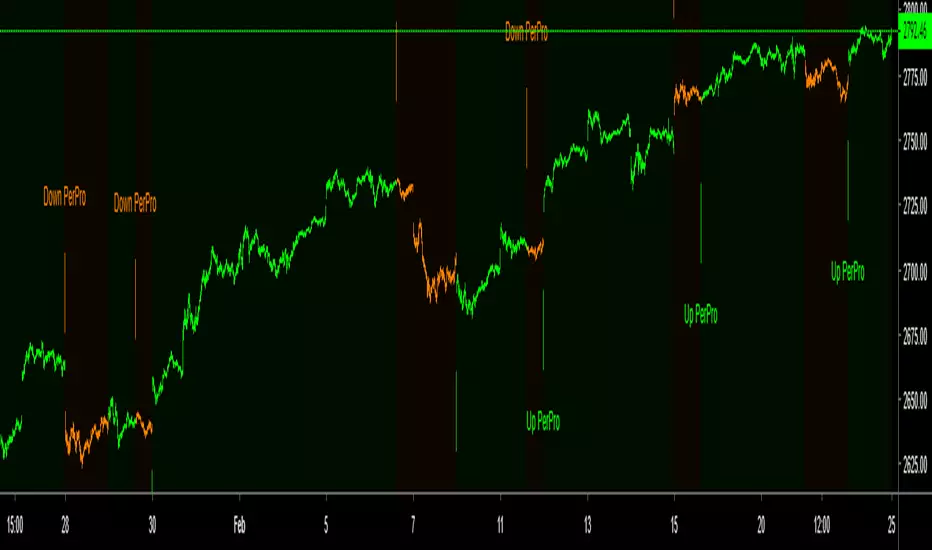
PerPro IndicatorThis is the version PerPro Strategy but in indicator, in this version you can configuration 1 minutes or 5 minutes time with 60 multi time frame set...
Try with your self what is the best configuration for you trading.
PpSignal Super Trend Smooth Trend Trader StrategySuper trend scalp system, buy when the bar is green and sell when the candle is red.
you can use in all time frame

Average True Range (ATR %) Stop Loss CalculatorThis indicator takes the average of a series of ATR to calculate what I would consider an optimum stop loss placement represented in percentage (read below for full overview).
While the data is plotted what is most helpful are the actual numbers presented and for my charts I remove most of the plotting.
This indicator is most helpful on the daily timeframe but can be used for all timeframes such as the 4HR, 1HR or even 15M.
This indicator should not be used alone. It should be used in conjunction with proper price action analysis. It’s also a great indicator if you chart using Value Channels. Ideally you want your stop placement to be below at least one core Value Channel boundary range. In addition to standard support and resistance and some key moving averages the market respects. This also works best when trading with the prevailing BIAS of the instrument (bull or bear).
Cryptos: Generally, that means you’re buying on retracements that fit the end of a structured move. The other option is using this in a clear up trending market where the pull backs are clearly being supported with buying.
FOREX: I built another indicator for FOREX search: ATRPIPS with SL
WTI: Helpful but I have different rules for when I trade WTI. I rely upon VCs and diagnal VCs much more when trading this.
Equities: Helpful but with the increase of volatility as well as uncertainty of Bias of the market-- this should be used as more of a guide than
What is most important is the actual percentage numbers but I've found graphing 1-3 of the actual ATRs is helpful. The rest just uncheck the checkbox in the options.
Indicator Overview:
Value 1 - 3 Period ATR (maroon)
Value 2 - 7 Period ATR (green)
Value 3 - 30 Period ATR (blue)
Value 4 - 90 Period ATR (blue, bold)
Value 5 - 1 Period ATR (green)
Value 6 - 1 Period ATR (red)
Value 6 – Prime Stop Loss Placement (maroon). This is the average of all above ATRs multiplied by 1.5
Value 7 - Move Left (red). Experimental value. This is the difference between (prime stop loss) and 1 day period move. Two ways to use this value. Use as a tighter stop loss placement. The other option is to use as a retrace target for purchase and using the Prime Stop Placement value as you’re stop loss.
All ATRs use the LOW price of the period. After testing both the low and close I’ve settled on the low to capture the most volatility you will typically experience.
Once again, this indicator should be used in conjunction with your proven trade system.
Also, by knowing what the values are within the indicator you could just eye ball what would be the best stop placement depending on the ATR or 1 or 2 ATRs you find most represent the volatility of what you are trading.
I will be expanding on this indicator by bringing in average measured moves as well as volume analysis and most likely with color changes and modifications.
Background:
While using and refining my trade system I've noticed that most moves happen in 3 periods. So we start there. The 7 period is good for a 24 hour market such as crypto (although weekend trading can be a hit or miss) and to some extent FOREX. The longer periods of 30 & 90 are to smooth out the data set. The final value of the 1 period is to bring a little more recency to the calculation.
Why multiply the average by 1.5? I've found in my own trading and system I built to be the best placement (in conjunction with VCs) to ensure you're stop isn't to close and is within the instrument you are trading volatility .
I'm looking at making this more intelligent as well as take into account volume and structured moves.

Current volatilityHello everyone.
Today an other small indicator that show the current volatility .
It works on all tickers ( crypto-currencies / others ) .
Method :
- ((high-low) * 100) / open
Hope it will be useful for you :)

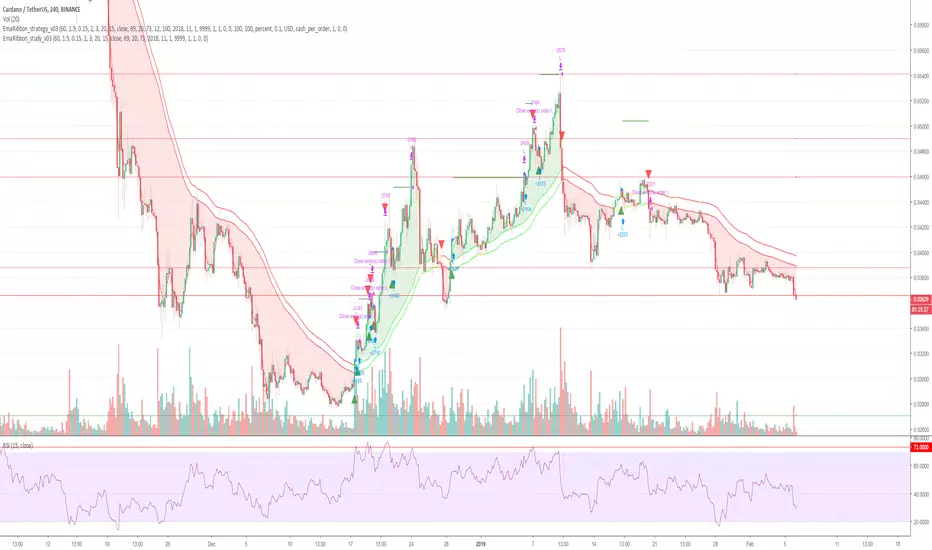
Cryptocurrency trend following EMA Ribbon LONG only studyThis strategy is based on EMA Ribbon and uses multiple indicators to find optimal time to enter/exit the trade and filter out false signals. The script with default setting is developed mainly for trading altcoins/stable coin pair such as ADA(USDT etc on 4h timeframe but it can be applied to any pair/any timeframe with some settings adjustments.
For plot on chart features make sure that you have both study and strategy scripts on chart with same settings.
Strategy settings description:
1. Signal EMA Length - Value for exponencial moving average (slowest from EMA Ribbon)
1a. Buy price toleration (%) - Price deviation for filtering bounces of EMA - price must close defined percents above EMA to open long trade
1b. Sell price toleration (%) - Price deviation for filtering bounces of EMA - price must close defined percents bellow EMA to close long trade
1c. EMA deelay - EMA id delayed by defined bars for smoothening
2. Filter by Fast EMA - Strategy filters signals to prevent buy while coin is dropping
2a. Fast EMA Length - Value for fast exponencial moving average
3. Filter by SMA - Strategy filters signals to confirm trend change
3a. SMA Length - Value for simple moving average
4. Filter by RSI - Strategy filters signals to prevent buing/selling overbought/oversold coins
4a. RSI Length - Length of RSI identificator
4b. RSI Source candle - What price of candle is used for RSI calculation (open, close, high, low)
4c. RSI Long condition - When buy, RSI indicator must be below this value to prevent of buying already overbought coin
4d. RSI Short condition - When sell, RSI indicator must be above this value to prevent of selling already oversold coin
5. RSI Close Trade Condition - Strategy sell coin once RSI reach defined value
5a. RSI close trade condition - Sell once RSI indicator acquires defined value
6. Close trade by Take Profit or Stop Loss Condition (STRATEGY ONLY) - Strategy sell coin once defined take profit / stoploss level is reached
6a. Take Profit (%) - Take profit value in percent
6b. Stop Loss (%) - Stop loss value in percent
6c. Plot targets on chart - defined targets will be plotted as lines on chart
7. Date range from
7a From Year - To run strategy in interval
7b From Month - To run strategy in interval
7c From Day - To run strategy in interval
8. Date range to
8a To Year - To run strategy in interval
8b To Month - To run strategy in interval
8c To Day - To run strategy in interval
9. Wait to confirm the signal
9a Wait candless to buy - strategy will wait defined candless to confirm the signal before buy
9b Wait candless to sell - strategy will wait defined candless to confirm the signal before sell
10. Plotting on chart (STUDY ONLY)
10a Plot signal line channel with bows on chart
10b Plot simple moving average on chart
10c Plot EMA Ribbon on chart
10d Plot recent support and resistance levels on chart
11. Show Every signal (STUDY ONLY) - Unchecked shows only first signal based on strategy. But if you use take profit/stoploss settings within your bot, you might want to rebuy on next signal. Checked shows signal on each candle.
Throw on chart also buld-in RSI indicator and set the same as strategy
Notice that there might be false signals, especially when the coin is not trending or is strongly manipulated. Overall strategy is profitable though. You just take some minor loses and wont miss the big move.
You may also consider to compare buy&hold return vs profit from trading this strategy. In downtrend as we have seen recently, profit may not be as high as you expect but it is still much better than just hold and hope.
You can use the strategy script for fine tunning settings and find best settings for yourself.
Study script helps you to automate trading with use of alerts perharps with 3commas bot or even trade manually based on email/sms notification setted by tradingview
Notice that study script does not handle takeprofit/stoploss order. That is why sell arrows could be plotted by study script later than strategy script. To rebuy after takeprofit/stop-loss use "11. Show Every signal (STUDY ONLY)" setting
Make sure that you keep same settings for strategy and study scripts.
If you need any help with settings do not hesitate to ask. I would also appriciate any feedback and ideas how to improve this script.
Here is backtest result from 1. Nov 2018 using constant 100USD Buy ammount:
Trend Direction v1 - by @cryptomrdavis -This little script helps you to get the right trend. It use two RSI - 1. current chart 2. total market cap.
Simple to use:
Blue line cross the orange line = bullish
Orange line cross the blue line = bearish
You can trade it that way or you wait for the bullish cross and sell it, when the line cross under 70 (or higher, depends on which levels you set).
Combine it with the Crypto Trading Helper to find better long or short positions.
This script doesn't plot any lines or buy signals.
Happy trading!
Regards,
CryptoMrDavis
*** use this tool on your own risk ***
--------------------------------------------------------------------------------------------------------
BTC: 1AxLVKpgYjMtQtcRmeuFbhQNVKWKmJ5EZy
ETH: 0x7b825fa752b9926D3E8397cDb1d9E5473D074646
XLM GAXUQJSW55C7MAC4GI26NZUGIKSHFDVFRFKZCXPLMPY4HCADSDT55XK6
BCH: qz57n04ud6mn42u00aymqkku8tfh0lk4jv9c28mjvv
--------------------------------------------------------------------------------------------------------

[astropark] Long-Short Strategy V2Buy/Long at next candle's open price when you see a green "B" label on the screen, considering green cloud as support for more buys/longs
Sell/short at next candle's open price when you see a red "S" label on the screen, considering red cloud as resistance for more shorts
If you appreciate my script, offer me a coffee, a beer, a pizza :)
BTC jar: 1K5kuYQPEqoNo6GRmJbHWMPmqwKM5S3oRR
ETH jar: 0x091b541a6dd6fe08c4e7bd909baafb2fce9b975e
LTC jar: LSVoAChsZrVsvbNyUfdpxtFpDAUSaUTUig
XRP jar: (XRP deposit tag) 103997763 (XRP deposit address) rEb8TK3gBgk5auZkwc6sHnwrGVJH8DuaLh
PS: Do you need a customization or do you need a dev who implements your strategy? send me a private message ;-)

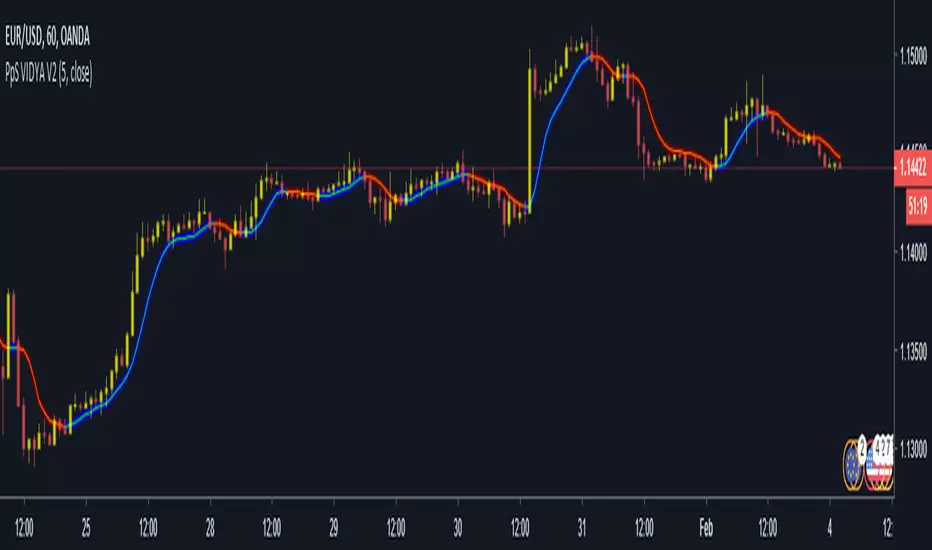
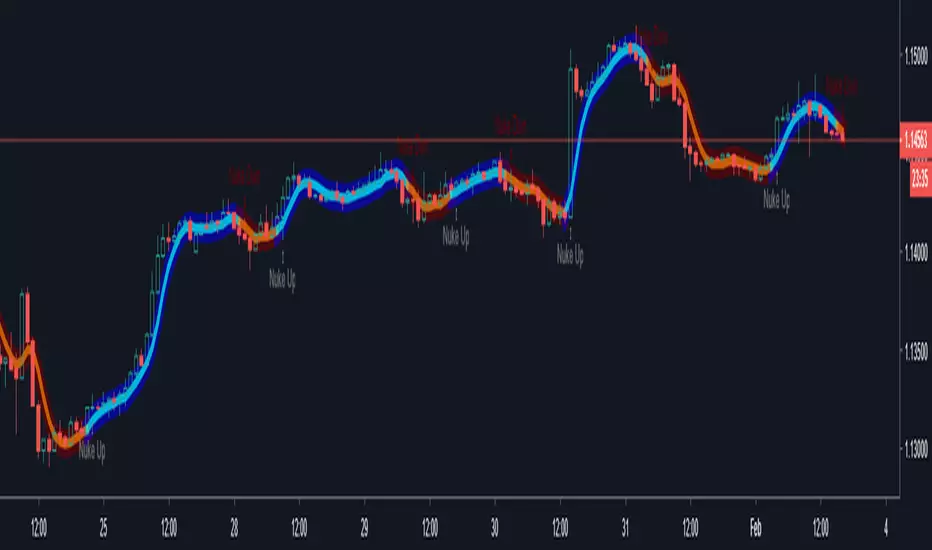
PpSignal Variable Index Dynamic Average V2The Moving Average is, perhaps, the most popular indicator in trading for a reason. Comparatively, the crossing average can tell you plenty about a trend, i.e. whether it’s broken or unbroken, changing or holding. But the Moving Average isn’t perfect; there is one area where it falls short and that is volatility. Even an Exponential Moving Average, which places more emphasis on the latest data, can miss the mark when it comes to a sudden change in volatility, rising or falling. Consequently, it can either give a fake signal or else generate a signal only when it is too late to trade on. Volatility is where the Variable Index Dynamic Average comes in, or VIDYA for short.
The Variable Index Dynamic Average or VIDYA was developed by Tushar Chande, and its focus is precisely on volatility. In other words, the VIDYA is an average that adjusts itself to changing volatility. When volatility is high, the VIDYA becomes more sensitive and when volatility is low, the VIDYA becomes less sensitive. That allows you to assess the trend according to current market conditions (and not irrelevant conditions that had earlier prevailed).
The VIDYA in Essence
The math behind the VIDYA formula is quite complicated, but the logic is not.
The VIDYA essentially has two components, the first being the Exponential Moving Average (aka EMA). The second indicator is in the “oscillator family” and it is known as the Chande Momentum Oscillator (aka CMO). Like most oscillators, the Chande Momentum Oscillator generates a signal of -100 and 100, with -100 being oversold and 100 overbought. The EMA is the anchor index, and the CMO’s job is to adjust the exponential average to volatility. The closer the CMO is to 100 or -100 the higher the volatility and the more sensitive our exponential average will turn. Conversely, the closer the CMO is to 0 the less sensitive our exponential average will turn. The final reading after the volatility adjustment is the VIDYA.
As you can see below, once you add the Variable Index Dynamic Average in MetaTrader you get a window with two parameters from which to choose: One is the Period CMO and the other is Period EMA. We can then decide which period the CMO will run on (and thus affect the sensitivity of our EMA) and which period the EMA will run on (to capture our trend). Usually, the best CMO to plug in is a third of the value of the EMA duration; this is to allow the latest change in volatility to impact to the greatest degree. If the CMO period is too long, it will likewise spread over the period too long and consequently fail to reflect current levels of volatility, thus defeating the VIDYA’s purpose.
VIDYA
Comparing the VIDA to the EMA
When we compare the two, we can see the clear advantages the VIDYA(Red) has over the EMA(Green). Both the VIDYA and the EMA run on a 30-week period, but the VIDYA is smoothed out by the Chande Momentum Oscillator running on a 10-week period (again, a third of the whole period). The VIDYA simply captures the trend much more accurately. We can see how, in Point A, when momentum weakens, the Variable Index Dynamic Average starts to flatten, while the EMA just moves across the price and fails to adjust.
This quality is especially beneficial when we want to get an indication if a trend has broken or not. The EMA, in this case, suggests the trend has, indeed, broken but when we look at the VIDYA we quickly get a more accurate picture. We can see that the downtrend has not been broken which allows us to prepare for another bearish round rather than mistakenly expect a rebound.
VIDYA
Of course, for every upside there is a downside and the downside of the VIDYA is that it becomes less effective on a very high duration, such as above 90. The Chande Momentum Oscillator cannot reflect sentiment very well when the duration ןד high and therefore it stops being effective at balancing the Exponential Moving Average within the Variable Index Dynamic Average. One way to tackle or mitigate this is to go higher in the intervals whenever possible, such as from days to weeks or weeks to months. Nonetheless, you should be cognizant of this in inherent weakness in the Variable Index Dynamic Average. Yet, despite that, the Variable Index Dynamic Average does a very effective job. If you are trading under volatile conditions and want to figure out if a trend is broken or set to continue, the Variable Index Dynamic Average could be the solution. When combined with other indicators of momentum, the VIDYA can give you the bigger, clearer picture.
www.onestepremoved.com
Crypto Trading Helper - by @cryptomrdavisI was looking for a strategy on TradingView that can send me signals when i have to buy or sell.
The most strategys/indicators that i found where only paid once, so i decided to create my own.
Now, a few weeks later i can share it with you and this one is completely FREE.
Features:
Buy / sell signals
Take profit - default 5%, 10% & 15%
Fibonacci included
Set alerts (buy/sell, tp1, tp2 & tp3)
more to come
For now i recommend to use it on higher timeframes.
Happy trading!
Regards,
CryptoMrDavis
*** use this tool on your own risk ***
--------------------------------------------------------------------------------------------------------
BTC: 1AxLVKpgYjMtQtcRmeuFbhQNVKWKmJ5EZy
ETH: 0x7b825fa752b9926D3E8397cDb1d9E5473D074646
XLM GAXUQJSW55C7MAC4GI26NZUGIKSHFDVFRFKZCXPLMPY4HCADSDT55XK6
BCH: qz57n04ud6mn42u00aymqkku8tfh0lk4jv9c28mjvv
--------------------------------------------------------------------------------------------------------

Coinmarketcap - Live CryptoMarketCap TOP 20Hello everyone,
I hope you are fine.
Today an other important indicator : the TOP 20 crypto market cap !
It's better if you use it on BTC/USD to have more historical data.
Next cryptocurrencies have been used for this indicator :
BTC
ETH
XRP
EOS
BCH
LTC
USDT
TRX
XLM
BSV
ADA
BNB
XMR
IOTA
DASH
NEO
ETC
XEM
USDC
ZEC
Thank you and have a good day :)


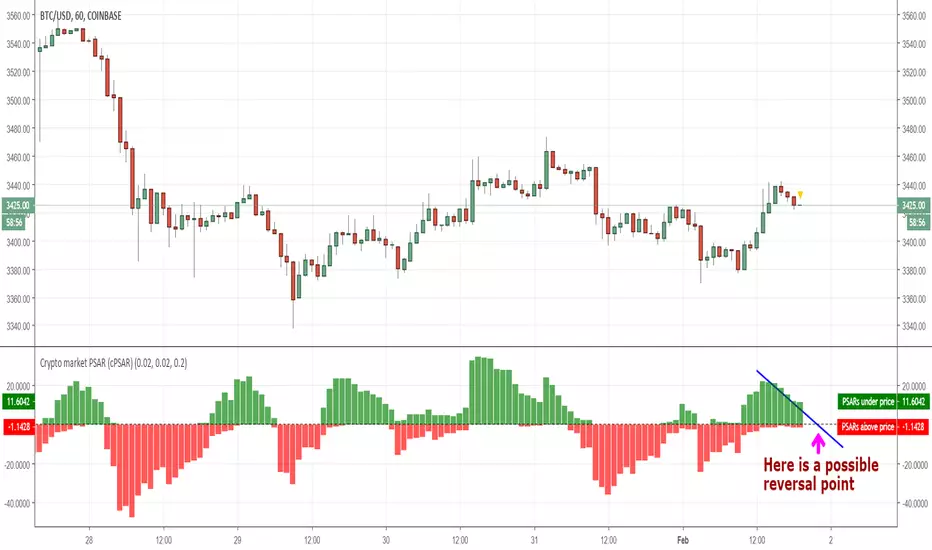
Crypto market PSAR (cPSAR)This indicator calculates the PSARs of the most liquid cryptocurrencies (as percent differences from the prices) and sums them together.
The PSARs under the closes, which act as support, are summed separately and shown in green. The PSARs over the closes (acting as resistance) are summed separately and shown in red.
The result is an indicator which can be interpreted somewhat like the RSI (but keep in mind that PSAR is a lagging indicator unlike the RSI which is a leading indicator). By interpreting this correctly you can - SOMETIMES - predict the short-term turns of the entire crypto market.
Many traders use the prices shown by PSAR (Parabolic Stop And Reverse) to set stop loss prices and/or to take profit and reverse their positions. This is why, on reversal of the PSARs (= when one of the red or green values becomes visibly larger than the other), a strong turning of the market can, sometimes, occur.

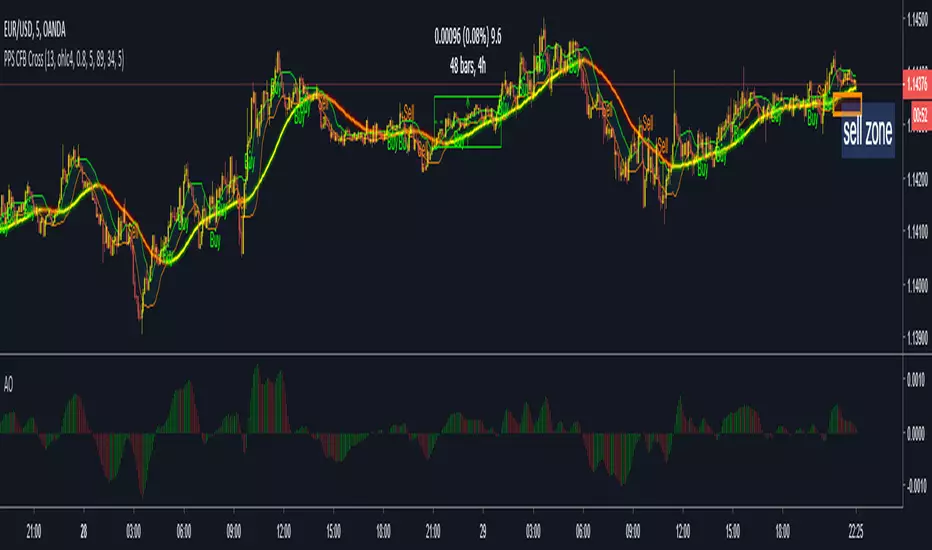
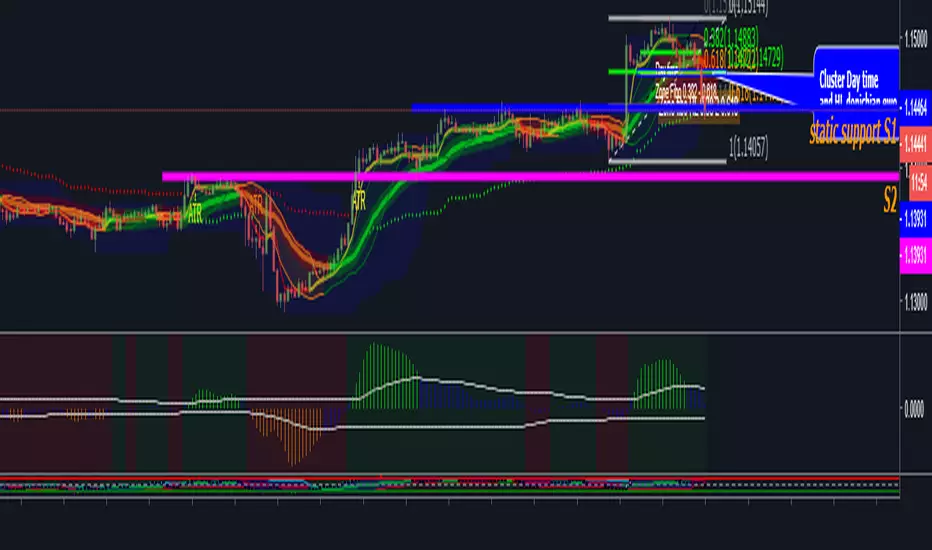
PpSignal Personal TemplateThis is my personal template strategy, I follow the tendency, with
-Donichian: I can se the high and low price.
-CFB: ha can see the trend short.
-Tigger MA: i can see the long trend.
-BB: I can see the short trend and the volatily.
-Ewo break band and Rsi Donicihan channel, the trend and oversold and overbought.
-PPSignal Scalper Double Cross Signal and EWO Smooth V4.0 for the background trend.
PpSignal Candle converter and psignal golden fibo zone.
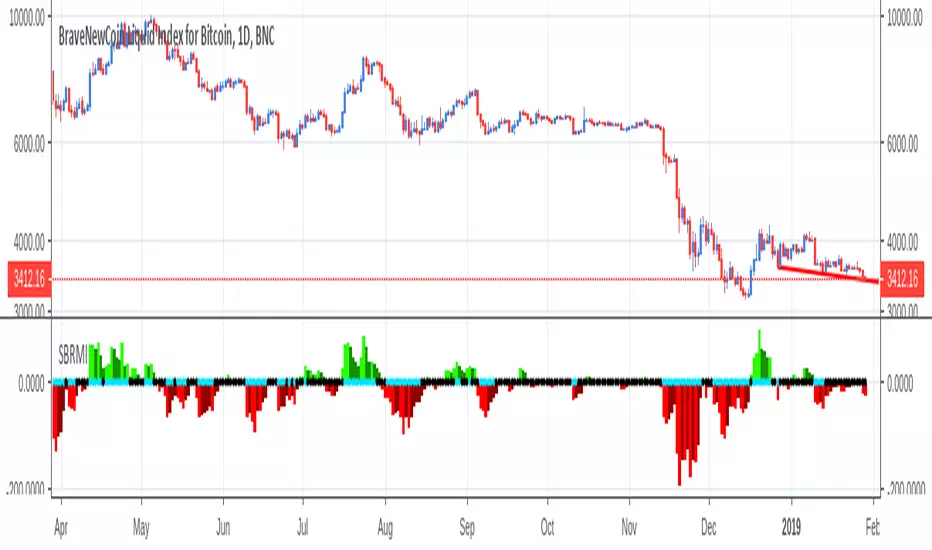
Saracino Bitcoin Relative Momentum IndexThis is a technical indicator developed by Andrea Saracino. It gives buy and sell signals and works best on the daily charts.
This indicator is better suited for Bitcoin. In fact, throughout the history, it gave very consistent buy and sell signals on this asset. Could also be used in other cryptocurrencies.
It consists of two components: the histogram and the dots.
HISTOGRAM
The histogram shows the actual momentum of a given price trend and can be used to check if the trend is strong or if it's getting weaker overtime. When the momentum is to the upside it is green, while it is red if the momentum is to the downside.
DOTS
This is the actual signal part. It consists of a series of dots that become blue if there is a clear signal in either way.
For example: if the momentum is going up and the dots become blue it is a buy signal, or a sell signal if momentum goes down.
DISCLAIMER
This is NOT the Saint Grail indicator. You must not open any trade using just this indicator. Create a strategy instead.

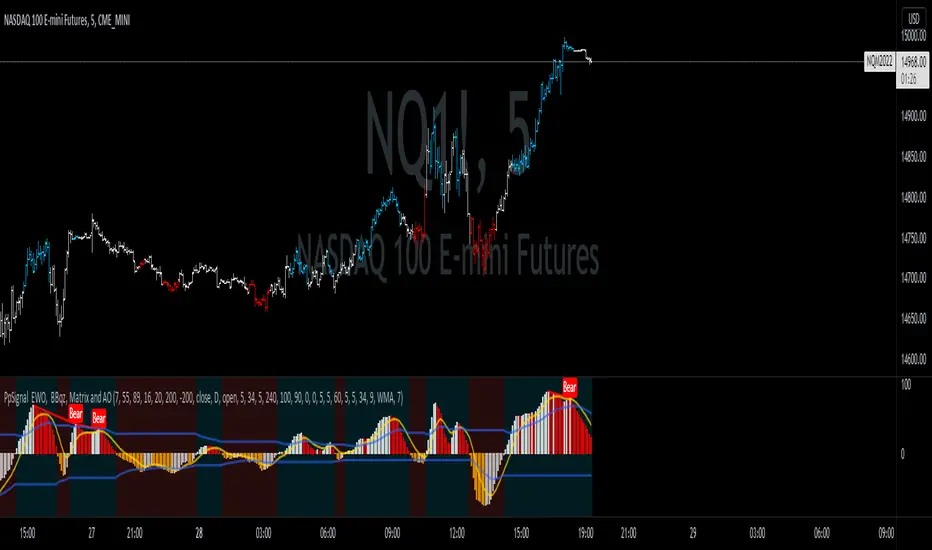
PpSignal Donchian Channels CFB and BB StrategyHere we are combine cfb with bollinger band and donichian midle line channel estrategy
This technique is for those who want the most simple method that is very effective. The best trade are during the busiest trading hours, 3am to 12am EST NY time. This method does not work in sideways markets, only in volatile trending markets.
Time Frames: 1, 5, 10, 15, 30 min.
Currency pairs: majors and btc
Essential chart indicator
-Ppsignal EWO BB, ( )
Other Chart indicators:
- Awesome Oscillator. ( )
- Optionally Add Squeeze Indicator ( )
- Bollinguer band period 13 desviation 1.
BUY SIGNAL
-Ewo above 0
-CFB crosses the middle donichian channel.
-CFB crosses ariiba from the upper band of bollinguer band.
SELL SIGNAL
- Ewo below 0
- CFB crosses below the middle channel
- CFB crosses below the signal bb.
Wath is CFB?