Bitcoin Stock To Flow Rainbow IndicatorHello everyone,
I have finished to create the Bitcoin stock to flow indicator, rainbow version.
It's a Bitcoin price prediction model.
What is Stock To Flow ?
Stock is the size of the existing stockpiles or reserves and flow is the yearly production.
The formula is : Stock divided by flow ( Stock_to_flow = STOCK / FLOW )
The supply of bitcoins is fixed in the source code.
What we know :
Blocks are created every 10 minutes ( average )
In 2009, 50 Bitcoins was created every 10 minutes , so 300 Bitcoins per hour, 7200 per day, 2628000 per year
The Halving happened each 210000 blocks , the average time between halving is around 1300-1400 days.
The mathematical formula that I used for the rainbow line is : exp(-1,84) * (Stock_to_flow ^ 3,36)
And the mathematical formula that I used for the " top price line " is : 1.2 * (Stock_to_flow ^ 3)
The rainbow line IS the prediction model .
We can observe that :
The price follow the rainbow line
After each halving, the price grow and touch few month after the rainbow line
When the price is between the rainbow line and the " top price line ", habitually, it's followed by a drop of the price below the rainbow line.
Special thanks to PlanB.
Kriptopara

PpSIgnal Double Murrey's Math StrategyMurrey Math es un conjunto complejo de niveles de soporte y resistencia que actúan más o menos de la misma manera que los puntos de pivote, pero también proporcionan algunas ideas sobre si la tendencia actual debe continuar o revertirse. El concepto matemático de Murrey fue desarrollado por T. Henning Murrey en 1995 y se describió con gran detalle en su libro "El sistema de comercio matemático de Murrey para todos los mercados negociados".
compre cuando ambos sociladores este verdes y venda cuando ambos esten en rojo
Murrey Math is a complex set of support and resistance levels that act more or less the same as pivot points but also they provide some insights on whether the current trend should continue or it should reverse. The Murrey math concept has been developed by T. Henning Murrey in 1995 and has been described in great detail in his book “The Murrey Math Trading System For All Traded Markets.”
buy when both murray oscillators are green and sell when they are red

TS - Multiple Timeframe RSI ScreenerWhat is it?
Simple signal and alert based indicator that lets the user use 1-4 different period RSI indicators overlayed on top of eachother.
- Up to 4 RSI indicators overlayed at once
- All time periods use within the indicator are customisable to fit the traders needs
- Buy & Sell alerts built in
Access
This is one of our free indicators in our trading suite. Just PM me for access!

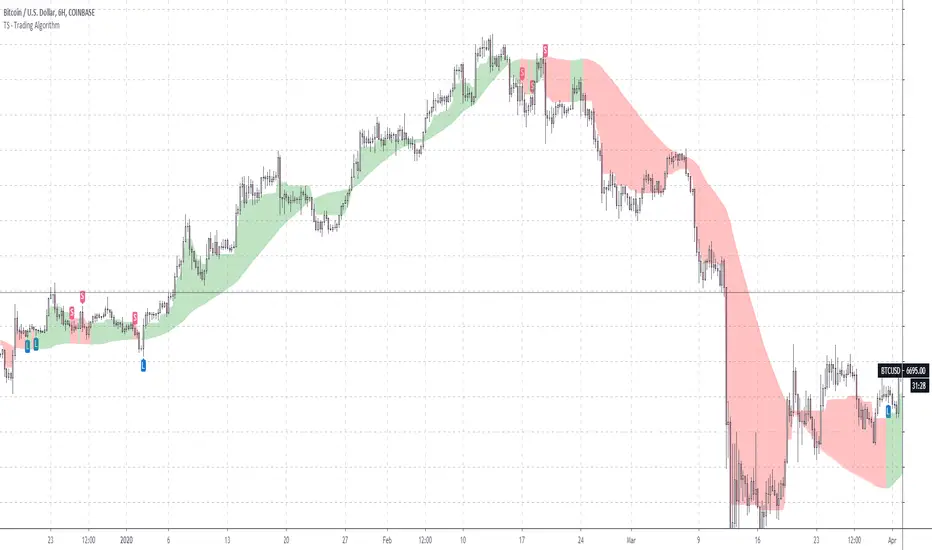
TS - Trading AlgorithmWhat is it?
The Tradespot MA Algo is an all in one, profitable moving average based trading strategy that presents long and short opportunities.
This indicator does not repaint. Once a bar has closed, the signal will remain permanently printed onto the chart.
What can I do with it?
Use on the following markets:
COINBASE:BTCUSD
COINBASE:ETHUSD
COINBASE:ETHBTC
Timeframe: 1D
What does each signal mean?
Long label is a strong buy signal
Short label is a strong sell signal
X's indicate a warning telling you that you should possibly exit your position. You should review these signals alongside other indicators such as volatility.
Review X signals?
Yes, there are concrete buys and sells but the X's indicate possible exits that might also be fakeouts, we can created the perfect indicator set up to review these with our TS - Trend Confirmation indicator and our TS - Volatility Screener indicator
How do I get access?
Please contact me on TradingView for details.
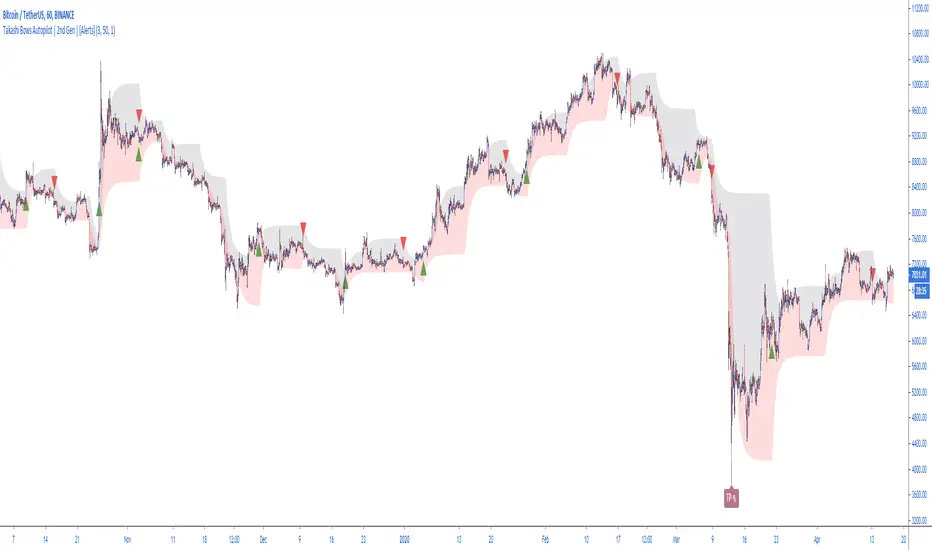
Takashi Bows Autopilot | 2nd Gen | [Alerts]Our state-of-the-art trend confirmation indicator is now combined with automatic threshold selection.
Takashi Bows Autopilot is the ultimate trading tool. Effortless, its signals put traders inside strong trends, locking big profits that cover all loss generated during sideways trends.
An upgrade version of Takashi Bows v1, this script is the result of some operations developed by us, it can easily adapt to different markets and time frames. Now ranging from level 1 to 20, traders can select the amount of signals to be displayed on the chart. Based on price movement, it signals entries after strong movement up or down.
Take Profit included. If a position is opened in one direction, it should be closed at take profit levels or when a position in the opposite direction is opened.
Inputs
Level
Integer input. Sets a level for signals generated up and down. The higher the level, more signals on chart, and vice-versa.
Take Profit %
Float input. Sets a percent of take profit for exiting previous open position.
Rule
Float input. Sets a ruler for more accuracy on less volatile markets. Standard value 1 for high volatile markets, higher values for low volatile markets.
See Bows
Bool input. If true, Bows lines can be seen on chart.
To get access to this and other scripts check links below.
Takashi Trend | 2nd Gen |Discover trends instantly thanks to our new indicator.
A popular trading expression says: "the trend is your friend until it ends." This indicator makes it easier for any trader to see the market's major trend and trade accordingly.
Calculations are based on Average True Range.
This indicator does not provide signals or alerts. It is best used as a confirmation tool.
To get access to this and other scripts check links below.

Takashi Triangular Arbitrage | 2nd Gen | [Alerts]Spot discrepancies between three currencies: these opportunities are rare and usually benefit to traders using advanced programs. You can now set up alerts and discover those for yourself.
This indicator signals opportunities for executing triangular arbitrage. Triangular arbitrage is the result of a discrepancy between three different currencies that occurs when the currency's exchange rates do not exactly match up. These opportunities are more frequent at cryptocurrency markets. The trader would exchange an amount at one rate (Currency_B/Currency_A), convert it again (Currency_C/Currency_B) and then convert it finally back to the original (Currency_C/Currency_A), and assuming low transaction costs, net a profit.
Example:
As per standard inputs, the trader would use US dollars to buy BTC (BITFINEX:BTCUSD), use BTC to buy NEO (BITFINEX:NEOBTC), use NEO to buy US dollars back (BITFINEX:NEOUSD). Whenever the quantity of US dollars bought back is higher than 1% from the initial amount, the indicator will send an alert signaling an arbitrage possibility.
Disclaimer: triangular arbitrage requires advanced automation tools and is only possible if there is enough liquidity to quickly execute all 3 trades at prices used on the indicator.
Inputs
Symbol 1
Symbol input. First step currency to initiate triangular arbitrage. (Currency_B/Currency_A)
Symbol 2
Symbol input. Second step currency to continue triangular arbitrage. (Currency_C/Currency_B)
Symbol 3
Symbol input. Final step currency to finalize triangular arbitrage. (Currency_C/Currency_A)
Discrepancy %
Float input. Amount in percent of profit return after triangular arbitrage is finished. Transaction fees not included.
To get access to this and other scripts check links below.

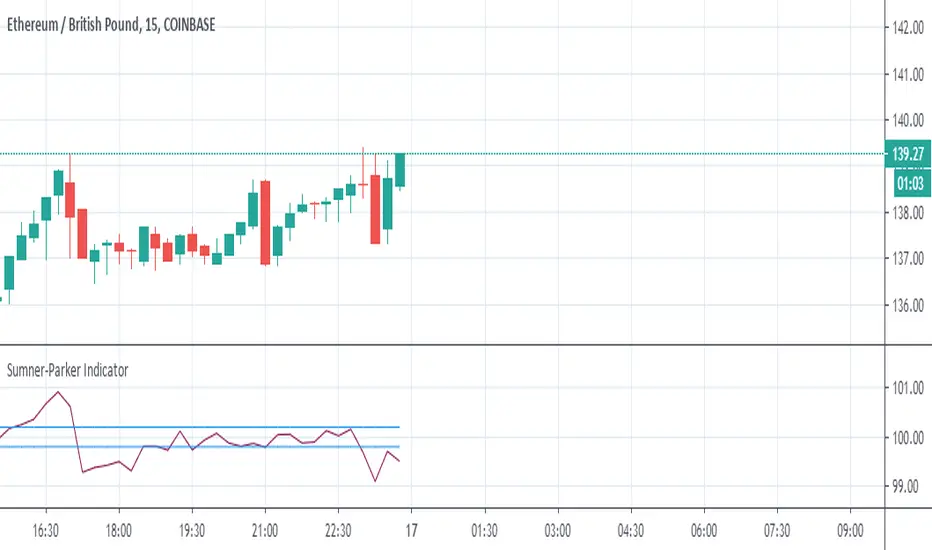
Sumner-Parker Indicator (Over/Under Priced BTC or ETH)This is to be used when trading between ETH/GBP, BTC/GBP and ETH/BTC .
It compares ETH/GBP and BTC/GBP with each other to determine if the ETH/BTC price matches.
From it you can predetermine whether the value of the asset you are watching is overpriced or underpriced and therefore predict the candle to follow.
When watching ETH:
If the value is high, the value of BTC is too high and ETH should raise to match in the next bar and vice versa.
When watching BTC:
If the value is high, the value of BTC is too high and should drop on the next bar and vice versa.
The Upper and Lowers are set at double the percentage fees on the exchange you use. This just helps in recognising beneficial trades.
PpSignal CFB Version 2 Composite Fractal Behavior
Este indicador fue diseñado para filtrar acciones de precios menores para una visión más clara de las tendencias.
Inspirado en el filtro de volatilidad de QQE, este filtro aplica el proceso directamente al precio en lugar de a un RSI suavizado.
Range Filter y las bandas ahora se calculan en una función singular.
Ahora hay dos métodos de cálculo diferentes para el filtro. Seleccione el tipo que desea usar a través de la entrada "Tipo de filtro". Tipo 1 es la fórmula original.
Múltiples métodos de tamaño de rango ahora están disponibles. Puede elegir entre las siguientes escalas:
- Puntos
- Pips (Funciona mejor con pares de divisas, obviamente)
- ticks
-% del precio
- ATR
- Cambio promedio (predeterminado. Este es el método de dimensionamiento original).
- Desviación Estándar
- Absoluto (valor numérico absoluto)
- El suavizado con eldher de rango ahora es opcional, y puede especificar su longitud de suavizado. El suavizado solo afecta a las escalas dinámicas (ATR, cambio promedio y desviación estándar).
- El movimiento del filtro ahora se puede determinar usando mechas o precio de cierre. Esto se puede especificar a través de la entrada .
Bollinger Band RSI Wilder
Las bandas de volatilidad se calcularon teniendo como base el rsi wilder.
Básicamente uno estaria comparado con tendencia y volatilidad
Compre cuando el el CFB da señal de Compra color verde y las bandas de volatilidad se pongan de color azul...venda cuando cfb se pone rojo y las bandas de volatilidad se ponen celestes.
This indicator was designed to filter out lower price actions for a clearer view of trends. Inspired by QQE's volatility filter, this filter applies the process directly to price rather than a smoothed RSI. Range Filter and bands are now calculated in a singular function. There are now two different calculation methods for the filter. Select the type you want to use through the "Filter type" entry. Type 1 is the original formula. Multiple range size methods are now available.
You can choose between the following scales:
- Points
- Pips (Works best with currency pairs, obviously)
- Ticks -% of the price - ATR - Average change (default. This is the original sizing method). - Standard Deviation
- Absolute (absolute numerical value)
- Smoothing with the range elder is now optional, and you can specify its smoothing length.
Smoothing only affects dynamic scales (ATR, average change, and standard deviation).
- Filter movement can now be determined using highlights or closing price. This can be specified through the input.
Bollinguer Bands
Volatility bands were calculated based on the rsi wilder. Basically one would be compared to trend and volatility Buy when CFB gives
Buy signal green color and volatility bands turn blue ... sell when cfb turns red and volatility bands turn light blue.

Rogue Profit Alert IndicatorThis is a complex script developed to measure specific volatility parameters and enter trades based on predetermined rules which are proprietary and will not be released, so don't ask for specific indicator settings.
This indicator accompanies the "Rogue Profit Strategy" and can be used for creating alerts based on the strategy's performance. Please read the more in depth description on the "Rogue Profit Strategy" page. Make sure the input parameters are the same for both the Strategy and Indicator to insure accurate signals.
This is a very powerful and profitable script that will simplify your trading and has been in development and tested for three years. Message for details on how to obtain access. Please allow up to 24 hours for a response.

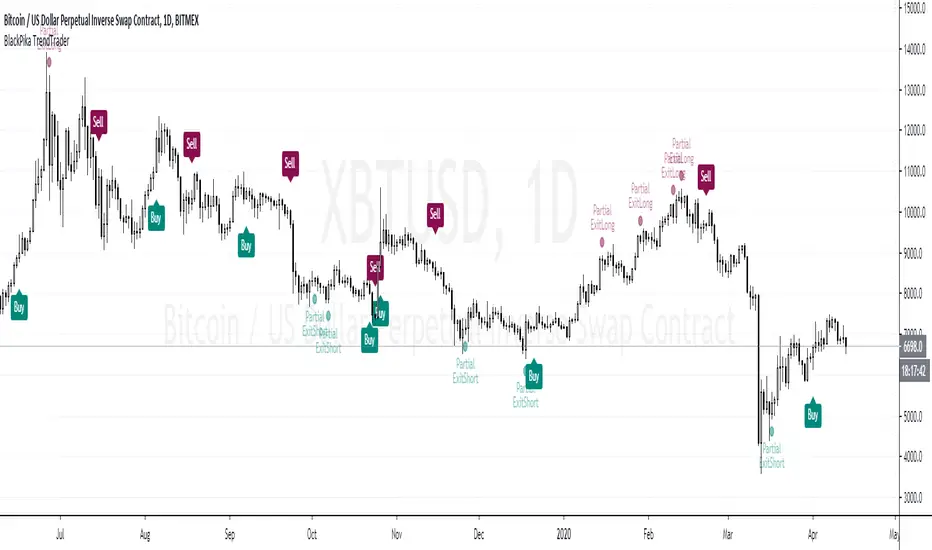
BlackPika TrendTraderIntroducing BlackPika TrendTrader (TT)
This indicator use moving averages and RSI (Default settings) for Entry Signals and Partial Exits.
It is recommended to use this for Spot market trading for swing trades, ideally on higher timeframes (4H to D)
It can be used to gauge the trend of underlying asset on Daily timeframe.
Trailing signals are also available such as Trailing take profits and Trailing stop losses.
There are two modes available for entry signals
- Normal mode (default)
- Sensitive mode (which can give better entries but also can lead to higher noise)
Hope you find this indicator useful.
Do comment if you have any questions.
Good luck in your trading.
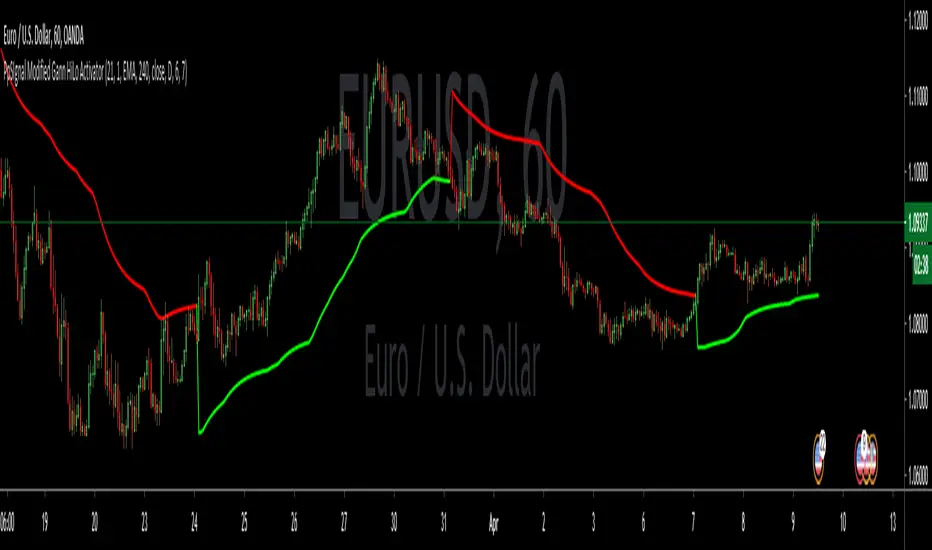
PpSIgnal Modified Gann HiLo ActivatorGann Hi Lo Activator Indicator fue desarrollado inicialmente por Robert Krausz.
El gann Hilo Original es simplemente un promedio móvil de los tres períodos anteriores, bajo o alto.
Yo lo he cambiado por precio de apertura y precio de cierre para evitar repintes .
Este indicador de seguimiento de tendencia, se utiliza para determinar la tendencia del mercado y también para identificar las señales de negociación.
Pero cuando el mercado está lateralizado, le resulta difícil generar señales comerciales precisas. Puede interpretar el indicador leyéndolo de la siguiente manera. En un mercado de tendencia alcista, el indicador pe [pintara de verde en tendecia bajista de rojo.
también le hemos agregado un media movil Tilson para hacer scaplin dentro de una tendencia definida.
Gann Hi Lo Activator Indicator was originally developed by Robert Krausz.
The Original Gann is simply a moving average of the previous three periods, low or high.
I have changed it for the opening price and the closing price to avoid repainting.
This trend monitoring indicator is used to determine the market trend and also to identify trading signals.
But when the market is lateralized, it is difficult for you to generate accurate trading signals. You can interpret the indicator by reading it as follows. In an uptrend market, the indicator pe [will paint green in a downtrend red.
We have also added a Tilson moving average to scaplin within a defined trend.
Price CorrelationsThis indicator shows price correlations of your current chart to various well-known indices.
Values above 0 mean a positive correlation, below 0 a negative correlation (not correlated).
It works well with daily candle charts and above, but you may also try it on 1h candles.
The default indices:
- Gold
- S&p 500
- Mini Dow Jones
- Dow Jones
- Russel 2000
- Nasdaq 100
- Crude Oil
- Nikkei 225 (Japan)
- FTSE 100 (UK)
- Silver
- DAX Futures (DE)
You can change the defaults to compare prices with other indices or stocks.

PpSignal Trazan MT4 System TARZAN -
indicator for MetaTrader 4 is now in tradingview version indicator and the essence of the Forex indicator is to transform the accumulated history data.
TARZAN - provides an opportunity to detect various peculiarities and patterns in price dynamics that are invisible to the naked eye. Based on this information, traders can further take on the price movement and adjust their strategy accordingly.
Buy when the rsi cross above move average (ma lime color).
Sell when the price cross below move average (red MA)
we ade additional tips like rsi in candle mode, oversold and overbought level.

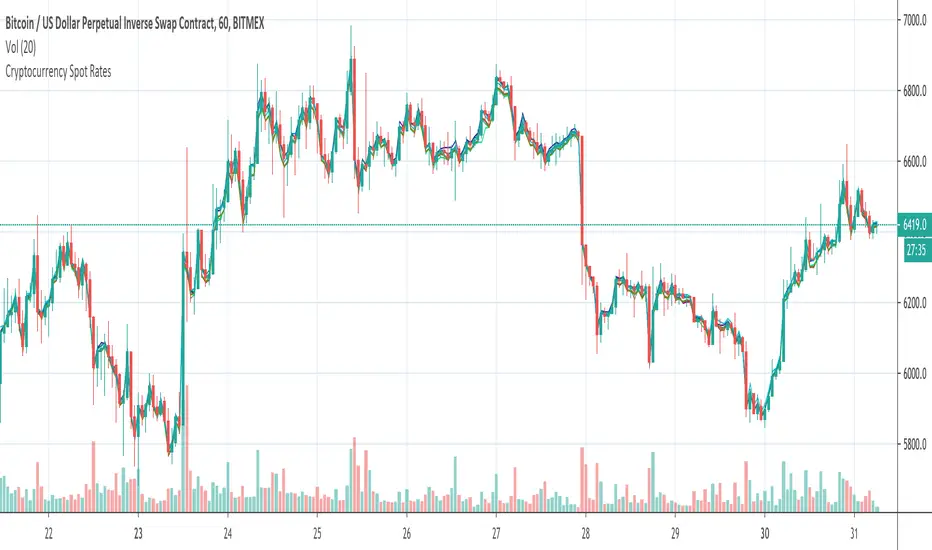
Cryptocurrency Spot RatesThis is an overlay indicator on the chart that will plot cryptocurrency spot prices of the following exchanges:
- Coinbase
- Poloniex
- OKCOIN
- Binance
- Huobi
- Bittrex
- HitBTC
- Kraken
- Bitfinex
Additionally it plots the price average of all those exchanges.
This overlay is intended to be used on charts with derivatives/futures such as BitMEX/Deribit/...
It works with all USD and Tether pairs on the main chart (for example BTCUSD, ETHUSD, BCHUSD,...)
USDT SupplyThis script shows the USDT (Tether) supply, total USDT market capitalization and USDT supply on various Cryptocurrency exchanges.
It is based on this script:
Changes:
- added HiTBTC and Huobi exchange
- updated to Pine Script v4
- improved default style and line width to highlight global USDT plots against exchange-specific plot lines

PpSignal drake delay oscillator GritasIt is a technique, when the drake oscillator moving averages (Drake Daly Statocastico) cross up you must buy and the histogram is painted in a green color .... when the drake oscillator crosses down and the histogram is painted red you must to sell.

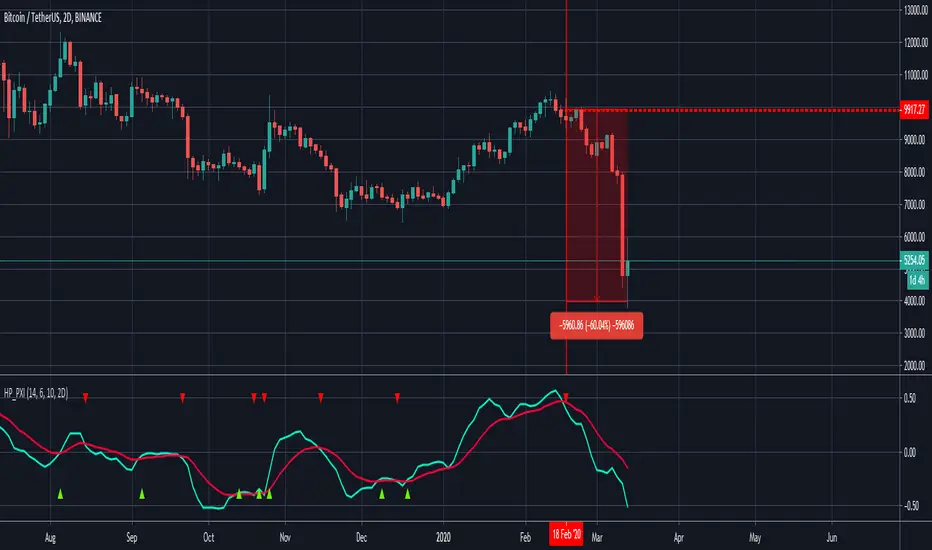
Plutus eXploration Index - PXIGreetings Fellow Traders!
We have developed this simple and easy to use indicator so that all users can benefit from it by:
• Reducing the amount of time spent trading.
• Minimizing the risk of loss.
• Accurate timing on entries and exits.
• Signals are accurate in volatile market conditions.
What is the PXI?
The Plutus eXploration Index falls under the centred momentum oscillator category which means that it fluctuates above and below a central point or line. Apex levels exist, where the indicator will reach a peak, and start moving in the opposite direction. Two lines move in unison and crossovers will signal a buy and a sell.
Setting up the indicator:
Once you have received your invite, the indicator will appear under your "my invite only" scripts in trading view detailed charts screen. Select PXI and add it to your chart. For free accounts on TradingView, the indicator limit is set to x3, so please de-activate something if you hit this limit.
You can access the PXI setting in the string of icons that follow after the indicators name in the top left corner of the indicator chart. In order:
Name | Visibility | Settings | Show source code | Delete | More
Under the settings, there are two tabs. One for the style, which you may freely change to suit your preferences. And then the first tab, for Inputs. The default settings for Long Minima, Short Maxima and Integrated EMA should not be changed.
The critical change to make in the input settings is the time frame !
The time frame on the price chart and the time frame on the indicator have to match! The range of allowable time frames is as follows:
15min | 30min | 1h | 4h | 12h | 1d | 2d | 1week
How to use the PXI:
The apex levels on the oscillator differ for each asset and vary depending on the selected time frame. The signals provided near apex points shall hold more weight. We recommend that traders assess these levels properly before considering a position.
Sell signal: Sell signals occur when the quick line (default blue) crosses over the slow line (default orange) from above.
A red arrow down will mark this point in time out on the chart.
Buy signal: Buy signals occur when the quick line (default blue) crosses the slow line (default orange) from bellow.
A green arrow down will mark this point in time out on the chart.
Maximizing Risk/Reward and profitability:
The indicator strives to keep positions open long enough to reap real rewards in the market. Maximum profit levels naturally occur around the apex points on the indicator chart, and the onus is on the trader to attempt an early exit once these levels are achieved.
Addition points to consider:
Most profitable trading signals occur on the daily time frames while considering the duration of trades and timing of the signals. For the lowest risk levels, weekly time frames are most suitable. From the weekly time frame down, the risk increases incrementally until you reach the 15min time frame. Signals at the lower levels occur more often and they are effective but, they should, however, be monitored closely. Also, the lower the time frame, the higher the chances of false-positive signals.
will not be liable for damages of any kind resulting from your use of or inability to use the indicator or content.
PpSignal volatility strength Indicator this bollinger band is calculated with rsi wilder ...
You can also see the smoothed ATR with the elder formula and a Tilson t3. All indicators have alarms. So you can see the right moment of entry.
When tilson is green, and atr is blue and the price crossed the upper band is a BUYsignal and and invese color (red) and the prece cross the down ban.
You also have the option of seeing the RSI Wilder as a line or as haiken ashimode.
keep in mind the trend and divergences of macd ewo or rsi to make your tickets more effective.

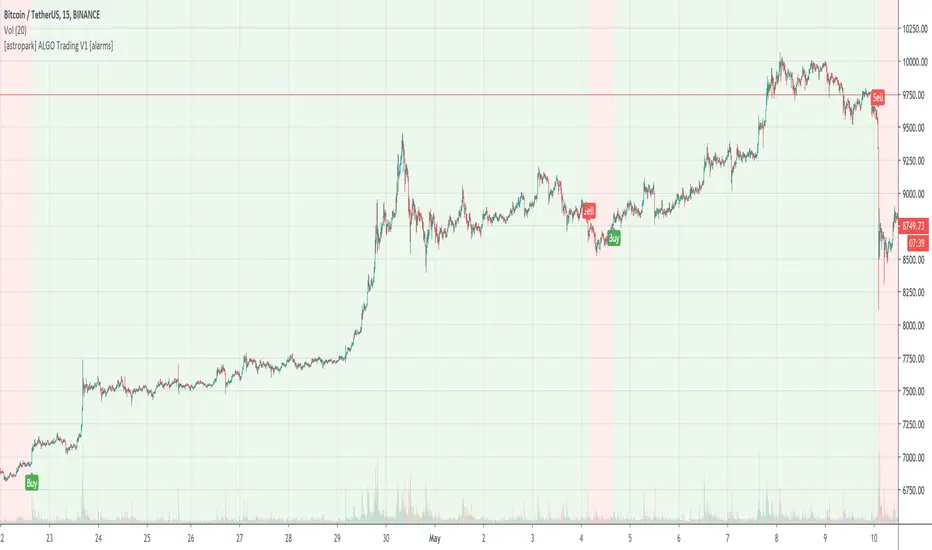
[astropark] ALGO Trading V3 [alarms]Dear Followers,
today another awesome Swing and Scalping Trading Strategy indicator, runnable on a bot , which works great on many timeframes (from 1h and above is suggested), just write me in order to help you find correct settings).
It must be said that this strategy works even better on 1m Renko chart!
If you are a scalper or you are a swing trader, you will love suggested entries for fast and long-lasting profit.
Keep in mind that a proper trailing stop strategy and risk management and money management strategies are very important (DM me if you need any clarification on these points).
This is not an evolution of "ALGO Trading V1" or "ALGO Trading V2" , but a twin sister of them.
For your reference, here it is the "ALGO Trading V1" indicator
and here the "ALGO Trading V2"
This strategy has the following options:
enable/disable signals on chart
enable/disable bars and background coloring based on trend
enable/disable a "filter noise" option , which try to reduce overtrading (you can easily check it on backtesting)
enable/disable a Take Profit / Stop Loss option (you can easily check it on backtesting too)
enable/disable a secret SmartOption which may improve profit on your chart (again, check it on you chart if it helps or not)
This strategy only trigger 1 buy or 1 sell. If you enable Take Profit / Stop Loss option, consider that many TP can be triggered before trend reversal, so take partial profit on every TP an eventually buy/sell back lower/higher to maximize your profit.
This script will let you set all notifications you may need in order to be alerted on each triggered signals.
The one for backtesting purpose can be found by searching for the astropark's "ALGO Trading V3" and then choosing the indicator with "strategy" suffix in the name, or you can find here below
Strategy results are calculated on the time window from 1995 to now, so on more than 15 years, using 1000$ as initial capital and working at 1x leverage (so no leverage at all! If you like to use leverage, be sure to use a safe option, like 3x or 5x at most in order to have liquidation price very far).
This is not the "Holy Grail", so use a proper risk management strategy.
This script will let you backtest how the indicator will perform on any chart and timeframe you may like to test and/or trade. Of course results will be very different depending on the chart and timeframe you will open. I tested a lot of charts and always you can find a combination that keep this strategy in profit on swing trading style (and this means that if you can have a daily look at the chart you can always manage to maximize your profit on each trade!)
This is a premium indicator , so send me a private message in order to get access to this script.

[astropark] ALGO Trading V2 [alarms]Dear Followers,
today another awesome Swing and Scalping Trading Strategy indicator, runnable on a bot , which works great on many timeframes (ones between 1h and 1D are suggested, but just write me in order to help you find correct settings).
It must be said that this strategy works even better on 1m Renko chart!
If you are a scalper or you are a swing trader, you will love suggested entries for fast and long-lasting profit.
Keep in mind that a proper trailing stop strategy and risk management and money management strategies are very important (DM me if you need any clarification on these points).
This is not an evolution of "ALGO Trading V1" or "ALGO Trading V3" , but a twin sister of them. Search them on TradingView to know them better.
Here you can find ALGO Trading V1
This strategy has the following options:
enable/disable signals on chart
enable/disable bars and background coloring based on trend
enable/disable a "filter noise" option , which try to reduce overtrading (you can easily check it on backtesting)
enable/disable a Take Profit / Stop Loss option (you can easily check it on backtesting too)
enable/disable a secret SmartOption which may improve profit on your chart (again, check it on you chart if it helps or not)
This strategy only trigger 1 buy or 1 sell. If you enable Take Profit / Stop Loss option, consider that many TP can be triggered before trend reversal, so take partial profit on every TP an eventually buy/sell back lower/higher to maximize your profit.
This script will let you set all notifications you may need in order to be alerted on each triggered signals.
The one for backtesting purpose can be found by searching for the astropark's "ALGO Trading V2" and then choosing the indicator with "strategy" suffix in the name, or you can find here below
Strategy results are calculated on the time window from January 2018 to now, so on more than 2 years, using 1000$ as initial capital and working at 1x leverage (so no leverage at all! If you like to use leverage, be sure to use a safe option, like 3x or 5x at most in order to have liquidation price very far).
This is not the "Holy Grail", so use a proper risk management strategy.
This is a premium indicator , so send me a private message in order to get access to this script.

[astropark] ALGO Trading V1 [alarms]Dear Followers,
today another awesome Swing and Scalping Trading Strategy indicator, runnable on a bot , which works great on Low Timeframes (1h is suggested) but also on even lower ones (till 15m) and on higher ones (no further than 1D), just write me in order to help you find correct settings).
It must be said that this strategy works even better on 1m Renko chart!
If you are a scalper or you are a swing trader, you will love suggested entries for fast and long-lasting profit.
Keep in mind that a proper trailing stop strategy and risk management and money management strategies are very important (DM me if you need any clarification on these points).
This is not an evolution of "ALGO Trading V2" or "ALGO Trading V3" , but a twin sister of them. Search them on TradingView to know them better.
This strategy has the following options:
enable/disable signals on chart
enable/disable bars and background coloring based on trend
enable/disable a "filter noise" option , which try to reduce overtrading (you can easily check it on backtesting)
enable/disable a Take Profit / Stop Loss option (you can easily check it on backtesting too)
enable/disable a secret SmartOption which may improve profit on your chart (again, check it on you chart if it helps or not)
This strategy only trigger 1 buy or 1 sell. If you enable Take Profit / Stop Loss option, consider that many TP can be triggered before trend reversal, so take partial profit on every TP an eventually buy/sell back lower/higher to maximize your profit.
This script will let you set all notifications you may need in order to be alerted on each triggered signals.
The one for backtesting purpose can be found by searching for the astropark's "ALGO Trading V1" and then choosing the indicator with "strategy" suffix in the name, or you can find here below
Strategy results are calculated on the time window from January 2019 to now, so on more than 1 year, using 1000$ as initial capital and working at 1x leverage (so no leverage at all! If you like to use leverage, be sure to use a safe option, like 3x or 5x at most in order to have liquidation price very far).
This is not the "Holy Grail", so use a proper risk management strategy.
This is a premium indicator , so send me a private message in order to get access to this script.
Lowkey System (Study)View strategy version
A long-only strategy that aim to detect the beginning of new bullish trends and their ends.
For entering a new position this script is waiting for a moving average crossover then wait for a volume increase relative to the current volatility.
For closing a position it's simply waiting for a crossunder of whether the MA or if enabled the stop loss.
This strategy is already configured to run on BTCUSD in a 4h timeframe but you can customize the moving average and the stop loss parameters to suit your needs.
I've worked a lot to write this script so I'm not giving it for free but you can try it for 10 days.
Contact me for more details.
Have fun!
PS: I'm french so please excuse me if I've made some grammar errors ;)
