Crypto Correlation Matrix Series [SHK]Hi everyone, Although everything's clear from the title but I should describe some basic points.
Currency Correlation is a statistical measure of how two securities move in relation to each other.
So this script is used to show if current pair (alt-coins) is moving in the same direction of bitcoin (or ethereum) or not. Consider that in crypto market most of alt-coins have correlation of +0.7 with bitcoin, So temporary changes in correlation may signal a reversal or sharp continuation for the alt-coin.
"1" : The alt coin is moving in same direction of Bitcoin (Or Ethereum).
"0" : The alt coin is moving in random direction compared to Bitcoin. (No movement relation)
"-1" : The alt coin is moving in opposite direction of Bitcoin.
Important Note: By default average of 15 bars back is measured to calculate the correlation by this script. Please test other periods and share the best options with us.
Comments are welcomed :)
Kriptopara

Bitfinex Longs/Shorts Ratio AlertableThis script contains Bitfinex longs/short ratio and generates alarms with a given input .default value is 60 which means alerts when either shorts/longs reach 60:40 ratio


CryptoManic: Long/Short Interest ChangeA simple script to determine the change in Long and short open interest (Bitfinex symbols). i.e. the change in open interest from the previous candle.
Usage: in settings. Go to inputs and in symbol enter your symbol. e.g.
BTCUSD
ETHUSD
ADABTC
BCHBTC
EOSBTC
XRPBTC
TRXBTC
LTCBTC
It plots overlapping area chart of change in open long contracts (in green) and open short contracts (in red)


Crypto / Fx SessionsTrading sessions for crypto markets - the major time segments: London, NYC, Beijing. Times are set in UTC.
Quick experiment for now, may be edited.
More granular data around session breaks for these time zones at www.altcointrading.net or as CSVs daily updated on Keybase keybase.pub

Multiple Trend Indicatorweekly 21wma,daily 21wma and more,within your current chart. and shows multiple trend. if u need something like this


Renko CandlesticksRenko charts are awesome . They reduce noise by only painting a brick on the chart when price moves by a specified amount up/down. When the price reverses, it must go twice the specified amount before a brick is painted. Time is not a factor, just price movement. Sometimes however, you want the pros of a renko chart, but on a regular candlestick chart. This indicator attempts to do just that.
A band is placed around price action showing the upper and lower bounds of what would be the current renko brick. The band only goes up/down when the price action itself moves up/down by the amount you specify. There are several ways of specifying the amount:
Fixed Price Amount: As the name says, you enter the brick size amount, i.e. the amount the price has to move before being in a new brick.
% of Price: This method will calculate the amount the price has to move as a percentage of the price itself. This way as price goes up/down, your brick size will adjust accordingly. Recommended values would be around 1% or less.
% of ATR: This option will make the brick size a percentage of the Average True Range. You can specify the ATR time frame to be different from your current time frame as well as the ATR length. For instance you could be on a 10 minute chart but specify the ATR to be daily with a length of 3 and a percentage amount of 15. This would make your brick size 15% of the Average True Range for the last 3 days. Recommended values are 10 to 20%.
Use this indicator on any time frame, even the 1 minute as the renko bands span the price action the same way on any time frame easily letting you know whether or not the price has moved appreciably, regardless of how much time has passed.
You can also set alerts easily, simply set the alert to crossing and choose “Renko Candlesticks” instead of “Value”. You will then see the options for the renko upper and lower bounds.
Tested on Bitcoin with the following values:
Fixed Price Amount: 30 ($30)
% of Price: 0.45 (if Bitcoin is $7000 then the brick size would be $31.50)
% of ATR: 15%, ATR Time Frame: 1D, ATR Length: 3 (3 days)

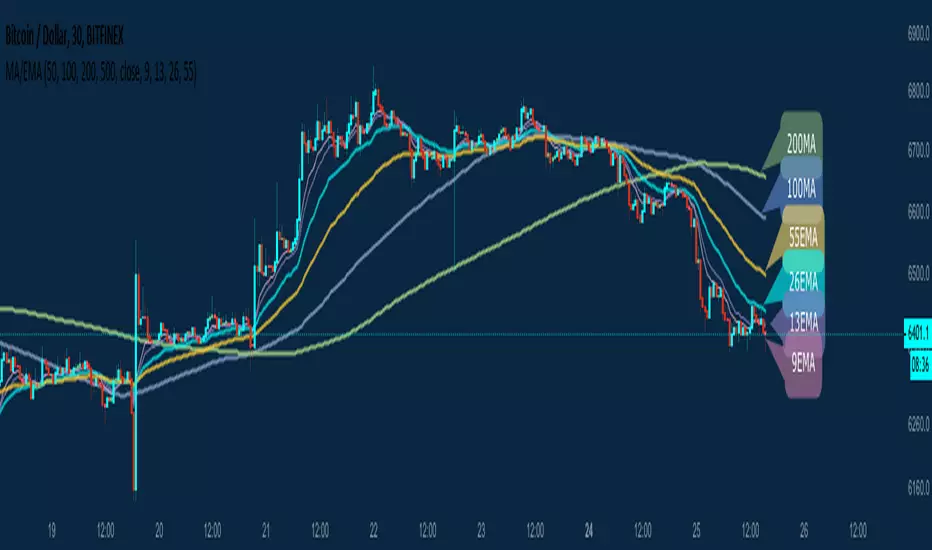
Ruler's Multiple Moving Averages - 8 EMA/MAA handy tool for those who need Multiple Moving Averages in a single indicator!
A great collection of 8 very powerful EMAs and SMAs including:
50MA 9EMA
100MA 13EMA
200MA 26EMA
500MA 55EMA
Of course, completely customizable to your own needs. No need to upgrade your Tradingview account to be able to use multiple MA indicators when you can have all of them in a single Indicator.
All feedback is welcome of course! Enjoy.

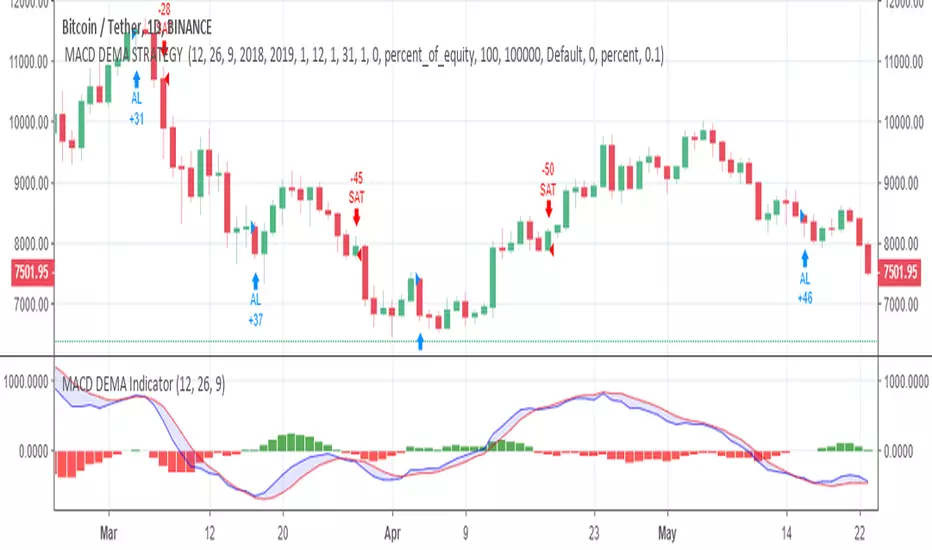
MACD DEMA STRATEGY A strategy based on ToFFF MACD DEMA indicator
Even so , ı dont recommended using MACD DEMA alone.
Combine its code with your favorite indicators.
You can visit ToFFF's indicator :
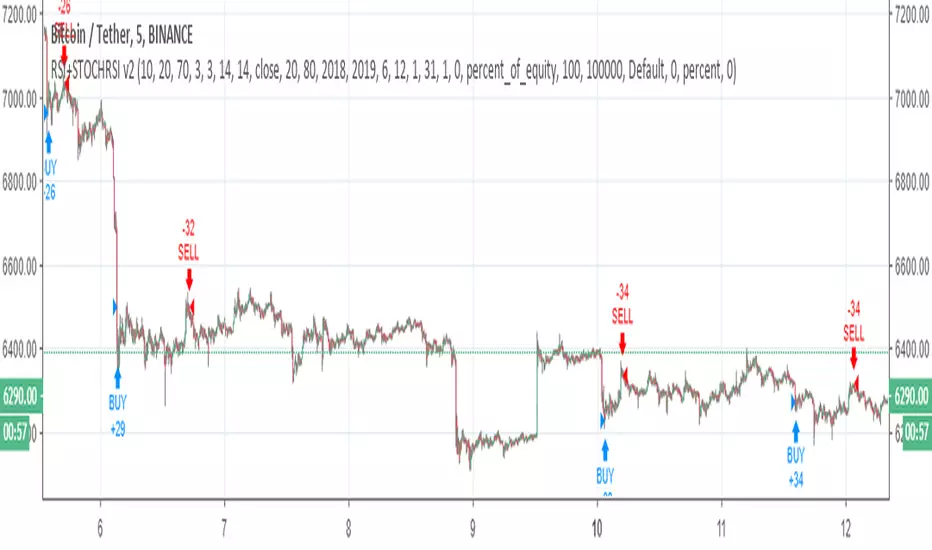
RSI+STOCHRSI v2RSI + STOCHASTIC RSI combination v2 ( for v1 )
For 5 min
Changes
Stcoh RSI creates signal with crossover
RSI created signal with an equation ( above or below the line) ,crossover was added.
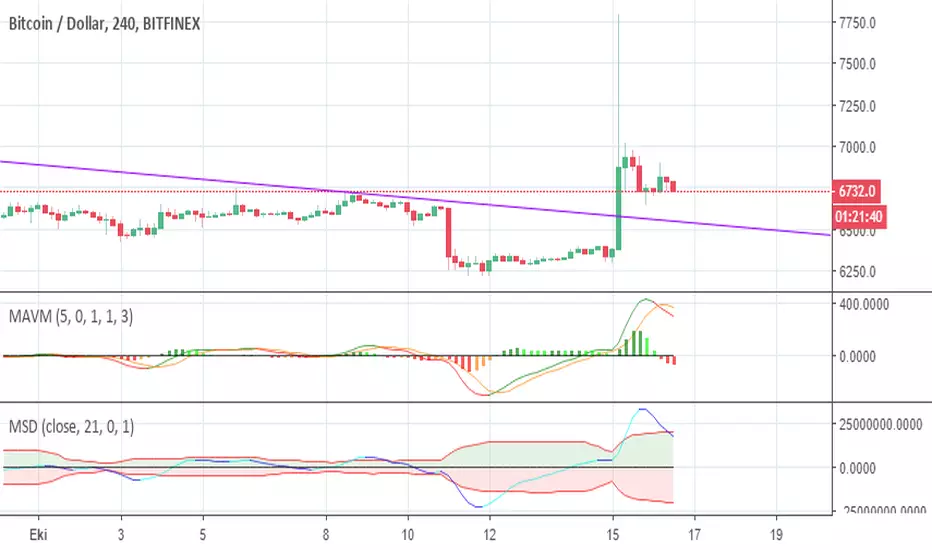
DPD INDICATOR (DEMA PRICE DİFFERENCE PERCENTAGE )I use DEMA and Price difference in many strategies and and trade.
Finally , ı wanted to build an indicator for relation between them.
It calculates the percentage of difference between price and dema and estimates deviation from the main trend.
Formula = (price-dema)/price*100
There is some parameters;
DEMA Length is length of dema , ı think 50 is good enough,
there is upper and lower band for DPD Score .
You can change it based on volatilities of your pairs to find an optima.
and use it to be sure about your entry point.
I will developed and combine DPD with some other indicators and build strategies with it.
You can be part of that , I am waiting for your feedback.
Stay in Touch :)

percentage distanceI do not know good english for explanation sorry.
Percentage distance of price to 21ma. Percentage distance of 21ma to 55ma
if such a thing is needed, it's here


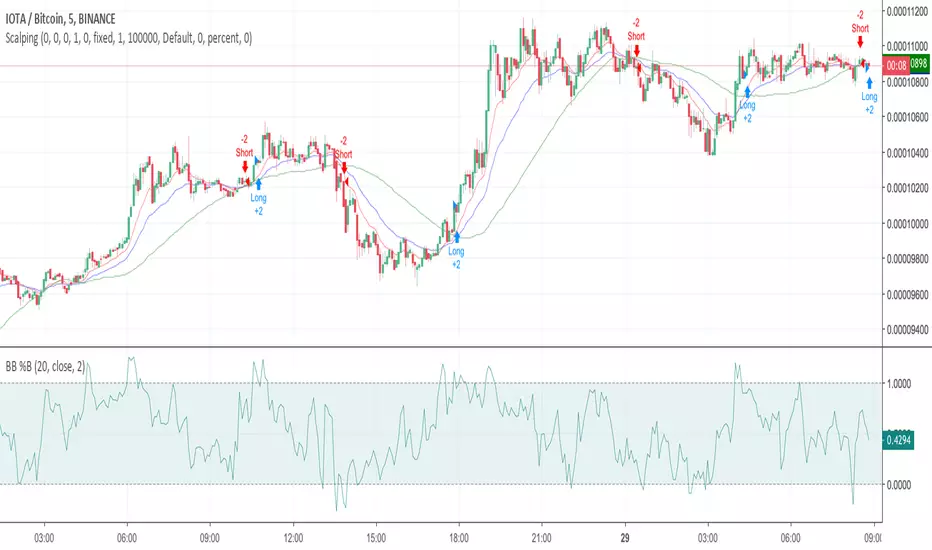
MTF stochastic strategyThis strategy is based on MTF strategy found on Forex Factory forum and published by bobby2 (credits to him).
This is quite simple but need improvement to work properly:
1- it is made for 5 min chart
2- when 15min stochastic cross above 50 and 5min stochastic is rising, buy
3- when 15min stochastic cross below 50 and 5min stochastic is falling, sell

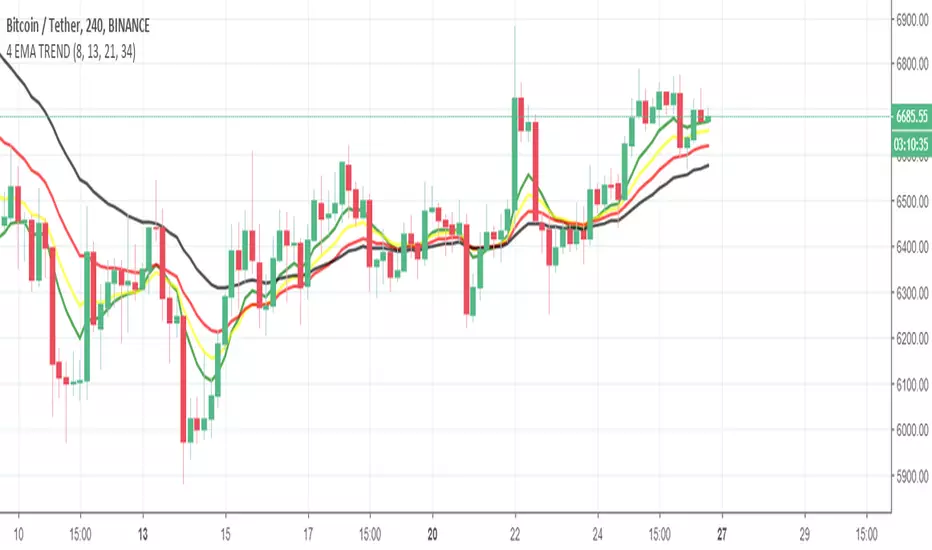
4 EMA TREND INDICATORİf GREEN > YELLOW > RED > BLACK
UPWARD TREND
If BLACK > RED > YELLOW > GREEN
DOWNWARD TREND
In upward trend , if green(fastest ema) crossunder YELLOW or RED or both of them , you can close the position . Dont wait the Downward Trend.
Lengths of EMAs are based on Fibonacci numbers ( 8,13,21,34) , if you want, you can change it based on your strategy.