Bitcoin Bulls and Bears by @dbtrBitcoin 🔥 Bulls & Bears 🔥
v1.0
This free-of-charge BTC market analysis indicator helps you better understand what's going with Bitcoin from a high-level perspective. At a glance, it will give you an immediate understanding of Bitcoin’s historic price channel dating back to 2011, past and current market cycles, as well as current key support levels.
Usage
Use this indicator with any BTCUSD pairs , ideally with a long price history (such as BNC:BLX )
We recommend to use this indicator in log mode, combined with Weekly or Monthly timeframe.
Features
🕵🏻♂️ Historic price channel curve since 2011
🚨 Bull & bear market cycles (dynamic)
🔥 All-time highs (dynamic)
🌟 Weekly support (dynamic, based on 20 SMA )
💪 Long-term support (channel bottom)
🔝 Potential future price targets (dynamic)
❎ Overbought RSI coloring
📏 Log/non-log support
🌚 Dark mode support
Remarks
With exception of the price channel curve, anything in this indicator is calculated dynamically , including bull/bear market cycles (based on a tweaked 20SMA), ATHs, and so on. As a result, historic market cycles may not be 100% accurately reflected and may also differ slightly in between various time-frames (closest result: Monthly). The indicator may even consider periods of heavy ups/downs as their own market cycles, even though they weren’t. Due to its dynamic nature, this indicator can however adapt to the future and helps you quickly identify potential changes in market structure, even if the indicator is no longer updated.
On top of that bullmarket cycles (colored in green) feature an ingrained RSI: the darker the green color, the more the RSI is overbought and close to a correction (darkest color in the chart = 90 Weekly RSI). In comparison with past bull cycles, it helps you easily spot potential reversal zones.
Thanks
Thanks to @quantadelic and @mabonyi which both have worked on the BTC "growth zones" indicator including the price channel, of which I have used parts of the code as well as the actual price channel data.
Follow me
Follow me here on TradingView to be notified as soon as new free and premium indicators and trading strategies are published. Inquire me for any other requests.
Enjoy & happy trading!
Kriptopara

Rate ConverterThis is a simple rate converter that can convert almost anything into almost anything else. It supports cryptocurrencies, currencies and most commodities.
On the chart we see the following:
USD (US Dollar) into EUR (Euro) as a candle stick chart
WTICO (West Texas Intermediate Crude Oil) into ISK (Icelandic Krona) as a bar chart
ADA (Cardano) into JMD (Jamaican Dollar) as a line chart
XPT (Platinum) into XAG (Silver) as a scatter plot
It supports plotting the rates as japanese candlesticks, bars, lines, or as a scatter plot.

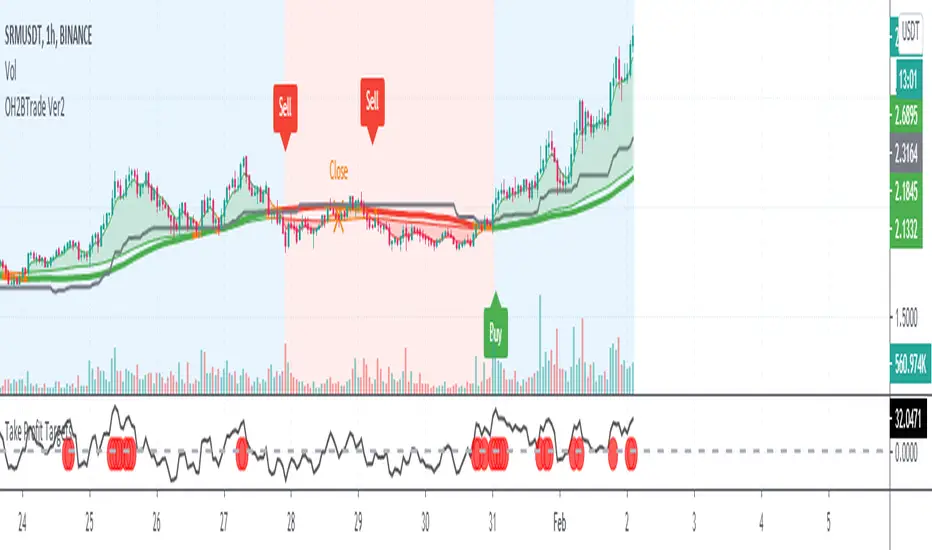
OH2B Trading Indicator Ver2.0OH2B TRADING INDICATOR
The OH2B Trading Indicator is an indicator built for beginners.
It gives you entry points for BUY and SELL based on Trend Channel and Ema-Crossover.
It also gives you EXIT POINTS for taking profits based on the Average Directional Index and Relative Strength Index.
TRADING WITH OH2B INDICATOR
The OH2B Trading Indicator gives you entry points for BUY or SELL .
When the ema1 crosses above ema2, the trend channel will be painted GREEN in color, and a BUY signal will appear. = BUY
When the ema1 crosses below ema2, the trend channel will be painted RED in color, and a SELL signal will appear. = SELL
When a BUY or SELL signal appears on the chart, don't rush into any trade.
Please allow a few hours for confirmation of signals .
After confirmation, it is suggested to enter 50% first and another 50% near the Trendlines .
After entering a trade, please remember to set a stop-loss alert of an opposite signal.
To TAKE PROFIT , please follow the Triangles indicated on the chart
RED Triangles are the Take-Profit targets for the BUY (long) signal
GREEN Triangles are the Take-Profit targets for the SELL (short) signal
*After taking profit, please set a Stoploss to at least break-even level to protect your profits.
Often the price goes to the Trendlines after the signal, so keep some funds to increase the position or even open all position near the Trendlines , or use it for re-enter with SL after you closed position on TPs.
Setting alerts for Trade
Remember to set an alert so that you won't miss any opportunity.
TradingView will notify you immediately when a new signal pops up on the chart.
Tips for the beginners:
Recommended using the indicator at 1H - 2H Timeframe .
Recommended using the indicator for Spot Trading at both Crypto and Stock Market.
Do not use leverage above 5x.
No more than 5% of the deposit in one trade.
Do not rush into any trade when a new signal pops up, please allow a few hours for confirmation of signals.

Total Volume BTC - Dollar [Sobhm]
Do you want an indicator that shows the total volume in Bitcoin vs Dollar?!
The BTCUSD - BTCUSDT - BTCUSDC total volume is covered by the "Total Volume BTC - Dollar " indicator.
You can see the differences between simple volume and the collected volume using "Total Volume BTC - Dollar ".
The volume of the following pairs are collected:
'BITMEX:XBTUSD'
'BINANCE:BTCUSDT'
'BINANCE:BTCUSDTPERP'
'BITSTAMP:BTCUSD'
'COINBASE:BTCUSD'
'BITFINEX:BTCUSD'
'BYBIT:BTCUSD'
'GEMINI:BTCUSD'
'OANDA:BTCUSD'
'FTX:BTCUSD'
'FX:BTCUSD'
'HUOBI:BTCUSDT'
'BYBIT:BTCUSDT'
'COINBASE:BTCUSDC'
'BITSTAMP:BTCUSDC'
'POLONIEX:BTCUSDC'
'KUCOIN:BTCUSDC'
'HITBTC:BTCUSDC'
The timeframe is adjustable based on minutes.

trendOne [Alerts]BITSTAMP:BTCUSD
trendOne
(alerts)
This script combines all our previous trend-based scripts (Bows, Autopilot, Trend Indicator, Price Deviation, etc) in only one script .
To calculate the trend we use:
Volume Weight
Average True Range
Bows calculations
Trends smoothed with alma() function.
For more accuracy on the signals and to filter unwanted signals we layered slower time-frames in the background and added breaking support & resistance rules.
Inputs
Sensitivity
Integer input. Sets the sensitivity for signals generated up and down. Higher values will generate less signals on chart, and vice-versa.
Enjoy!
To get access to this and other scripts check links below.

Multi-Timeframe Stoch RSIGood evening folks!
Today I want to share with you a simple variant of the Stochastic-RSI built-in indicator.
Nothing too complex: by enabling the relative checkbox and setting the desired (k, d or the RSI ) source and timeframes, you can see higher timeframes data plotted on your screen.
Everything you need to do is enabling the indicator on the lowest timeframe (in this case 15 minutes), then you will see in YELLOW the information retrieved from the next higher timeframe (in this case 30 minutes) and in RED the information retrieved from the highest timeframe (in this case 45 minutes).
IT'S IMPORTANT THAT YOU DISPLAY THE INDICATOR ON THE LOWEST TIMEFRAME!
You can play with the overbought and oversold heights in order to have the best configuration you want (in oversold conditions is suggested to buy while in overbought conditions is suggested to sell)
The higher timeframes data are retrieved avoiding repainting since the method used for taking them is the 10th method described in this PineCoders Article , so, if you want to enable alerts, you SHOULD ignore the disclaimer message related to it without any problem.
Good Trading!

OH2B Take Profit IndicatorOH2B Trading Indicator
The Take-Profit Indicator gives you exit points for taking profits based on the Average Directional Index and Relative Strength Index.
It also gives you possible swing-high and swing-low in a trend .
The OH2B Trading Indicator is an indicator that gives you entry points for BUY and SELL based on Trend Channel and Ema-Crossover.
Both indicators work better in tandem with the best result.
Trading with Both Indicators
Orange Zone : Wait for the next signal from OH2B Trading Indicator.
The OH2B Trading Indicator gives you entry points for BUY or SELL .
When the ema1 crosses above ema2, the trend channel will be painted GREEN in color, and a BUY signal will appear. = BUY
When the ema1 crosses below ema2, the trend channel will be painted RED in color, and a SELL signal will appear. = SELL
When a BUY or SELL signal appears on the chart, don't rush into any trade.
Please allow a few hours for confirmation of signals .
To take profit, please follow the Take-Profit Indicator at the bottom.
RED dots are the Take-Profit targets for the BUY (long) signal
GREEN dots are the Take-Profit targets for the SELL (short) signal
*After taking profit, please set a Stoploss to at least break-even level to protect your profits.
When the price enters the Orange Zone again, you may close your trade and wait for the next signal.
If you like to keep your positions at Orange Zone, please remember to set a stop-loss alert when an opposite signal pops up on the chart.
Often the price goes to the Trendline after the signal, so keep some funds to increase the position or even open all position near the Trendline , or use it for re-enter with SL after you closed position on TPs.

OH2B Trading Indicator for Swing TradingOH2B Trading Indicator
The OH2B Trading Indicator is an indicator built for advanced traders.
It gives you entry points for BUY and SELL based on Trend Channel and Ema-Crossover.
It offers you a higher frequency of signals for swing trading.
The Take-Profit Indicator gives you exit points for taking profits based on the Average Directional Index and Relative Strength Index.
Trading with Both Indicators
Orange Zone : Wait for the next signal from OH2B Trading Indicator.
The OH2B Trading Indicator gives you entry points for BUY or SELL .
When the ema1 crosses above ema2, the trend channel will be painted GREEN in color, and a BUY signal will appear. = BUY
When the ema1 crosses below ema2, the trend channel will be painted RED in color, and a SELL signal will appear. = SELL
When a BUY or SELL signal appears on the chart, don't rush into any trade.
Please allow a few hours for confirmation of signals .
To take profit, please follow the Take-Profit Indicator at the bottom.
RED dots are the Take-Profit targets for the BUY (long) signal
GREEN dots are the Take-Profit targets for the SELL (short) signal
*After taking profit, please set a Stoploss to at least break-even level to protect your profits.
When the price enters the Orange Zone again, you may close your trade and wait for the next signal.
If you like to keep your positions at Orange Zone, please remember to set a stop-loss alert when an opposite signal pops up on the chart.
Often the price goes to the Trendline after the signal, so keep some funds to increase the position or even open all position near the Trendline , or use it for re-enter with SL after you closed position on TPs.
Tips for the traders:
Recommended using the indicators at 1H Timeframe .
Recommended using the indicators for Spot Trading at both Crypto and Stock Market.
Do not use leverage above 5x.
No more than 5% of the deposit in one trade.
Try to enter/exit a position by limit orders.
Do not rush into any trade when a new signal pops up, please allow a few hours for confirmation of signals.
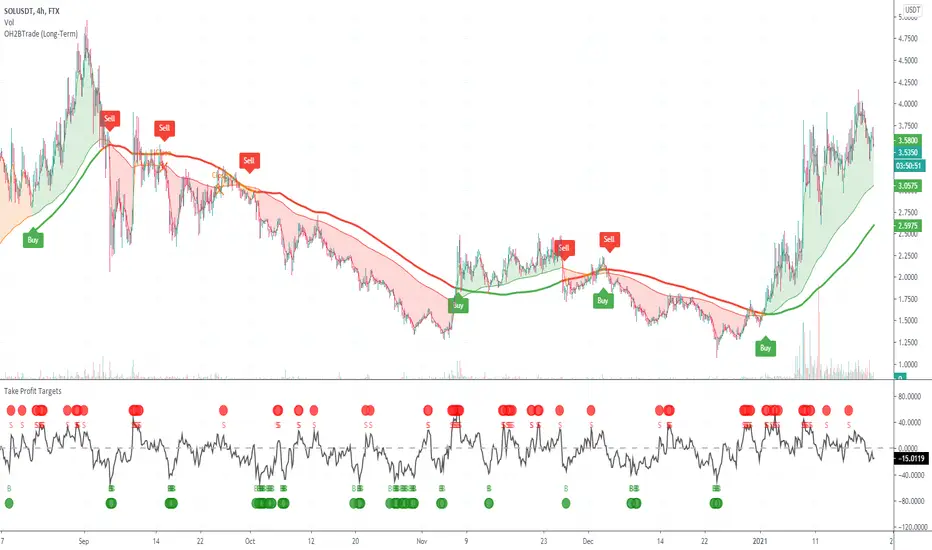
OH2B Trading Indicator for Long-Term TradingOH2B Trading Indicator
The OH2B Trading Indicator is an indicator built for beginners.
It gives you entry points for BUY and SELL based on Trend Channel and Ema-Crossover.
The Take-Profit Indicator gives you exit points for taking profits based on the Average Directional Index and Relative Strength Index.
Trading with Both Indicators
Orange Zone : Wait for the next signal from OH2B Trading Indicator.
The OH2B Trading Indicator gives you entry points for BUY or SELL .
When the ema1 crosses above ema2, the trend channel will be painted GREEN in color, and a BUY signal will appear. = BUY
When the ema1 crosses below ema2, the trend channel will be painted RED in color, and a SELL signal will appear. = SELL
When a BUY or SELL signal appears on the chart, don't rush into any trade.
Please allow a few hours for confirmation of signals .
To take profit, please follow the Take-Profit Indicator at the bottom.
RED dots are the Take-Profit targets for the BUY (long) signal
GREEN dots are the Take-Profit targets for the SELL (short) signal
*After taking profit, please set a Stoploss to at least break-even level to protect your profits.
When the price enters the Orange Zone again, you may close your trade and wait for the next signal.
If you like to keep your positions at Orange Zone, please remember to set a stop-loss alert when an opposite signal pops up on the chart.
Often the price goes to the Trendline after the signal, so keep some funds to increase the position or even open all position near the Trendline , or use it for re-enter with SL after you closed position on TPs.
Tips for the beginners:
Recommended using the indicators at 4H Timeframe .
Recommended using the indicators for Spot Trading at both Crypto and Stock Market.
Do not use leverage above 5x.
No more than 5% of the deposit in one trade.
Try to enter/exit a position by limit orders.
Do not rush into any trade when a new signal pops up, please allow a few hours for confirmation of signals.
PROFIT MAKER |Crypto|ETH|BTC|YFI - SignalThis is the version with alerts of this strategy:
Description:
This is a trend-following strategy that works very well for many Crypto assets in the usd or usdt pair
It can be used for both futures and spot!
Some of the assets in which this strategy is proven are
Asset Exchange TF
BINANCE:ADAUSDT Binance 45m
BINANCE:BTCUSDT Binance 1h
BINANCE:YFIUSDT Binance 30m
BINANCE:DOTUSDT Binance 45m
BINANCE:ETHUSDT Binance 30m
BINANCE:LINKUSDT Binance 45m
BINANCE:DOGEUSDT Binance 1h
And many others..
What is this strategy based on?
It is a combination of various parameters, including
-RSI: The relative strength index ( RSI ) is a momentum indicator used in technical analysis that measures
the magnitude of recent price changes to evaluate overbought or oversold conditions in the price of a stock or other asset.
-MACD: Moving average convergence divergence ( MACD ) is a trend-following momentum indicator that shows
the relationship between two moving averages of a security’s price.
-ADX: ADX is used to quantify trend strength. ADX calculations are based on a moving average of price range expansion over a given period of time.
-DMI: DMI is a moving average of range expansion over a given period (the default is 14 days). The positive directional
movement indicator ( +DMI ) measures how strongly price moves upward; the negative directional movement indicator ( -DMI )
measures how strongly price moves downward. The two lines reflect the respective strength of the bulls versus the bears.
Included:
Different forms of Take profit, included:
Take profit on squeeze candles
Take profit based on Risk-Benefit (RR)
Take profit a pre-determined %.
Different forms of Stop Loss, including
ATR-based stop loss
Trail stop loss (with option to use a trigger)
Stop loss a pre-determined %.
For access you can send a message or consult in my social networks.
Links in my tradingview signature (below).
Examples:
The default configuration works very well for most pairs.
You just have to look for which time frame goes better with each one.
Recommended to try with 30m, 45m and 1 hour.

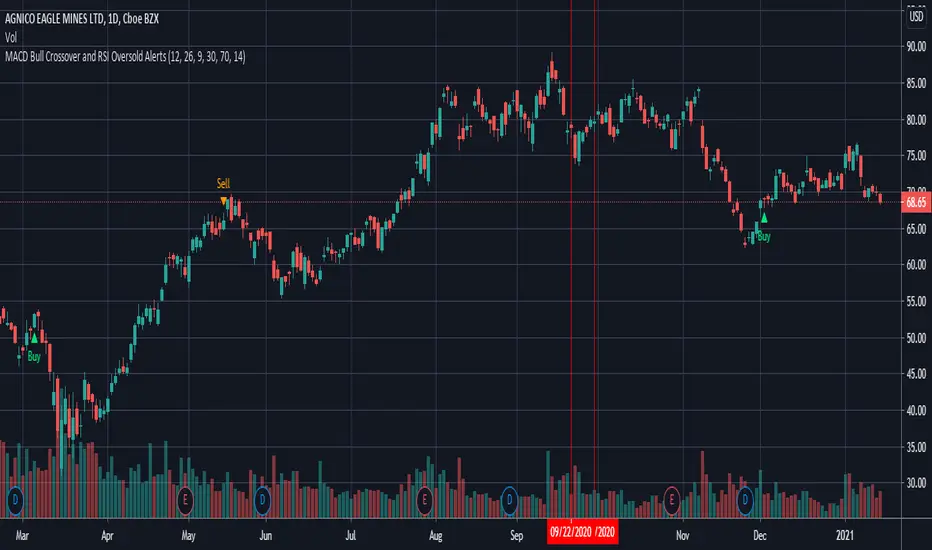
MACD Bull Crossover and RSI Oversold - AlertsHello everyone, these are the alerts for my previous "MACD Bull Crossover and RSI Oversold" Long Strategy. This version currently does not support stoploss and takeprofit alerts but the next update will.
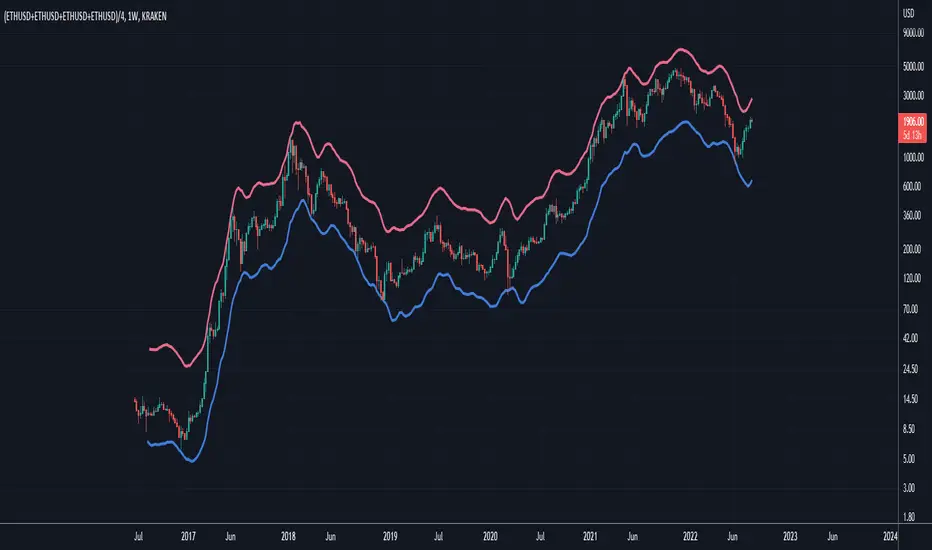
Ethereum: Confidence BandsPurpose of this Script
Similar to "Bitcoin: Confidence Bands", this script is designed to show regions of positive and negative overextension for Ethereum, where price is expected to either reverse long-term or at least shorter-term, using custom price loops tuned for the Ethereum case. Again, the idea is that one can be highly confident that Ethereum's price stays within the Confidence Bands, especially when looking at weekly closes. It might be wise to reduce exposure to Ethereum when price gets very near to the red band, and vice versa for an approach of the blue band. Of course this constitutes no financial advice, and one should always consider all available information for making trading decisions.
Settings
This indicator should only be used:
- with the default inputs (but of course feel free to play around a bit for testing purposes)
- on the weekly (W) time frame
- and for the following ticker setup, used to get well averaged Ethereum price data (ideally just copy this and paste it into the ticker field in the upper left area of the chart interface): (KRAKEN:ETHUSD+COINBASE:ETHUSD+BITFINEX:ETHUSD+POLONIEX:ETHUSD)/4
Otherwise the intended functionality cannot be guaranteed.
Access
For access please contact me via DM on TradingView or on Twitter (linked on my TradingView profile and in my signature).
Bitcoin: Confidence BandsPurpose of this Script
This script is designed to show regions of positive and negative overextension for Bitcoin, where price is expected to either reverse long-term or at least shorter-term, using custom price loops. The idea is that one can be highly confident that Bitcoin's price stays within the Confidence Bands, especially when looking at weekly closes. It might be wise to reduce exposure to Bitcoin when price gets very near to the red band, and vice versa for an approach of the blue band. Of course this constitutes no financial advice, and one should always consider all available information for making trading decisions.
Settings
This indicator should only be used:
- with the default inputs (but of course feel free to play around a bit for testing purposes)
- on the weekly (W) time frame
- and for the BraveNewCoin Liquid Index for Bitcoin (BNC:BLX).
Otherwise the intended functionality cannot be guaranteed.
Access
For access please contact me via DM on TradingView or on Twitter (linked on my TradingView profile and in my signature).

Realized Volatility (annualized for any time frame)Plots standard deviation of returns (realized volatility), and annualizes it for the selected timeframe. Suitable for forex/cryptocurrencies which trade 24/7.

MACD Crossover with signalsMACD Crossover with signals - a simple trading indicator based on classic MACD.
It shows crossovers and plots them on chart as "Long" or "Short".
The MACD itself is not plotted in order to keep your charts cleaner.
By default, all the crossovers are displayed on the chart.
However, you can use only trend-based ones. They are filtered according to the trend (which is plotted and colored using 200 period EMA) and the "zero-line rule" of the MACD.
So if you consider using only trend-based signals, the indicator will only show Long signals on an uptrend and Short signals on a downtrend.
All signals/lines can be turned on/off and styled in the settings menu.
It can be used with all major timeframes and assets (crypto, fx, cfd, stocks, commodities etc).
Consider using it with respect to your trading style, money- and risk-management as well as other strategies and indicators.
If it was useful for you – hit the Like button and share it with your friends - it's free 😉


Bitcoin Comparison to GBTC!This script tells you if GBTC is overvalued or undervalued compared to Bitcoin.

PpSignal Impulse V1.20PpSignal impulse is based on the concept of relative strength index, Rsi its acronym in English.
Although the calculation is similar, it differs in how the force is calculated. To calculate the force we are based on the analysis of the trend through a WMA.
It is important to clarify that you must do a prior analysis of the asset that you are going to trade, such as resistance supports, channels, chart formations, etc.
Buy when the sign is white.
Sell when the signal is red.
You can also perform buy or sell boosts if you activate impulse 2 and 3.

PpSignal Haiken Ashihere is the development of ppsignal Heiken Ashi with a formula of ours.
It also has a Smooth move average.
When HA this green is buying, when red is selling... simple entry system for scalping.
Enjoy it

MACD With Trend Filter: Visual Backtest Module TemplateSample Strategy: MACD Crossover with trend filter options
MA Filter : Price Close Above MA, Search for Buy, Price Close Below MA, Search for Sell
ADX Filter : Take trade only when ADX is above certain treshold
MACD Signal : MACD Cross above signal line while under 0 line indicate Buy Signal
MACD Cross below signal line while above 0 line indicate Sell Signal
-----------------------------
Using Alert Module:
Enable Alert --> Enable TV's alert and plot signal to chart
Alert Type --> Set to take Buy only, Sell only or Both alert
----------------------------
Using Backtest Module:
Enable Backtest --> Enable Backtest simulation
Backtest Type --> Set to take Buy only, Sell only or Both
SL Type -->
ATR : Set SL in ATR times Multiplier below/above entry price
Fixed : Set SL in fixed point below entry point (in 'Dollar'). e.g. for Stocks -> 0.5 equals to 50cent while for EURUSD currency -> 0.005 equal to 50 pips
HiLo Bar : Set SL at highest/lowest wick of previous bar plus/minus Fixed point. e.g. EURUSD HiLo=3 and Fixed Point = 0.0005, buy trade will place SL 5 Pips below lowest of previous 3 bar
SL ATR Period --> Set Lookback Period used for SL's ATR calculation
SL ATR Multi --> Set ATR Multiplier for SL
SL Fixed --> Set Fixed Level for SL (Use when SL Type is either Fixed or HiLo Bar)
SL Bar --> Set Number of previous bar to check for SL placement
TP RR Ratio --> Set TP based on RR multiplier. e.g. 2 means TP level will be twice further from entry point compared to Entry-SL distance.
Notes: The point is for preliminary testing, so it only supports 1 trade at a time and no Trailing Stop
----------------------------
Disclaimer:
This script main objective is to create my personal indicator template so that i just have to modify the indicator module for preliminary testing in future.
Testing Alert Module so i can re-use it as template in future study/indicator
Testing Visual Backtest Module so i can re-use it as template in future study/indicator
i believe using Strategy function is a better approach for this but the entry/exit level seems to be hit n miss (at least for me, still trying to figure what i did wrong)
also, i rather code the strategy in other platform where i can use the more accurate tick data if i want to validate backtest statistics.
My study scripts was built only to test/visualize an idea to see its viability and if it can be used to optimize existing strategy.
credit: ADX code are originally from "ADX and DI" by @BeikabuOyaji although i re-wrote so i can have cleaner read and use RMA instead of SMA

Escaping of Rate from Avarage By Mustafa OZVEREscaping of Rate from Average By Mustafa OZVER
This code shows a location of a rate or price (or etc.) from the average, rated by the standard deviation.
To show that, calculates the ema and standard deviation of our data then calculates the distance between ema and the current data by the standard deviation.
In summary, we can say that this value is the current distance by the long term standard deviation.
This value is between +1 and -1 because we expect the absolute value of the standard distance does not get far from the long term standard deviation.
For scalping, we can use this value as
buy signal when the value is below -1,
sell signal when the value is above +1,
But only this value can not guarantee good results for trading. BE CAREFUL

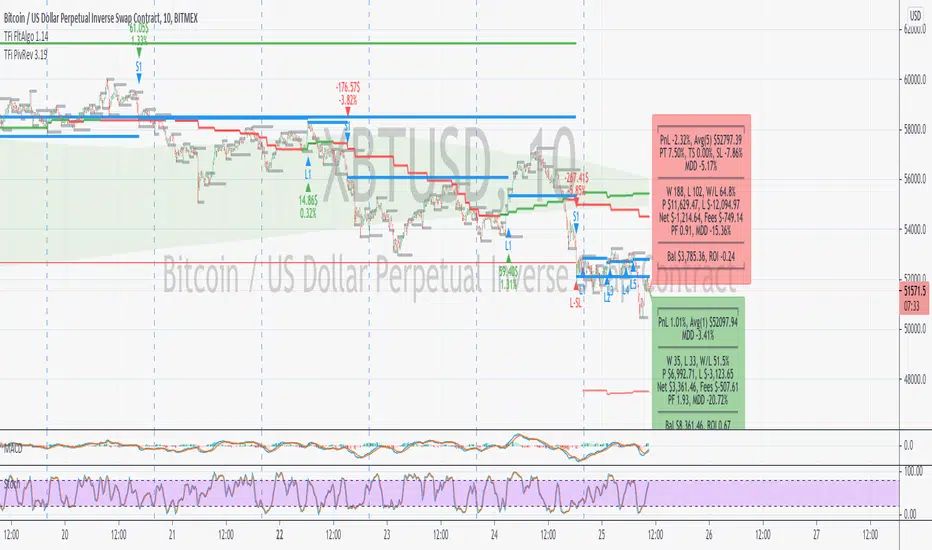
TFi Pivot Reversal V3The Pivot Reversal Study uses pivot points to create a support and resistance level; based on this levels the script creates virtual stop-market orders to catch the trend if the price is crossing the pivot lines.
A "Pyramiding" input allows to configure up to 3 entries; the script enters an additional position if the price falls by a configurable percentage amount (long), the reverse to short orders.
A configurable profit-target and stop-loss is being used to exit an open position.
An optional Moving Average filter can be used to enable only long or short positions.
The script renders a status box at the last bar, which shows the current position status and result of the built-in trading simulation results.
It shows the following statistic values:
current position PnL - also background turns green if position is in profit and red if in loss
the percentage distance to the profit-target and stop-loss level
the overall number of wins and losses and the win/loss ratio
the overall profit and loss amount (assuming a quantity of 1)
the net-profit and profit-ratio
For the correct simulation of entry/exit prices, the script contains inputs for a percentage entry and exit slippage.
The study also creates configurable alerts, which follow the exact position of the entry/exit markers. The default alert messages contain trading instruction to execute orders via Alertatron; but the message content can be replaced if configuring the alert in the Tradingview environment.
The script was mainly backtested with crypto-coins, e.g. XBTUSD at 15min timeframe. But the script also works with any other type of security and timeframe.
How to access
This strategy is a "Invite Only" script. You can can subscribe or purchase the strategy; please use the link below or send me a message via Tradingview to obtain access to the strategy and study script.
For enabling the script in your Tradingview chart window, click on "Indicators" and select "Invite-Only Scripts".
Full list of alerts
'Alertatron Exit' ... Exit all open positions.
'Alertatron Enter Long' ... Enter long position, w/o stop-loss being used.
'Alertatron Enter Short' ... Enter short position, w/o stop-loss being used.
'Alertatron Enter Long SL' ... Enter long position, w/ stop-loss being used.
'Alertatron Enter Short SL' ... Enter short position, w/ stop-loss being used.
Full list of parameters
"Pivot Left Bars" ... Number of bars on the left of the pivot point - used for pivot /peak detection.
"Pivot Right Bars" ... Number of bars on the right of the pivot point - used for pivot /peak detection.
"MA Filter Fast" ... Moving Average filter fast period.
"MA Filter Slow" ... Moving Average filter slow period.
"Profit Target Option" ... Configure the profit-target either as a fix percentage value or an ATR.
"Profit Target " ... Fix percentage profit-target.
"Profit ATR Period" ... ATR profit-target period.
"Profit ATR Factor" ... ATR profit-target factor/multiplier.
"Stop Loss Option" ... Configure the stop-loss either as a fix percentage value or disable the stop-loss completely.
"Stop Loss " ... Fix percentage stop-loss.
"Rebuy Loss " ... Percentage loss of the initial position before script enter a nw position in the same direction.
"Pyramiding" ... Maximum number of positions.
"Show MA Plots" ... Show/hide Moving average plots.
"Slippage Entry " ... Percentage slippage for entering a position.
"Slippage Exit " ... Percentage slippage for exiting a position.
"Statistic Label" ... Defines the position of the statistic label relatively to the last bar in the chart.
"Backtest Start" ... Backtest start time; area outside this timeframe will be grayed out.
"Backtest Stop" ... Backtest stop time; area outside this timeframe will be grayed out.
"Backtest Mode" ... Closes the currently opened position if chart switches to last bar; please only enable if backtesting, otherwise it leads to unwanted alerts.
Ichimoku Cloud ForecastUsing doubled crypto settings, forecast Tenkan and Kijun lines, assuming price remains neutral (constant).
Tenkan - 14 periods
Kijun - 20 periods
