Kripto

Squeeze Momentum Strategy based on Indicator [LazyBear][Bitduke]I improved Squeeze Momentum Indicator by LazyBear (momentum filter, changed data source to ohlc4) and transformed it into a strategy, adding a risk management system + ability to customize time frames for backtest.
Shortly about Squeeze Momentum Indicator:
This is a derivative of John Carter's "TTM Squeeze" volatility indicator, as discussed in his book "Mastering the Trade" (chapter 11).
Backtested on XBTUSD, ETHUSD (Bitmex). As you may notice it shows good results on 1h - 4h timeframes on these timeframes among these pairs. Relatively low drawdown ~ 12% (to date).

ZoneBand (@Mido_yuiya)Bollinger band is converted to EMA , and support and resistance bands are made into regions

BEST Mayer MultipleHello traders
I'm not a HODLer by any means. I know when to sell (or I think I know....) when an asset starts going against me too much.
Even if it's a "long-term" investment.
My mentor used to telling me this: "If a short-term trade becomes a long-term investment, then you're in for a hell of a ride".
I have no clue if Bitcoin/BTC will go back up or not - I don't even care because I'm an intraday trader.
What if BTC was actually a way to accumulate more fiat? Satoshi fooled us
I coded this Mayer Multiple according to the specifications below. By the way, I'm a big fan of Willy Woo. I've been monitoring all his work since I learned about crypto (10 minutes ago.... it's a joke come on)
charts.woobull.com
Scaling
To respect the Mayer's multiple model, I recommend to select the Logarithmic scaling as shown below
imgur.com
What Mayer's model says
Using the reference below, the model says we're in the oversold zone. But, we can be in that zone for months/years...
When a model says an asset could bounce in a 1000-7000 USD range... well... I don't know how I would be able to perform optimally with that insight. This is very subjective and not a recommendation.
Mayer's Multiple model reference
All the BEST
Dave

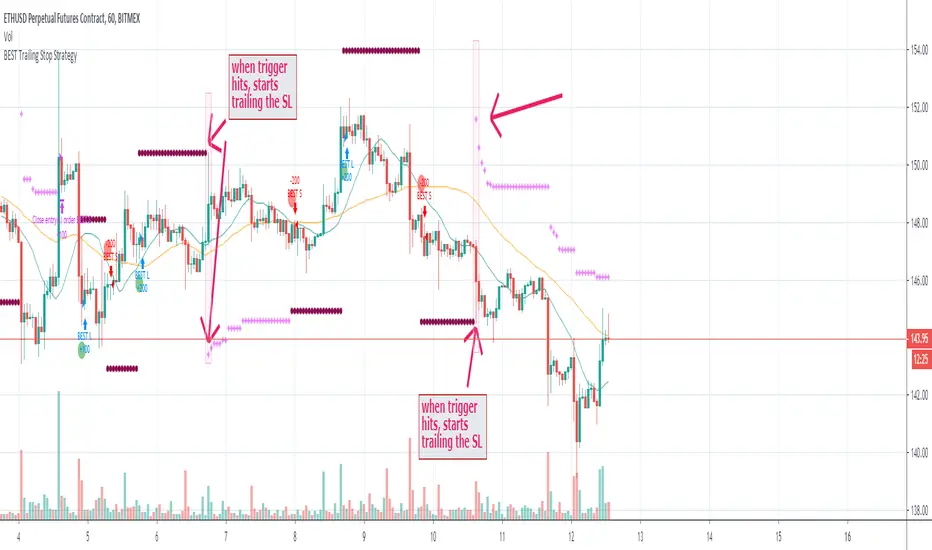
BEST Trailing Stop StrategyHello traders
Here we go again.... with the second strategy snippet.
Reminder: the first snipper was a Trailing Profit strategy script
What's on the menu?
A trailing stop is designed to protect gains by enabling a trade to remain open and continue to profit as long as the price is moving in the investor's favor.
The order closes the trade if the price changes direction by a specified percentage or dollar amount.
Trigger me I'm famous
I developed many trading strategies in my career and often I've been asked to trigger a trailing-stop once a certain % move has been made.
On the screenshot below, the SL trigger is plotted in maroon.
Once the price goes past that level for the first time, I'll start trailing the trailing stop level.
In other words, when we see a price makes an interesting move in percentage value - we decide to trail the stop for at least not losing any more
All the BEST
Dave
Bitcoin Power Law CorridorOpen-source live tracker of Harold Burger's Bitcoin "Power Law Corridor".
Added optional chart fill and labels to show the percentage delta to the regression center-line, support and resistance.

BEST Cloud ALL MAHello traders
Hope you're all doing well
This script is a generic cloud generator using a pre-selected set of moving averages (I probably forgot a lot but listed all the ones I used at least once).
A cloud is a visual representation of the gap between two moving averages - it shows right away how big in that gap (=how far they are from each other)
The challenge is to find a cloud such as the price often stay stuck between those 2 MA - and when it's getting finally out (up or down), it would be strong enough to signal a beginning of a trend.
This is a cool intellectual challenge for all aspiring traders
For that script, I defined a trend according to how the 2 MAs are located relative to each other (MA1 > MA2 or MA1 < MA2) and if the price gets out of the cloud.
You'll get :
- the option to color the candles based on a trend
- cool triangles entry signals
- and alerts on those triangles
All the BEST
Dave

Syminfo.TypeHello traders
Earlier this week I discovered a new built-in variable called syminfo.type
What is it for?
This variable returns the type of the current symbol. Possible values are cfd, stock, futures, indices, forex, crypto, fund.
Cool bro but... should we care?
Well... we all should. Imagine you have a generic script and you want a different configuration whether you're trading FOREX or Crypto .
I designed a dummy example in that script that will preset the inputs according to the asset type from the chart.
Here I want 12/26/9 for forex and 20/50/50 for crypto - 30/60/90 otherwise
Quick caveat
It seems that for any crypto asset, syminfo.type returns "bitcoin". TradingView will fix it at some point but wanted to give you the heads-up regardless
Enjoy and all the BEST ^^
--
Dave

Volume ComparisonThis script shows the volume of the current chart relative to the volume of another selected ticker.
For meaningful information you should compare coins with the same base pair (for example BTCUSD against LTCUSD).
Volume bars will be plotted green if the other security's volume is higher, red otherwise.
You may use this script go generate alerts and automate your trading with a bot such as WolfBot.org

InfoPanel - SeasonalityThis panel will show which is the best month to buy a stock, index or ETF or even a cryptocurrency in the past 5 years.
Script to use only with MONTHLY timeframe.
Thanks to: RicardoSantos for his hard work.
Please use comment section for any feedback.

InfoPanel Divergence IndicatorThis panel spots divergences of some well knonw indicators. It may be usefull because you have all indicators in one panel only.
Also, you can check on chart which indicator gives better results of each pair on stock or index or crypto.
TO DO: to add custom indicators.
thanks to: RicardoSantos for his script of panel coding
Tradingview scripts
Other members of TV community (I cannot remember the source and inspiration of all snipets)
Please use comment section for any feedback.

REAL STRATEGY : Dow_Factor_MFI/RSI_DVOG_StrategyI'm actually one of those who think it's more important to extract clues from indicators than strategy, but I wanted to test the data about the probability and dow factor I've shared for a long time.
Usually, Bitcoin is used as an eye stain for strategy success, since the graph has increased significantly from the beginning.
To prevent this, I used a commission and in the last lines of document I shared Bitmex's Bitcoin and Ethereum 1W test results.
I don't think there's a factor to repaint. ( Warn me if u see or observe )
I considered Bitcoin because I found working with liquid parities much more realistic.
Ethereum and Bitmex have been featured as a spot and may soon find a place at the CME , so I've evaluated the Ethereum .
But since the Ethereum Bitmex was also spot new, I deleted results that were less than 10 closed trades.
Since the Dow Theory also looks at the harmony in the indices, just try it in the Cryptocurrency market.
Use as indicator in other markets. Support with channels, trend lines with big periods and other supportive indicators.
And my personal suggestion : Use this script and indicator TF : 4H and above.
Specifications :
Commission. ( % 0.125 )
Switchable Methods ( Relative Strength Index / Money Flow Index )
Alarms. (Buy / Sell )
Position closure when horizontal market rates weighs.
Progressive gradual buy/sell alarms.
Clean code layout that will not cause repaint. (Caution : source = close )
Switchable barcolor option (I / 0 )
*****Test results :*****
drive.google.com
Summary:
It was a realistic test.
It has achieved great success in some markets, but as I mentioned earlier, use it only to gain insight into the price movements of cryptos.
Use as indicator in other markets.
This code is open source under the MIT license. If you have any improvements or corrections to suggest, please send me a pull request via the github repository : github.com
Stay tuned ! Noldo.

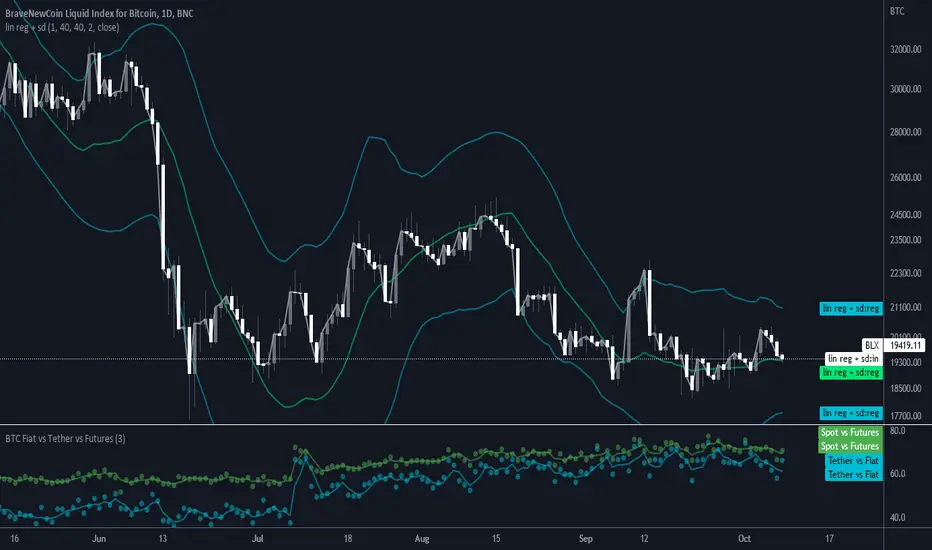
BTC Volume Fiat vs Tether vs FuturesFutures = BYBIT+ BITMEX
Fiat = KRAKEN + BITSTAMP + BITFLYER + COINBASE
Tether = HITBTC + HUOBI + BINANCE + BITFINEX
Spot = Fiat + Tether
Tether vs Fiat = 100 * Tether / (Tether + Fiat)
Spot vs Futures = 100 * Spot / (Spot + Futures)
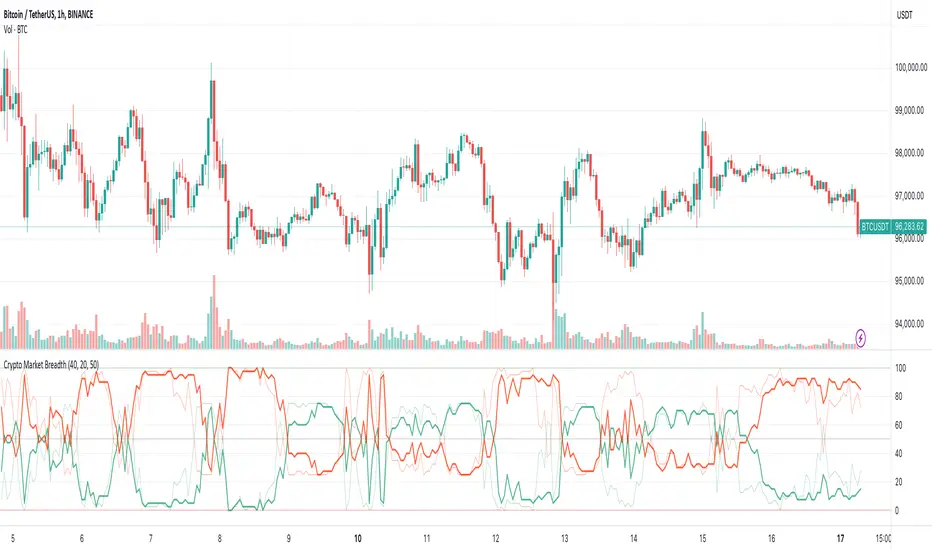
Crypto Market BreadthThis is the "Crypto Market Breadth" indicator from
I updated it to latest symbol so that it resolves again:
removed: BINANCE:NPXSUSD
added: BITFINEX:LEOUSD
Also helpful for automatic trading with WolfBot.org and TradingView Integration
Lancelot vstop intraday trending strategyDear all,
Free strategy again.
I found using 3 volatility stop with different settings could be very helpful when trading an intraday trending market.
With the ATR setting or 5, 10, 15, we can weed out many false break.
Vstop setting is OHLC4.
On the other hand, this strategy also utilize Renko as part of the strategy, so you could say this strategy is mainly an intraday break out trend following strategy.
Works well on BTCUSD XBTUSD, as well as other major liquid alt Pairs.
And lastly,
Save Hong Kong, the revolution of our times.

[Maco] PUELL MULTIPLEReverse formulated what the closed source version is and releasing open source publicly to give back to the community.
If you have any questions feel free to join our Discord!

QuarryLake v4As some of you requested, I will make the code for QuarryLake Open for you all.
I have also updated the script in version 4.
This strategy consists of 3 indicators that I found works quite well together.
Keltner Channel, Waddah Attah Explosion, and Volatility Stop .
KC Period = 200
KCATR = 5
Vstop Period = 3
Vstop Mult = 1.5
Long when close > KC, close > Vstop, WAE trendUp
Short when close < KC, close < Vstop, WAE trendDown
Works well on BTCUSD XBTUSD , as well as other major liquid Pair.
This strategy utilized a modified Kelly position sizing for BTCUSD Bitstamp , feel free to modify it to your needs.
And lastly,
Save Hong Kong, the revolution of our times.

Lancelot RR StrategyDear all,
Free strategy again.
This strategy consists of 2 indicators I think works well with each other as a trend following strategy.
The 2 indicators are Renko chart and Relative Vigor Index.
This is a long-only breakout strategy that aims to capture the majority of the trend.
Works well on BTCUSD XBTUSD, as well as other major liquid Pair.
Please acknowledge my effort by like and follow.
And lastly,
Save Hong Kong, the revolution of our times.

Crypto Multi Exchange Volume (CMEV)Crypto Multi Exchange Volume (CMEV) aggregates and plots trading volumes for supported cryptoasset pairs over multiple different cryptoasset exchanges. For developers looking for more information and for those who want to compile their own version of CMEV, please check out my GitHub (jakobpredin/crypto-multi-exchange-volume).
Configuration
CMEV comes with two configurable settings - whether base volume or quote volume is plotted and the length of the volume's EMA. By default, the base volume is used for plotting and the length of the EMA is set to 12 periods.
Use cases
The indicator was primarily developed in order to be able to chart using the trading pair with the longest available trading history. Due to the fast-changing preferences of where cryptoassets are traded, volumes tend to be very inconsistent and can give a distorted picture of a pairs history. For illustration, check out the SC-BTC pair from Poloniex using their native volume and compare it to the CMEV volume.
The other use case is to be able to spot divergences in volume. A great example here is bitcoin's 2019 rally where volumes from derivatives exchanges are at all time highs but volumes from retail/spot exchanges are not.
Supported exchanges
CMEV currently supports asset pairs from the following exchanges:
Binance
Bitfinex
Bitstamp
Bittrex
Coinbase
Gemini
Kraken
Poloniex
Limitations
Because of the fact that CMEV is pulling data from from multiple different exchanges and is computationally intensive it can take a couple of seconds to load while charting certain cryptoasset pairs.
Additionally, due to Tradingview's various limitations only a certain number of pairs can be supported at a time. By default, only pairs with a BTC or USD quote are supported and many non-unique pairs with consistently low trading volumes have been removed. For a full explanation, please refer to the docs in my GitHub (jakobpredin/crypto-multi-exchange-volume).
Future of the project
I plan on supporting pairs from more exchanges in the future as I see fit and as they become available for charting on Tradingview. Further, I may develop a strategy script using CMEV as its core indicator.
I welcome everybody from the community to help me extend the functionality of CMEV in order to make investing in cryptoassets more transparent for everybody.

Lancelot ATR Volume MeterThis is an experiment I did a while back ago.
I often think On Balance Volume is a great indicator as trend direction and volume cannot lie.
However, I bumped into a few problems.
It is slow, doesn't show volatility and often time it is prone to chop.
That's why I added ATR to the equation.
Original OBV calculation
src > 0? : +volume : src < 0? -volume
Modified OBV with ATR
src > 0 ? +volume * (volume / atr) : src < 0? -volume * (volume / atr)
I have used 2 ema for this modified OBV.
ema 3
ema 18
By adding ATR to the equation we can smooth out many erratic price movement. (Stop hunting)
Also, when price move slowly but steady, often prepping for a big move, this indicator will move faster.
In short, this indicator prevents you from being stop hunted and also provide great entry for a trending market.
Works well on BTCUSD XBTUSD, as well as other major liquid Pair.
Feel free to follow me on Twitter @Lancelot_Auger for more free Alpha.
Please acknowledge my effort by like and follow.
And lastly,
Save Hong Kong, the revolution of our times.

Lancelot Band - ATR Reversal+Trending IndicatorThis is an indicator I created recently, with the mind of spotting where price might reverse and where the price is trending. You can see this as the primary indicator for your system, however, it is recommended you use this in conjunction with other confirmation indicators.
This script focus solely on ATR or Average True Range.
This indicator is the combination of the baseline from the Ichimoku cloud and the concept of the Keltner channel.
Baseline period = 14
ATR period = 14
ATR Mult = 1.5
For reversal
Long when price crossover Lower band & Stop loss at xLower band
Sell when price crossunder Upper band & Stop loss at xUpper band
For Trend Following
Long when price crossover xUpper band and Stop loss at Upper band
Short when price crossunder xLower band and Stop loss at Upper band
Again, you will need other indicators to help you to succeed in this system. This indicator will not generate the best exit for your position but will generate a good entry signal when you use it with both volume indicator and exit indicator.
Works well on BTCUSD XBTUSD, as well as other major liquid Pair.
Feel free to follow me on Twitter @Lancelot_Auger for more free Alpha.
Please acknowledge my effort by like and follow.
And lastly,
Save Hong Kong, the revolution of our times.

QuantCat Mom Finder Strategy (1H)QuantCat Momentum Finder Strategy
This strategy is designed to be used on the 1 hour time frame, on all x/btc pairs.
The beautiful thing is it plots the take profit, and stoploss for you for each entry- where I would say use the stoploss for sure and feel with water with how the price action is looking when in profit.
In this strategy, I actually implemented my own trading style into building the strategy. Having to replicate my own trading strategy into an algorithm, I can't make it exactly perfect to how I would trade, but what I can do is try and program the parameters that give it the absolute best chance of making a big move with a small drawdown- which replicates part of my momentum trading style. Here I am using RSI, MACD, EMA and trend filtering values to find moments where there has been a momentum change to play the rest of the move. It only picks the best entries.
There is always a 3-4 R/R move on average with with these trades, meaning 1 in 4 only need to hit to be a break even trader- where most of these strategies have about 35% hit rate.
The stoploss is so crucial to minimise any damage from huge unexpected candles, the strategies can just be used for entries as well, you don't have to stick to the exact formula- of the long and short system, but this by itself is profitable.
The system nets positive results on
-ETH/BTC
-LTC/BTC
-XRP/BTC
-ADA/BTC
-NEO/BTC etc.
We also have a free 15M strategy available too.
You can join our discord server to get live alerts for the strategy as well as speak to our devs! Link in signature below!!!
