BTC/ETH Lot Size for Dexin - V1.0
█ Overview - This tool is specifically tailored for Delta Exchange India’s users.
I use this interactive tool before taking a position in the BTC’s futures perpetual market . With only 3 mouse clicks, I see all the necessary information, whether a Long or Short position.
A visual of Liquidation Price Level, Stop Loss Price Level, Entry Price Level, Break-even Price Level, and Take Profit Price Level can be immediately seen.
On the top right corner of the chart, which Leverage is to be used, No. of Lots to be taken, expected Profit amount, Loss amount, Brokerage Fees, Risk to Reward Ratios, and Return on Investment are shown, excluding brokerage travel. To get the correct answer in the table that suits your account and risk-taking appetite, the user needs to enter the account balance and Risk per trade.
It also does live tracking of the position, and alerts can be configured too.
█ How to Use
Load the indicator on an active chart.
In the Trading View, ensure that the Magnets is enabled (on the left panel). This will precisely select the price levels you want to choose from OHLC for a candle.
When you first load the tool on the bottom of the chart, you will see a blue box with text in white color guiding you on what you need to do.
Before the first click, the box shall prompt “On the signal candle, set the entry level, where the position would be executed”.
Once the entry price level is selected, the next prompt in the blue box shall be “Set the stop loss level where the position would be exited”. Thus, you need to click the stop loss price level.
Now that the two clicks of Entry and Stop Loss are already done, the last remaining is for the take profit. The last prompt shall be “Set the profit level where the position would be exited”. Therefore, you need to select your take-profit level
Finally, when all three points are selected, the tool shall draw trade zones.
The tool automatically determines whether it is a Long Position or Short Position from the Stop loss and take-profit price levels concerning the entry price level
If the take profit level is above the entry price, the stop must be below, and vice versa; otherwise, an error occurs.
You can change levels by dragging the handles that appear when you select the indicator, or by entering new values in the settings.
Once the position tool is on a chart, it will appear at the same levels on all symbols you use.
If you select the position tool on your chart and delete it, this will also delete the indicator from the chart. You will need to re-add it if you want to draw another position tool. You can add multiple instances of the indicator if you need a position tool on more than one of your charts.
█ Features
Display
The tool displays the following information as graphical visuals
The Liquidation to Stop Loss, Stop Loss to Entry, Entry to Break-even, and Entry to Take Profit zones shall be initiated from the entry candle point.
If you want to be from the candle that crossed the level at a different time from the entry candle, you may go to the settings and adjust the time accordingly. Please note that the time interval is 15 minutes, so at times you may not be able to see the graphical display; however, once the 15-minute time interval is over, you will see the graphical display on the chart.
The tool displays the following information in a tabulated manner
The first row indicates the Leverage that is best suited. The leverage selection by default is greater than or equal to the risk distance.
The second row indicates the number of lots that is computed in relation to the account balance, Risk appetite, Entry price, and Stop Loss price.
The third row indicates estimated profit considering taker's fees and is computed in relation to the number of Lots, Entry price, and Take-Profit price.
The fourth row indicates estimated loss considering taker's fees and is computed in relation to the number of Lots, Entry price, and Stop Loss price.
The fifth row indicates the actual Risk to Reward Ratio, ignoring the travel that pertains to fees.
The sixth row indicates actual Return on Investment, ignoring the travel that pertains to fees.
The intent is to allow the user to make an informed decision prior to taking a position by seeing “$/Rs.” or “% of R O I” or “R : R”.
In case the user wants to know beforehand what the expected charges are that need to be borne before taking a position, that too is made available in the seventh and eighth rows. Both sides' charges are made available for ready reference, irrespective of the outcome of the trade, the user knows the consequences beforehand.
█ Settings
'Trade Sizing'
The tool's input menu is divided into various parts. The first part is 'Trade Sizing'. The user needs to key in the exact number that appears in the Delta Exchange India account against 'Account Balance ($)'. The second thing the user needs to do is key in the 'Risk per Trade'. By default,t it is set to 0.25 and has a default stop change of 0.25. Alternatively, the user can key in any number (Whole number or Rational number) within 100 if that suits their risk management criterion.
'Trade Levels'
Allows users to manually set the Entry, Time, Stop Loss, and Take Profit Price Levels.
'Aggressive Mode Selection'
As the Liquidation zone is shown on the chart, if the user feels that the liquidation price level is too far from the stop loss, this option of 'Use Aggressive Leverage?' allows to increase the leverage, thus reducing the investment amount and in return increasing the Return on Investment %.
The second option in this category is 'Compute Lots based on invested Margin?' itself is self-explanatory, and thus the tabulated data shall be populating the data based on the number entered by the user against 'Margin to be invested ($)'. It is for the user to ensure that the estimated outcomes are within their risk management criterion.
'Conversion & Charges'
If the user wants to see the Profit, Loss, and Fees amount in 'Rs.', all that needs to be done is simply enable the 'Show P&L in Rs.?' The conversion shall take place considering 1 USD = 85 Rs. Same as that carried out by Delta Exchange India.
If the user wants to see the Brokerage Fees, all that needs to be done is simply enable the 'Show Brokerage Fees?'. On enabling this, the table shall show Profitable Trade's (PT) Fees and Lost Trade's (LT) Fees irrespective of the outcome of the trade. The intent is to allow the user to make informed decisions to avoid regrets or surprises at the end of the trade.
'Table'
The division of the input section is related to table position, font size and colors for text and background.
█ Alerts
Alerts can be configured by clicking 'More' (the three dots that appear when you place the cursor on the indicator title that appears on the top left corner of the chart). Alternatively, one can configure alerts by right-clicking on either of the two price levels - Stop Loss price level or Take Profit Price level. Upon right clicking, a window shall appear and the topmost line on that window shall display 'Add alert on ……….' The user can thus put alerts on either of the key levels, such as Stop Loss, Take Profit, and Break Even, or on all of them one by one.
Cryprocurrency

BitMEX BTC Volatility IndexThis indicator displays the BitMEX BTC Volatility Index ( BVOL24H ) as an indicator and it can be compared to the VIX of the cryptocurrencies.
more information about how BVOL24H is calculated can be found here: www.bitmex.com
Symbol can be changed in the parameters

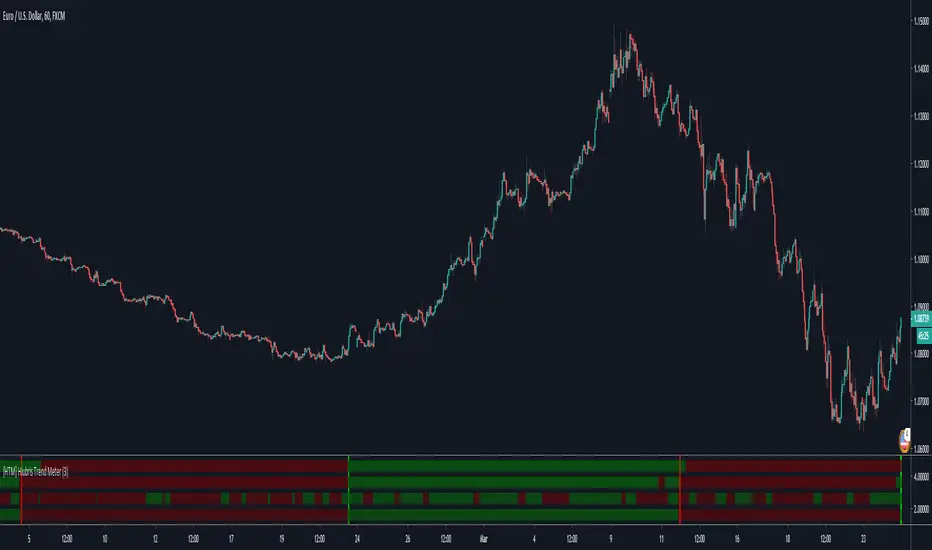
[HTM] Hiubris Trend MeterHOW IT WORKS
This indicator consists of 4 Different Trend Indicators: Gann HILO Activator , Trend Wave Oscillator and 2 Parabolic SAR’s
HOW TO USE
1. When the majority of the meters turn green, it is a sign the market is heading up.
2. When the majority of the meters turn red, it is a sign the market is going down.
- The user has the option to select how many meters must allign for a signal to show
- The indicator also has the ability to setup Alerts when the selected number of meters turn green or red. This feature is also signaled by the red or green vertical lines.
NOTES
This is script is meant to be used as an auxiliary Indicator to confirm your entries, but it is as good on it's own, as you can see in the Backtesting Results
We used the best combination of indicators so you can be sure that, no matter what ticker you're trading (Forex, Stocks or Crypto) - when you get a full green, or full red meter, the price is 100% trending in that direction!
* This indicator does NOT Repaint! None of our published indicators repaint!
PpSignal Double CFBIndicator Version, with alert signal.
//1) Entrada de posicion el primer parametro es que SSMA sea mayor que el precio de apertura (Ema > so1) donde Ema=ssma y so1= al precio de apertura de candle converter
//2) Que el precio de cierre de la vela del time superior representado por candle converter sea mayor a la de apertura sc1>so1
//3) Que bbstop este dando compra Short BB aca le damos entrada a la volatilidad de la desviacion standart.
//4) que cfb este dando compra longCFB aca le damos entrada al la tendecia
// Conclusion, es esta si el precio de cierre de un time superios es > al de apertura (crossover(Ema , so1) y sc1>so1) , pero si y solo si si hay tendecia definida (CFB o longCFBA)
//y volatilidad va en sentido de esa tendecia y acompanando al precio de cierre que sea mayor que el apertura shortb BB nos dara entrada.
