Multiple Standard Moving Averages {CyberNetwork}Multiple standard moving average plots in a single script, with golden cross (GX) and death cross (DX) indicators.
Momentum filters of each MA can be applied to the GX/DX indicators -- i.e. such that the 50 SMA /200 SMA GX will only trigger if the momentum of the 200 SMA is positive, etc.
Note: User can set the triggering criterion, scaled to the % of the respective MA value.
Setting this value to negative allows the triggering of GX when MA momentum is negative (-ve), and vice versa for DX.
Each plots and indicators can be individually enabled/disabled.
This script is base on the following Multiple Moving Averages script: which allows users to set their own preferred MA candle lengths.
Multiple Moving Averages {Cybernetwork}
Crossunder

Fancy Triple Moving Averages [BigBitsIO]This script is for three moving averages with as many features as I can possibly fit into a single moving average.
Features:
- Three moving averages (MA1, MA2, MA3).
- Standard MA inputs.
- MA type.
- MA period.
- MA price.
- MA resolution (time frame).
- Visibility toggle.
- MA Candle Type
- Fancy MA inputs.
- Toggle to show only candles included in the MA calculation ("Highlight inclusion") or display entire MA history.
- Toggle to show a ghost trail when Highlight inclusion is toggled on. Displays a shaded version of past MA history before the inclusion period (as seen on snapshot).
- Toggle to show forecast values for the MA.
- Other inputs related to forecasting:
- Forecast bias. (Neutral forecasts MA if the current price remains the same.)
- Forecast period.
- Forecast magnitude.
*** DISCLAIMER: For educational and entertainment purposes only. Nothing in this content should be interpreted as financial advice or a recommendation to buy or sell any sort of security or investment including all types of crypto. DYOR, TYOB. ***

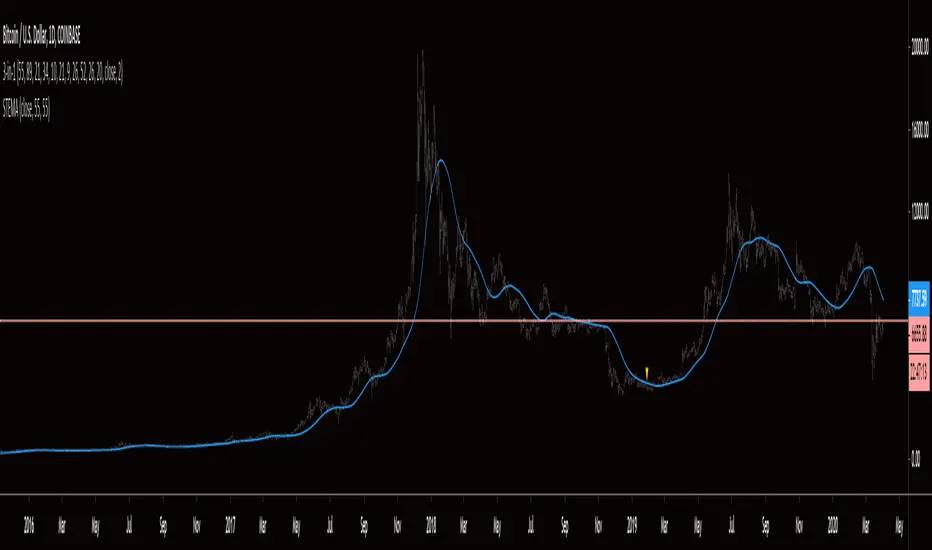
Smoothed Triple EMAThis indicator is exactly as it sounds, a smoothed triple EMA . In my personal use, it is applied to strategies to indicate direction of entries. A simple example would be if price is above the STEMA, look for long entries, if price is below the STEMA, look for short entries. Shortly, I will share a strategy that makes use of this indicator. You are welcome to message me if you have any questions. Thanks for checking it out an may the probabilities be with you!
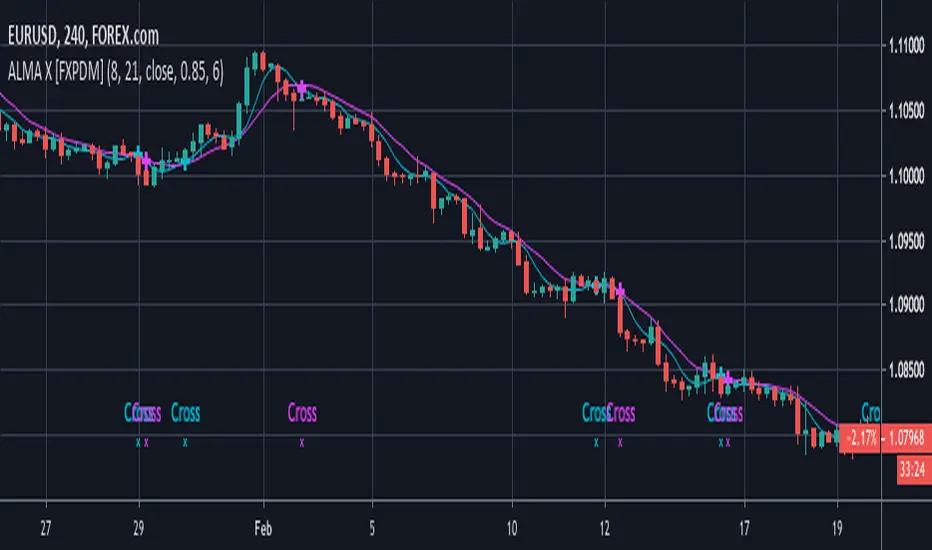
ALMA Crossover [FXPDM]
I created this new version of EMA crossing by replacing it with ALMA, Please take into consideration that the cross signal may occur during the candle. I advise waiting until the candle is close.
I used EMA crossing signals to adapt this code and turn it into an ( Arnaud Legoux Moving Average) ALMA Cross.
I expect it to bring a better signal that an EMA cross, let me know your comments and use under your own risk. this is just an experimental idea.
Long: Get into a long trade when the short moving average crosses up the long moving average.
Short: Get into a short trade when the short moving average crosses down the long moving average.
I recommend using it alongside a volume indicator to avoid sideways trends.
Exit at your own convenience or when the trend direction changes. I recommend using it in 4H and 1D charts.
(JS) Ultimate RSISo my goal here was to combine all of my RSI ideas into a single indicator in order to make kind of a "Swiss Army Knife" version of the Relative Strength Index ...
------------------------------------------------------------------------------------------------------------------------------------------------------------------------------------------------------------------------------------------------------------------
So, let's begin with the first RSI indicator I made, which is the RSIDVW (Divergence/Volume Weighted);
To rephrase my original post, the "divergence/volume weighted" portion is meant to expand upon the current RSI format by adding more variables into the equation.
The standard RSI is based off one value that you select (open, close, OHLC4, HLC3, etc.) while this version takes three variables into account.
The default setting is to have RSI normal without anything added to it (Divergence Weight = 0)
1st - it takes the standard variable that RSI normally uses.
2nd - it factors RSI divergence by taking the RSI change % and price change % to form a ratio. Using this ratio, I duplicated the RSI formula and created a divergence RS to be factored in with the standard price RS .
3rd - it takes Relative Volume and amplifies/weakens the move based upon volume confirmation. (So if Relative Volume for a price bar is 1.0, the RSI plot would be the same as it normally would)
So to explain the parameters
- Relative Volume Length: This uses the RV length you specify to determine spikes in volume (or lack of volume ), which then is added into the formula to influence the strength of the RSI move
- RV x Divergence: This is how I calculated the original formula, but you can leave this unchecked to turn Relative Volume off, or apply elsewhere.
- RV x RS: There's two sides, Divergence RS and Standard RS - these check marks allow you to select which part you prefer to be multiplied by Relative Volume .
Checking neither turns off Relative Volume , while checking both amplifies its effects by placing it on both sides of the equation.
-Divergence Weight: This controls how much the DVW portion of the formula influences the RSI plot. As I referred to earlier, default is 0 making RSI normal. The Scale is 0-2, so 1.0 would be the same as 50%.
When I do have DVW on, I generally set it to 0.5
-SMA Divergence: To smooth, or not to smooth, that is the question. UJsing an SMA here is much smoother in my opinon, but leaving it unchecked runs it through an RMA the same way standard RSI is calculated.
-Show Fractal Channel: This allows you to see the whole fractal channel around the RSI (This portion of the code, compliments of the original Ricardo Santos fractal script)
------------------------------------------------------------------------------------------------------------------------------------------------------------------------------------------------------------------------------------------------------------------
The next portion of the script is adding a "Slow RSI"...
This is rather simple really, it allows you to add a second RSI plot so that you can watch for crossovers between fast and slow lines.
-Slow RSI: This turns on the second RSI Plot.
-Slow RSI Length: This determines the length of the second RSI Plot.
------------------------------------------------------------------------------------------------------------------------------------------------------------------------------------------------------------------------------------------------------------------
Pivot Point RSI was something a friend of mine requested I make which turned out pretty cool, I thought... It is also available in this indicator.
-Pivot Points: Selecting this enables the rest of the pivot point related parts of the script
If Pivot Points isn't selected, none of the following things will work
-Plot Pivot: Plots the pivot point .
-Plot S1/R1: Plots S1/R1.
-Plot S2/R2: Plots S2/R2.
-Plot S3/R3: Plots S3/R3.
-Plot S4/R4: Plots S4/R4.
-Plot S5/R5: Plots S5/R5.
-Plot Halfway Points: Plots a line between each pivot .
-Show Pivot Labels: Shows the proper label for each pivot .
When using intraday charts, from a 15 minute interval or less the pivots are calculated based on a single days worth of price action, above that the distance expands.
Here are the current resolutions Pivot Points will work with:
Minutes - 1 , 2, 3, 5, 10, 13, 15, 20, 30, 39, 78, 130, 195
Hours - 1, 2, 3, 4, 5, 6
Daily
Weekly
Currently not available on seconds or monthly
------------------------------------------------------------------------------------------------------------------------------------------------------------------------------------------------------------------------------------------------------------------
Background Colors
Background Colors: I have six color schemes I created for this which can be toggled here (they can be edited).
Gray Background for Dark Mode: Having this on looks much better when using dark mode on your charts.
------------------------------------------------------------------------------------------------------------------------------------------------------------------------------------------------------------------------------------------------------------------
Now finally the last portion, Fibonacci Levels
-Fibonacci Levels: This is off, by default, which then uses the standard levels on RSI (30-50-70). When turned on, it removes these and marks fib levels from 0.146 through 0.886.
------------------------------------------------------------------------------------------------------------------------------------------------------------------------------------------------------------------------------------------------------------------
So the quick rundown:
Ultimate RSI contains "divergence/volume weighted" modifications, a slow RSI plot, pivot points , and Fibonacci levels all while auto-plotting divergence and having the trend illustrated in the background colors.
RSI has always been my "go to" indicator, so I hope you all enjoy this as much as I do!

MAC-Z VWAP with divs & MACD Leader [ChuckBanger]This script is VWAP version of my MAC-Z indicator:
Right now it is my personal favorite. You can use it to spot divergences in both histogram and on the MAZ-Z line. You can also trade the MAC-Z line and its signal line crossovers. It also has MACD Leader crossover built in. MACD leader crossovers is indicated with a vertical line. Green for bullish and red for bearish.
Other signals
Green + = Bullish Divergence (Strong signal)
Red - = Bearish Divergence (Strong signal)
Green + = Hidden Bullish Divergence (Weak signal)
Red - = Hidden Bearish Divergence (Weak signal)
Green dot = Histgram crosses over zero line (Bullish signal)
Red dot = Histgram crosses below zero line (Bearish signal)

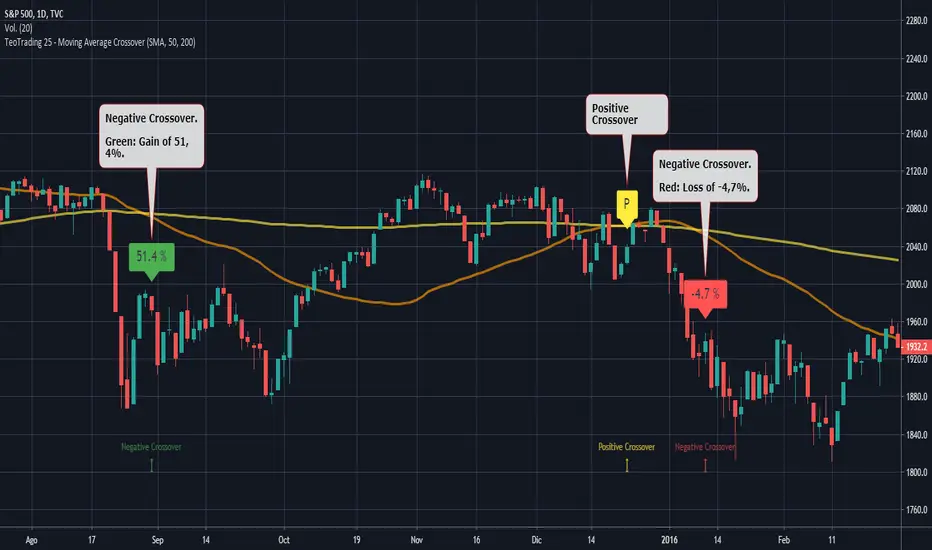
TeoTrading 25 - Moving Average CrossoverThis Script prints different types of moving Average: SMA, EMA, WMA and VWMA.
It is usefull to view in only few minutes differents crossovers.
The crossver´s are indicated with:
Yellow "P": Positive Crossover
Green: Negative Crossover with gain.
Red: Negative Crossover with Loss.
The Percents of gain and loss are indicated in the Negative Crossovers.
Input Parameters:
Type_: Type of Moving Average.
PrintPrice: Enable open value print.
Fast: Fast Moving Average.
Slow: Slow Moving Average.
This indicator does not generate recommendations to buy or to sell. It was designed for educational purposes.
Market Adaptive Stop-LossI realized that the zone changes in the stoploss remained slow, so I couldn't make enough use of the characteristics of technical indicators when opening positions.
This pushed me to keep stop-loss under the influence of a dependent variable.
This script helped me a lot (everget) :
I've redesigned the stop-loss to be affected by intersections.
Therefore, this script is also suitable for adaptive moving averages, fractional periods.
Script features:
1.You can select calculation methods created by using various technical analysis methods from the scripts' settings:
-Moving Average Convergence Divergence ( Macd )
-Stochastic Oscillator ( Stoch )
-Stochastic Relative Strength Index (StochRSI)
-Stochastic Money Flow Index (StochMFI ) (More info : )
-Know Sure Thing ( KST )
-OBV ( On Balance Volume )
-SMA ( Simple Moving Average )
-EMA ( Exponential Moving Average )
-FISHERTRANSFORM ( Fisher Transform )
-AWESOMEOSCILLATOR( Awesome Oscillator )
-PSAR ( Parabolic Stop and Reverse - Parabolic SAR )
-HULLMA( Hull Moving Average )
-VWMA ( Volume Weighted Moving Average )
-RMA (Moving Average using in Relative Strength Index calculations.)
-COG (Center of Gravity )
-ACC-DIST ( Accumulation / Distribution Index )
2 - The region is determined according to the above calculation methods and if it is larger or smaller than the previous stop loss level.
And if the price in the negative zone is lower than the stoploss, it is the exact signal and is shown with more highlighted colors.
And, in the positive zone, where the price is greater than the stoploss, the trade zones are certain.
Shown with more highlighted colors.
If the zones are correct but stop-loss is not suitable for opening positions:
In other words, if the stop-loss is above/under the highest-lowest levels in the positive zone or if the stop loss is located in the lower zone in the negative zone, these zones are shown to be darker and dimmed so that they do not cause false movements.
*** SUMMARY : As a result, you can use this script with support and resistances,and trend lines to get good results.
I hope it helps in your analyzes. Best regards.

MAC-Z & MACD Leader signal [ChuckBanger]This is a combination of my MACD Leader script and MAC-Z with option to add Laguerre filter. The advantage of the MAC-Z over MACD is that it is a more accurate and “assumption-free” indicator that can more accurately describe how a market actually perform. But you can use this as a regular MACD indicator.
Crossovers signals
The MAC-Z line and signal line can be utilized in the same way as a stochastic oscillator, with the crossover between the two lines providing buy and sell signals. As with most crossover strategies, a buy signal comes when the shorter-term, more reactive line – in this case the MAC-Z line (blue line) crosses above the slower signal line (orange line). For example, when the MAC-Z line crosses below the signal line it provides a bearish sell signal.
Zero line crossing
The zero cross strategy is based on either of the lines crossing the zero line. If the MAC-Z crosses the zero line from below, it is a signal for a possible new uptrend, while the MAC-Z crossing from above is a signal that a new downtrend may be starting. This is special powerful if the lines has a fast up or down movement but the price action doesn't reflect that movement.
Divergences
Bearish and bullish divergences is my favorite signals. When price action and oscillators follow the same path it is called Convergences, when they don’t, it’s called a Divergence. Don't confuse the two because they have not the same meaning. But be aware that for example during consolidation or low liquidity, some small divergences between price and indicators might form, but that doesn't mean we should consider them as real divergences.
There is many different types of divergences. It is easier to show a picture then explaining it so I recommend you to check out the link below. Especially the top image. It sums this up very well
medium.com
MACD Leader
The MACD leader is only showing the crossing of MACD as a vertical line
Green vertical line = MACD Leader Bullish Cross
Red vertical line = MACD Leader Bearish Cross
MACD Leader:
MAC-Z:
More Information
cssanalytics.wordpress.com
en.wikipedia.org
drive.google.com

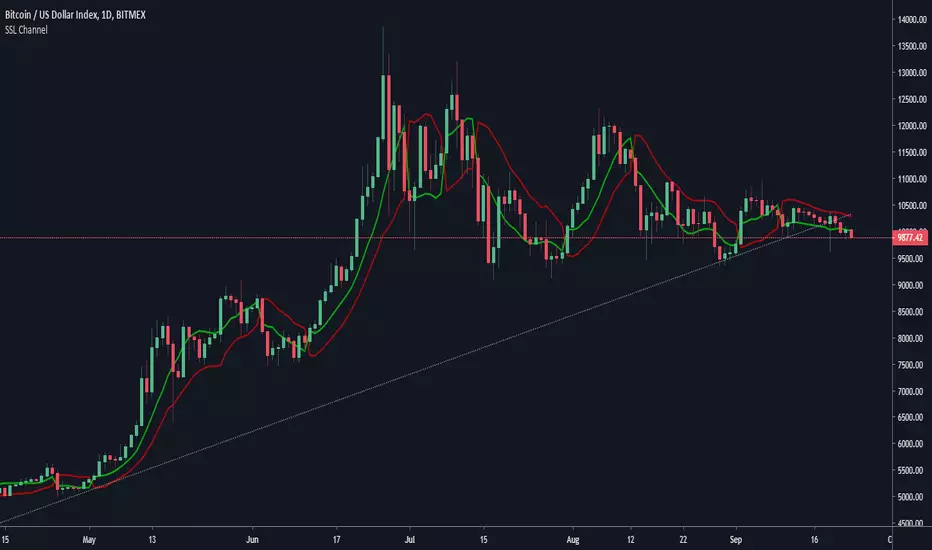
SSL Channel w/alertSSL Channel with cross alert when channels cross up or down. Built on ErwinBeckers SSL Channel script.
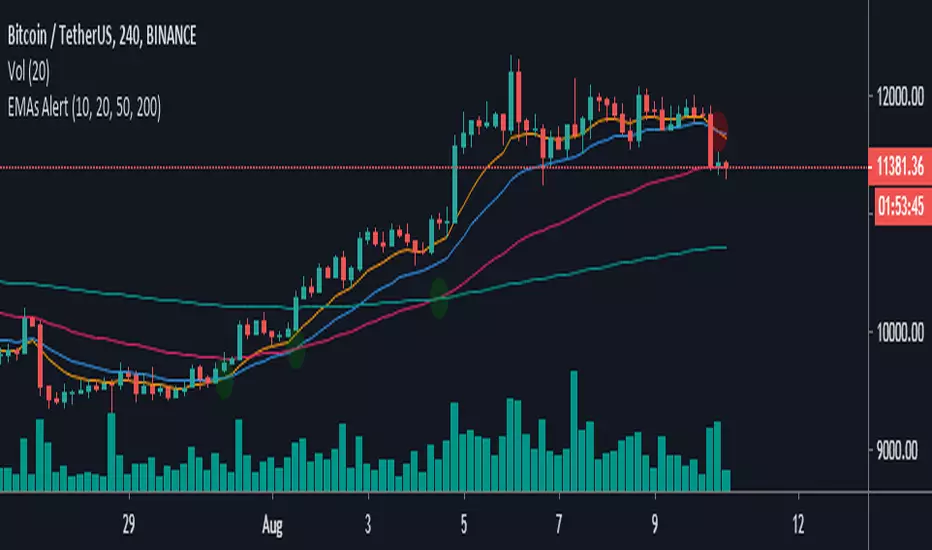
EMAs Alert-This script allows you to show the crossings of the most important emas such as 10, 20, 50 and 200
-You can modify the values of each ema you like
-Bring alerts of the crosses of each ema, which will allow you to activate this function to only the assets you want to track
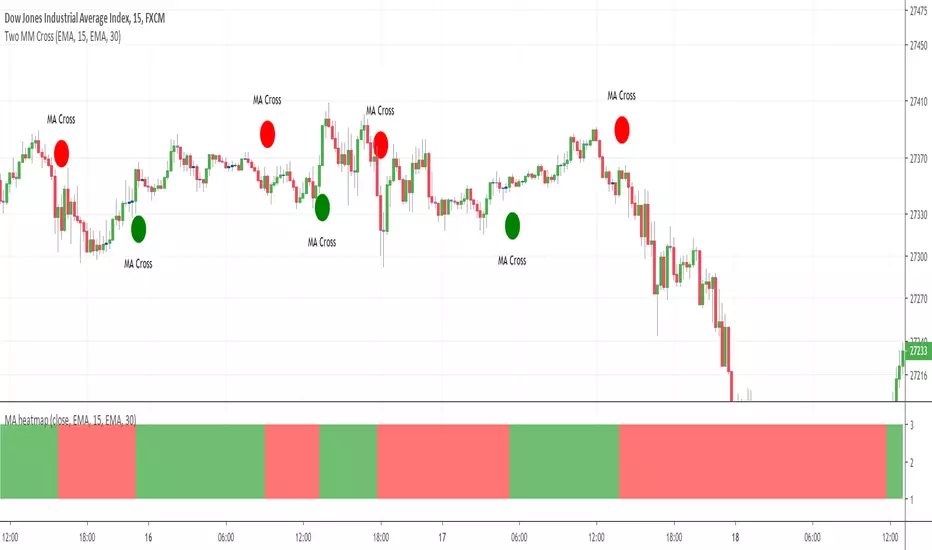
Triple Moving Average HeatmapHi everyone
I didn't publish on Friday because I was working on an Expert Advisor in MT4. The day I don't publish, some scripts spamming guys published many (not useful) scripts the same to kick me out of the TOP #1 ranking.
So what I'm going to do about it? crying or sharing more quality scripts than before? :)
I guess you know the answer :) I'm gonna share a few quality scripts that I have in my library. I noticed that you guys tend to like more the scripts useful for your trading actually making you money rather than a copy-paste (of another copy-paste)
Alright, enough for the trolling now let's introduce the Three MA heatmap which is an upgrade of that script : MA-heatmap-Double-cross-edition/
The challenge was to keep the heatmap not rolling and to make it match with the MA cross. I did it using this
```
since_ma_buy = barssince(macrossover)
since_ma_sell = barssince(macrossunder)
heatmap_color() =>
since_ma_buy < since_ma_sell ? color.new(color.green, 20) : since_ma_buy > since_ma_sell ? color.new(color.red, 20) : na
```
This is a technique that I found after drinking three glasses of red wine (#french) to keep the heatmap stable and not rolling.
To get what I'm saying I invite you to replace the piece of code above by what everyone would normally do
```
heatmap_color() =>
macrossunder() ? color.new(color.green, 20) : macrossover() ? color.new(color.red, 20) : na
```
Ah and I'm not done sharing for the day, a few scripts are coming also after that one and tonight !!!!! I want to live in a world where you guys can enjoy quality scripts (mostly) :)
PS
____________________________________________________________
Feel free to hit the thumbs up as it shows me that I'm not doing this for nothing and will motivate to deliver more quality content in the future.
- I'm an officially approved PineEditor/LUA/MT4 approved mentor on codementor. You can request a coaching with me if you want and I'll teach you how to build kick-ass indicators and strategies
Jump on a 1 to 1 coaching with me
- You can also hire for a custom dev of your indicator/strategy/bot/chrome extension/python

MA heatmap (Double cross edition)Hello my friends
Sorry yesterday I couldn't post an indicator because I was travelling. So here's the today indicator inspired from that one Moving-Average-Heatmap-Visualization/
This will gives an interesting representation of a Double Moving Average cross
That's all for me
Let's resume the free indicators publishing next Monday with the MA heatmap (Triple cross edition) and then the 4 cross ... until the 100 cross edition .... "wait are you joking sir ?"... Totally YES :)
But the Triple cross edition will be released as it's interesting from a Pine script perspective
Enjoy your weekend and stay safe
Dave
Four MM crossHello traders
Some friends asked me to do it so... sharing it for everyone instead
This indicator detects when the first moving average is above the three others. It's a very powerful tool for trend traders that use multiple moving averages to detect a strong trend
Enjoy
Dave

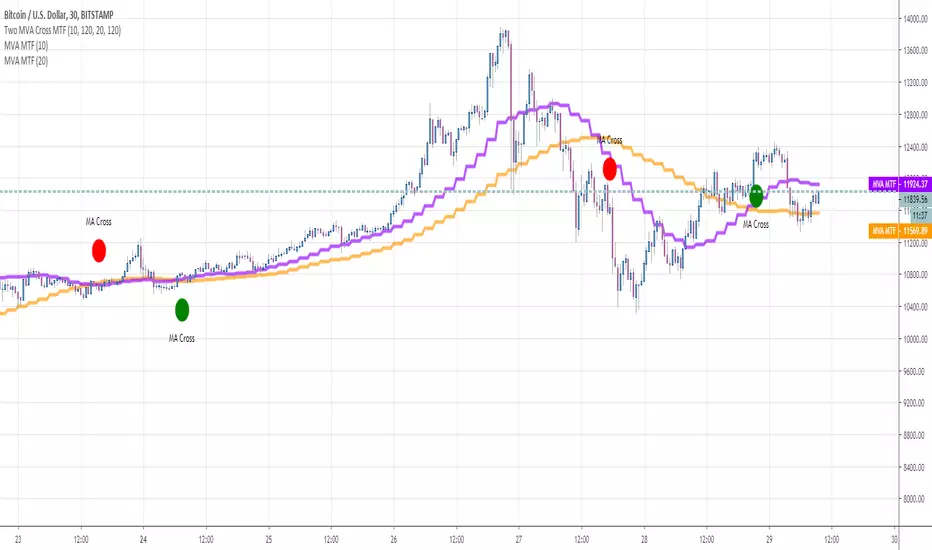
Two MVA Cross MTFHello traders
This is a script to apply the crossover/crossunder of moving average multi-timeframes on a different timeframe chart
In this example, we see two moving averages in the 2H timeframe being detected on a m30 chart
Enjoy
Dave
Two MM CrossHello Traders
This is a script to detect the crossover/crossunder of two moving averages
It's generic as all standard moving averages are accepted and can be crossed between each other
Enjoy
Dave

24/9 EMA with Bias & SignalsThis is a simple indicator that plots the 24 & 9 EMAs.
It also highlights the potential bias of the market (bull or bear) based on if the 9 EMA is above or below the 24 EMA.
In addition there are signal crosses that you can use for alerts.
This indicator is best used to confirm a particular underlying bias on the 5m, 15M, 1HR, 4HR, and Daily timeframes.
It's important to note on lower timeframes that the bias can be counter trend bias of the overall larger momentum of the instrument you are trading.
For clarity this means that many retraces get going when the 9 crosses the 24. But ultimately the larger timeframe bias will continue after this counter trend retraces.
Combining this indicator with value channels and ATR is what I recommend.


Simple Moving Average from Justin DartHi All,
This is my 1st script, what I want it to do is cut down on some of the SMA on my chart...
At the same time figure out , how to make a buy call that makes sense ( I Need work on it )...
I'm open to your input and your help...
Thanks...
Justin
RPS Moving Average CrossThis indicator is a powerful SMA and EMA Cross tool, that gives the trader better perception on the trend and gives potential BUY (UP arrow) and SELL (DOWN arrow) signals.
Highly configurable and gives deep customization, valuing individual preferences.
How to trade using this tool:
Buy @ Bullish 5 X 8 and Sell @ Bearish 5 X 8 (Suitable for Intra-Day Traders)
Buy @ Bullish 10 X 21 and Sell @ Bearish 10 X 21 (Suitable for Day Traders)
Buy @ Bullish 21 X 50 and Sell @ Bearish 21 X 50 (Suitable for Swing Traders)
Buy @ Bullish 50 X 200 and Sell @ Bearish 50 X 200 (Suitable for Investors)
Hit Like, if you find any value in this tool.
Share your trading experience using this tool in the comments section.
Thank you!
~RPS~

Repulsion Moving Average - Least Crosses MAA Moving Average With Less Whipsaws Signals
The cross of the price with a moving average is one of the easiest strategy in technical analysis and could have worked if market price wasn't so noisy (In general periods of 1 to 20 produces the most whipsaws) . So it is possible to create a moving average who can manage to escape those noisy periods and produce 0 whipsaws ?
This question was asked by one of my work colleagues and i responded : "well... almost 0".
The Motion Of A Moving Average
Moving Average estimate the Trend and will always have phase shift, they will still follow the price and cross it during high volatility or low volatility periods, and when a moving average cross the price during a low volatility period you can expect lot of crosses.
In order to fix this behaviour a simple calculation exist :
FixMa = LongPeriodMA + MediumPeriodMA - ShortPeriodMA
We can see things in that way, the medium term MA is high pass filtered (subtracted) with a short term MA and the result is summed to a long term MA. We give more reactivity to our long term MA and thus creating some kind of repulsion motion with the price. Of course this can sometimes make the filter kinda zero-lag to some price periods (when the long term MA is near the price) .
Comparison
In red a simple moving average of period 100 and in blue our repulsion moving average :
In the image the short term moving average period is 100, since the long term period of the moving average is equal to short term x 3 you could be interested to look at the comparison of our moving average with the actual long term moving average :
Less crosses, i think you can see it.
Something to notice is that its always a tradeoff between Signal Speed and Signal Numbers , a classic moving average create faster signals but also a high numbers of them, a classic trailing stop create less signals but slowest ones, our moving average is some kind of average between those indicators.
Improvement Methods - Choice of The Filter/More Terms
A bad behaviour of our filter can be fixed by using filters who tend to create less crosses with the price or by developing the formula of our filter by adding more terms as follow :
fixma = ma(Price,a) + ma(Price,b) + ma(Price,c) - ma(Price,d) - ma(Price,e)
where a > b > c > d > e . The number of subtractive terms is equal to the number of summing terms - 1.
Way To Use
This indicator can be used like any moving average with cross strategy. Can also be used as a trailing stop.
No tests have been made proving that this indicator provide support and resistance levels, such signals come from more centered indicators.
Hope you enjoy
For any questions/demands feel free to pm me, i would be happy to help you :)
