Smarter Money Volume Rejection Blocks [PhenLabs]📊 Smarter Money Volume Rejection Blocks – Institutional Rejection Zone Detection
The Smarter Money Volume Rejection Blocks indicator combines high-volume analysis with statistical confidence intervals to identify where institutional traders are actively defending price levels through volume spikes and rejection patterns.
🔥 Core Methodology
Volume Spike Detection analyzes when current volume exceeds moving average by configurable multipliers (1.0-5.0x) to identify institutional activity
Rejection Candle Analysis uses dual-ratio system measuring wick percentage (30-90%) and maximum body ratio (10-60%) to confirm genuine rejections
Statistical Confidence Channels create three-level zones (upper, center, lower) based on ATR or Standard Deviation calculations
Smart Invalidation Logic automatically clears zones when price significantly breaches confidence levels to maintain relevance
Dynamic Channel Projection extends confidence intervals forward up to 200 bars with customizable length
Support Zone Identification detects bullish rejections where smart money absorbs selling pressure with high volume and strong lower wicks
Resistance Zone Mapping identifies bearish rejections where institutions defend price levels with volume spikes and pronounced upper wicks
Visual Information Dashboard displays real-time status table showing volume spike conditions and active support/resistance zones
⚙️ Technical Configuration
Dual Confidence Interval Methods: Choose between ATR-Based for trend-following environments or StdDev-Based for range-bound statistical precision
Volume Moving Average: Configurable period (default 20) for baseline volume comparison calculations
Volume Spike Multiplier: Adjustable threshold from 1.0 to 5.0 times average volume to filter institutional activity
Rejection Wick Percentage: Set minimum wick size from 30% to 90% of candle range for valid rejection detection
Maximum Body Ratio: Configure body-to-range ratio from 10% to 60% to ensure genuine rejection structures
Confidence Multiplier: Statistical multiplier (default 1.96) for 95% confidence interval calculations
Channel Projection Length: Extend confidence zones forward from 10 to 200 bars for anticipatory analysis
ATR Period: Customize Average True Range lookback from 5 to 50 bars for volatility-based calculations
StdDev Period: Adjust Standard Deviation period from 10 to 100 bars for statistical precision
🎯 Real-World Trading Applications
Identify high-probability support zones where institutional buyers have historically defended price with significant volume
Map resistance levels where smart money sellers consistently reject higher prices with volume confirmation
Combine with price action analysis to confirm breakout validity when price approaches confidence channel boundaries
Use invalidation signals to exit positions when smart money zones are definitively breached
Monitor the real-time dashboard to quickly assess current market structure and active rejection zones
Adapt strategy based on calculation method: ATR for trending markets, StdDev for ranging conditions
Set alerts on confidence level breaches to catch potential trend reversals or continuation patterns
📈 Visual Interpretation Guide
Green Zones indicate bullish rejection blocks where buyers defended with high volume and lower wicks
Red Zones indicate bearish rejection blocks where sellers defended with high volume and upper wicks
Solid Center Lines represent the core rejection price level where maximum volume activity occurred
Dashed Confidence Boundaries show upper and lower statistical limits based on volatility calculations
Zone Opacity decreases as channels extend forward to indicate decreasing confidence over time
Dashboard Color Coding provides instant visual feedback on active volume spike and zone conditions
⚠️ Important Considerations
Volume-based indicators identify historical rejection zones but cannot predict future price action with certainty
Market conditions change rapidly and institutional activity patterns evolve continuously
High volume does not guarantee level defense as market structure can shift without warning
Confidence intervals represent statistical probabilities, not guaranteed price boundaries
Confidence

SMC - Institutional Confidence Oscillator [PhenLabs]📊 Institutional Confidence Oscillator
Version: PineScript™v6
📌 Description
The Institutional Confidence Oscillator (ICO) revolutionizes market analysis by automatically detecting and evaluating institutional activity at key support and resistance levels using our own in-house detection system. This sophisticated indicator combines volume analysis, volatility measurements, and mathematical confidence algorithms to provide real-time readings of institutional sentiment and zone strength.
Using our advanced thin liquidity detection, the ICO identifies high-volume, narrow-range bars that signal institutional zone formation, then tracks how these zones perform under market pressure. The result is a dual-wave confidence oscillator that shows traders when institutions are actively defending price levels versus when they’re abandoning positions.
The indicator transforms complex institutional behavior patterns into clear, actionable confidence percentiles, helping traders align with smart money movements and avoid common retail trading pitfalls.
🚀 Points of Innovation
Automated thin liquidity zone detection using volume threshold multipliers and zone size filtering
Dual-sided confidence tracking for both support and resistance levels simultaneously
Sigmoid function processing for enhanced mathematical accuracy in confidence calculations
Real-time institutional defense pattern analysis through complete test cycles
Advanced visual smoothing options with multiple algorithmic methods (EMA, SMA, WMA, ALMA)
Integrated momentum indicators and gradient visualization for enhanced signal clarity
🔧 Core Components
Volume Threshold System: Analyzes volume ratios against baseline averages to identify institutional activity spikes
Zone Detection Algorithm: Automatically identifies thin liquidity zones based on customizable volume and size parameters
Confidence Lifecycle Engine: Tracks institutional defense patterns through complete observation windows
Mathematical Processing Core: Uses sigmoid functions to convert raw market data into normalized confidence percentiles
Visual Enhancement Suite: Provides multiple smoothing methods and customizable display options for optimal chart interpretation
🔥 Key Features
Auto-Detection Technology: Automatically scans for institutional zones without manual intervention, saving analysis time
Dual Confidence Tracking: Simultaneously monitors both support and resistance institutional activity for comprehensive market view
Smart Zone Validation: Evaluates zone strength through volume analysis, adverse excursion measurement, and defense success rates
Customizable Parameters: Extensive input options for volume thresholds, observation windows, and visual preferences
Real-Time Updates: Continuously processes market data to provide current institutional confidence readings
Enhanced Visualization: Features gradient fills, momentum indicators, and information panels for clear signal interpretation
🎨 Visualization
Dual Oscillator Lines: Support confidence (cyan) and resistance confidence (red) plotted as percentage values 0-100%
Gradient Fill Areas: Color-coded regions showing confidence dominance and strength levels
Reference Grid Lines: Horizontal markers at 25%, 50%, and 75% levels for easy interpretation
Information Panel: Real-time display of current confidence percentiles with color-coded dominance indicators
Momentum Indicators: Rate of change visualization for confidence trends
Background Highlights: Extreme confidence level alerts when readings exceed 80%
📖 Usage Guidelines
Auto-Detection Settings
Use Auto-Detection
Default: true
Description: Enables automatic thin liquidity zone identification based on volume and size criteria
Volume Threshold Multiplier
Default: 6.0, Range: 1.0+
Description: Controls sensitivity of volume spike detection for zone identification, higher values require more significant volume increases
Volume MA Length
Default: 15, Range: 1+
Description: Period for volume moving average baseline calculation, affects volume spike sensitivity
Max Zone Height %
Default: 0.5%, Range: 0.05%+
Description: Filters out wide price bars, keeping only thin liquidity zones as percentage of current price
Confidence Logic Settings
Test Observation Window
Default: 20 bars, Range: 2+
Description: Number of bars to monitor zone tests for confidence calculation, longer windows provide more stable readings
Clean Break Threshold
Default: 1.5 ATR, Range: 0.1+
Description: ATR multiple required for zone invalidation, higher values make zones more persistent
Visual Settings
Smoothing Method
Default: EMA, Options: SMA/EMA/WMA/ALMA
Description: Algorithm for signal smoothing, EMA responds faster while SMA provides more stability
Smoothing Length
Default: 5, Range: 1-50
Description: Period for smoothing calculation, higher values create smoother lines with more lag
✅ Best Use Cases
Trending market analysis where institutional zones provide reliable support/resistance levels
Breakout confirmation by validating zone strength before position entry
Divergence analysis when confidence shifts between support and resistance levels
Risk management through identification of high-confidence institutional backing
Market structure analysis for understanding institutional sentiment changes
⚠️ Limitations
Performs best in liquid markets with clear institutional participation
May produce false signals during low-volume or holiday trading periods
Requires sufficient price history for accurate confidence calculations
Confidence readings can fluctuate rapidly during high-impact news events
Manual fallback zones may not reflect actual institutional activity
💡 What Makes This Unique
Automated Detection: First Pine Script indicator to automatically identify thin liquidity zones using sophisticated volume analysis
Dual-Sided Analysis: Simultaneously tracks institutional confidence for both support and resistance levels
Mathematical Precision: Uses sigmoid functions for enhanced accuracy in confidence percentage calculations
Real-Time Processing: Continuously evaluates institutional defense patterns as market conditions change
Visual Innovation: Advanced smoothing options and gradient visualization for superior chart clarity
🔬 How It Works
1. Zone Identification Process:
Scans for high-volume bars that exceed the volume threshold multiplier
Filters bars by maximum zone height percentage to identify thin liquidity conditions
Stores qualified zones with proximity threshold filtering for relevance
2. Confidence Calculation Process:
Monitors price interaction with identified zones during observation windows
Measures volume ratios and adverse excursions during zone tests
Applies sigmoid function processing to normalize raw data into confidence percentiles
3. Real-Time Analysis Process:
Continuously updates confidence readings as new market data becomes available
Tracks institutional defense success rates and zone validation patterns
Provides visual and numerical feedback through the oscillator display
💡 Note:
The ICO works best when combined with traditional technical analysis and proper risk management. Higher confidence readings indicate stronger institutional backing but should be confirmed with price action and volume analysis. Consider using multiple timeframes for comprehensive market structure understanding.

Volume Footprint Anomaly Scanner [PhenLabs]📊 PhenLabs - Volume Footprint Anomaly Scanner (VFAS)
Version: PineScript™ v6
📌 Description
The PhenLabs Volume Footprint Anomaly Scanner (VFAS) is an advanced Pine Script indicator designed to detect and highlight significant imbalances in buying and selling pressure within individual price bars. By analyzing a calculated "Delta" – the net difference between estimated buy and sell volume – and employing statistical Z-score analysis, VFAS pinpoints moments when buying or selling activity becomes unusually dominant. This script was created not in hopes of creating a "Buy and Sell" indicator but rather providing the user with a more in-depth insight into the intrabar volume delta and how it can fluctuate in unusual ways, leading to anomalies that can be capitalized on.
This indicator helps traders identify high-conviction points where strong market participants are active, signaling potential shifts in momentum or continuation of a trend. It aims to provide a clearer understanding of underlying market dynamics, allowing for more informed decision-making in various trading strategies, from identifying entry points to confirming trend strength.
🚀 Points of Innovation
● Z-Score for Delta Analysis : Utilizes statistical Z-scores to objectively identify statistically significant anomalies in buying/selling pressure, moving beyond simple, arbitrary thresholds.
● Dynamic Confidence Scoring : Assigns a multi-star confidence rating (1-4 stars) to each signal, factoring in high volume, trend alignment, and specific confirmation criteria, providing a nuanced view of signal strength.
● Integrated Trend Filtering : Offers an optional Exponential Moving Average (EMA)-based trend filter to ensure signals align with the broader market direction, reducing false positives in ranging markets.
● Strict Confirmation Logic : Implements specific confirmation criteria for higher-confidence signals, including price action and a time-based gap from previous signals, enhancing reliability.
● Intuitive Info Dashboard : Provides a real-time summary of market trend and the latest signal's direction and confidence directly on the chart, streamlining information access.
🔧 Core Components
● Core Delta Engine : Estimates the net buying/selling pressure (bar Delta) by analyzing price movement within each bar relative to volume. It also calculates average volume to identify bars with unusually high activity.
● Anomaly Detection (Z-Score) : Computes the Z-score for the current bar's Delta, indicating how many standard deviations it is from its recent average. This statistical measure is central to identifying significant anomalies.
● Trend Filter : Utilizes a dual Exponential Moving Average (EMA) cross-over system to define the prevailing market trend (uptrend, downtrend, or range), providing contextual awareness.
● Signal Processing & Confidence Algorithm : Evaluates anomaly conditions against trend filters and confirmation rules, then calculates a dynamic confidence score to produce actionable, contextualized signal information.
🔥 Key Features
● Advanced Delta Anomaly Detection : Pinpoints bars with exceptionally high buying or selling pressure, indicating potential institutional activity or strong market conviction.
● Multi-Factor Confidence Scoring : Each signal comes with a 1-4 star rating, clearly communicating its reliability based on high volume, trend alignment, and specific confirmation criteria.
● Optional Trend Alignment : Users can choose to filter signals, so only those aligned with the prevailing EMA-defined trend are displayed, enhancing signal quality.
● Interactive Signal Labels : Displays compact labels on the chart at anomaly points, offering detailed tooltips upon hover, including signal type, direction, confidence, and contextual information.
● Customizable Bar Colors : Visually highlights bars with Delta anomalies, providing an immediate visual cue for strong buying or selling activity.
● Real-time Info Dashboard : A clean, customizable dashboard shows the current market trend and details of the latest detected signal, keeping key information accessible at a glance.
● Configurable Alerts : Set up alerts for bullish or bearish Delta anomalies to receive real-time notifications when significant market pressure shifts occur.
🎨 Visualization
Signal Labels :
* Placed at the top/bottom of anomaly bars, showing a "📈" (bullish) or "📉" (bearish) icon.
* Tooltip: Hovering over a label reveals detailed information: Signal Type (e.g., "Delta Anomaly"), Direction, Confidence (e.g., "★★★☆"), and a descriptive explanation of the anomaly.
* Interpretation: Clearly marks actionable signals and provides deep insights without cluttering the chart, enabling quick assessment of signal strength and context.
● Info Dashboard :
* Located at the top-right of the chart, providing a clean summary.
* Displays: "PhenLabs - VFAS" header, "Market Trend" (Uptrend/Downtrend/Range with color-coded status), and "Direction | Conf." (showing the last signal's direction and star confidence).
* Optional "💡 Hover over signals for details" reminder.
* Interpretation: A concise, real-time summary of the market's pulse and the most recent high-conviction event, helping traders stay informed at a glance.
📖 Usage Guidelines
Setting Categories
⚙️ Core Delta & Volume Engine
● Minimum Volume Lookback (Bars)
○ Default: 9
○ Range: Integer (e.g., 5-50)
○ Description: Defines the number of preceding bars used to calculate the average volume and delta. Bars with volume below this average won't be considered for high-volume signals. A shorter lookback is more reactive to recent changes, while a longer one provides a smoother average.
📈 Anomaly Detection Settings
Delta Z-Score Anomaly Threshold
○ Default: 2.5
○ Range: Float (e.g., 1.0-5.0+)
○ Description: The number of standard deviations from the mean that a bar's delta must exceed to be considered a significant anomaly. A higher threshold means fewer, but potentially stronger, signals. A lower threshold will generate more signals, which might include less significant events. Experiment to find the optimal balance for your trading style.
🔬 Context Filters
Enable Trend Filter
○ Default: False
○ Range: Boolean (True/False)
○ Description: When enabled, signals will only be generated if they align with the current market trend as determined by the EMAs (e.g., only bullish signals in an uptrend, bearish in a downtrend). This helps to filter out counter-trend noise.
● Trend EMA Fast
○ Default: 50
○ Range: Integer (e.g., 10-100)
○ Description: The period for the faster Exponential Moving Average used in the trend filter. In combination with the slow EMA, it defines the trend direction.
● Trend EMA Slow
○ Default: 200
○ Range: Integer (e.g., 100-400)
○ Description: The period for the slower Exponential Moving Average used in the trend filter. The relationship between the fast and slow EMA determines if the market is in an uptrend (fast > slow) or downtrend (fast < slow).
🎨 Visual & UI Settings
● Show Info Dashboard
○ Default: True
○ Range: Boolean (True/False)
○ Description: Toggles the visibility of the dashboard on the chart, which provides a summary of market trend and the last detected signal.
● Show Dashboard Tooltip
○ Default: True
○ Range: Boolean (True/False)
○ Description: Toggles a reminder message in the dashboard to hover over signal labels for more detailed information.
● Show Delta Anomaly Bar Colors
○ Default: True
○ Range: Boolean (True/False)
○ Description: Enables or disables the coloring of bars based on their delta direction and whether they represent a significant anomaly.
● Show Signal Labels
○ Default: True
○ Range: Boolean (True/False)
○ Description: Controls the visibility of the “📈” or “📉” labels that appear on the chart when a delta anomaly signal is generated.
🔔 Alert Settings
Alert on Delta Anomaly
○ Default: True
○ Range: Boolean (True/False)
○ Description: When enabled, this setting allows you to set up alerts in TradingView that will trigger whenever a new bullish or bearish delta anomaly is detected.
✅ Best Use Cases
Early Trend Reversal / Continuation Detection: Identify strong surges of buying/selling pressure at key support/resistance levels that could indicate a reversal or the continuation of a strong move.
● Confirmation of Breakouts: Use high-confidence delta anomalies to confirm the validity of price breakouts, indicating strong conviction behind the move.
● Entry and Exit Points: Pinpoint precise entry opportunities when anomalies align with your trading strategy, or identify potential exhaustion signals for exiting trades.
● Scalping and Day Trading: The indicator’s sensitivity to intraday buying/selling imbalances makes it highly effective for short-term trading strategies.
● Market Sentiment Analysis: Gain a real-time understanding of underlying market sentiment by observing the prevalence and strength of bullish vs. bearish anomalies.
⚠️ Limitations
Estimated Delta: The script uses a simplified method to estimate delta based on bar close relative to its range, not actual order book or footprint data. While effective, it’s an approximation.
● Sensitivity to Z-Score Threshold: The effectiveness heavily relies on the `Delta Z-Score Anomaly Threshold`. Too low, and you’ll get many false positives; too high, and you might miss valid signals.
● Confirmation Criteria: The 4-star confidence level’s “confirmation” relies on specific subsequent bar conditions and previous confirmed signals, which might be too strict or specific for all contexts.
● Requires Context: While powerful, VFAS is best used in conjunction with other technical analysis tools and price action to form a comprehensive trading strategy. It is not a standalone “buy/sell” signal.
💡 What Makes This Unique
Statistical Rigor: The application of Z-score analysis to bar delta provides an objective, statistically-driven way to identify true anomalies, moving beyond arbitrary thresholds.
● Multi-Factor Confidence Scoring: The unique 1-4 star confidence system integrates multiple market dynamics (volume, trend alignment, specific follow-through) into a single, easy-to-interpret rating.
● User-Friendly Design: From the intuitive dashboard to the detailed signal tooltips, the indicator prioritizes clear and accessible information for traders of all experience levels.
🔬 How It Works
1. Bar Delta Calculation:
● The script first estimates the “buy volume” and “sell volume” for each bar. This is done by assuming that volume proportional to the distance from the low to the close represents buying, and volume proportional to the distance from the high to the close represents selling.
● How this contributes: This provides a proxy for the net buying or selling pressure (delta) within that specific price bar, even without access to actual footprint data.
2. Volume & Delta Z-Score Analysis:
● The average volume over a user-defined lookback period is calculated. Bars with volume less than twice this average are generally considered of lower interest.
● The Z-score for the calculated bar delta is computed. The Z-score measures how many standard deviations the current bar’s delta is from its average delta over the `Minimum Volume Lookback` period.
● How this contributes: A high positive Z-score indicates a bullish delta anomaly (significantly more buying than usual), while a high negative Z-score indicates a bearish delta anomaly (significantly more selling than usual). This identifies statistically unusual levels of pressure.
3. Trend Filtering (Optional):
● Two Exponential Moving Averages (Fast and Slow EMA) are used to determine the prevailing market trend. An uptrend is identified when the Fast EMA is above the Slow EMA, and a downtrend when the Fast EMA is below the Slow EMA.
● How this contributes: If enabled, the indicator will only display bullish delta anomalies during an uptrend and bearish delta anomalies during a downtrend, helping to confirm signals within the broader market context and avoid counter-trend signals.
4. Signal Generation & Confidence Scoring:
● When a delta Z-score exceeds the user-defined anomaly threshold, a signal is generated.
● This signal is then passed through a multi-factor confidence algorithm (`f_calculateConfidence`). It awards stars based on: high volume presence, alignment with the overall trend (if enabled), and a fourth star for very strong Z-scores (above 3.0) combined with specific follow-through candle patterns after a cooling-off period from a previous confirmed signal.
● How this contributes: Provides a qualitative rating (1-4 stars) for each anomaly, allowing traders to quickly assess the potential significance and reliability of the signal.
💡 Note:
The PhenLabs Volume Footprint Anomaly Scanner is a powerful analytical tool, but it’s crucial to understand that no indicator guarantees profit. Always backtest and forward-test the indicator settings on your chosen assets and timeframes. Consider integrating VFAS with your existing trading strategy, using its signals as confirmation for entries, exits, or trend bias. The Z-score threshold is highly customizable; lower values will yield more signals (including potential noise), while higher values will provide fewer but potentially higher-conviction signals. Adjust this parameter based on market volatility and your risk tolerance. Remember to combine statistical insights from VFAS with price action, support/resistance levels, and your overall market outlook for optimal results.

SAFE Leverage Pro x50Safe Leverage Pro x50 — Safe leverage based on timeframes
Description:
Safe Leverage Pro x50 is an indicator designed to help traders choose prudent and realistic leverage, tailored to the timeframe being traded and the asset chosen.
Based on rigorous statistical research, this indicator provides a visual recommendation of the maximum typical leverage by timeframe and automatically suggests a more conservative value (by default, half) for trading with greater peace of mind and risk control.
* The goal is not for the indicator to make decisions for you, but rather to support your pre-defined entry strategies, allowing you to clearly understand how much leverage you can use without compromising your account against normal price fluctuations.
*The indicator does not calculate based on real-time volatility or ATR, but rather relies on statistical historical patterns obtained by analyzing price behavior after entry, differentiating between average movements in long and short entries by timeframe.
Important: Before following the recommendations of this indicator, check the maximum leverage your broker or exchange allows for the asset you are trading, as it can vary significantly between platforms.
* Philosophy behind the indicator:
This project arises as a response to the simplistic discourse that condemns leverage without distinguishing nuances.
Leverage is not intrinsically bad. What is dangerous is leveraging without method, without awareness, and without risk management.
Safe Leverage Pro x50 is designed to change that narrative:
** It's not about whether or not to use leverage, but when, how much, and how to use it intelligently.

TrendMasterPro_FekonomiTrend Change and Start Signals with Weighted Conditions
The Trend Change and Start Signals with Weighted Conditions indicator leverages various technical analysis tools to generate reliable buy and sell signals. This indicator helps investors more accurately identify trend changes and start signals in the market.
Features:
Utilizes popular technical analysis tools such as MACD, RSI, EMA, and Ichimoku Cloud.
Enhances signal accuracy with additional indicators like ADX and Volume Increase.
Allows users to adjust the weights of each condition to set their importance.
The Confidence Level parameter lets you adjust the accuracy rate of the signals.
Visual Signals make it easy to track buy and sell points directly on the chart.
How It Works:
Condition Weights: Users assign weights to indicators like MACD, RSI, EMA, and Ichimoku Cloud. If you have no idea, use default settings.
Condition Fulfillment: Checks if the conditions for each indicator are met.
Confidence Level: The total weight of the fulfilled conditions must exceed the user-defined confidence level.
Signal Generation: When these conditions are met, a buy or sell signal is generated and visually displayed on the chart.
Customization:
Personalize Signals: By adjusting the weights of the indicators used, you can personalize the signals to match your trading strategy and preferences.
Use Cases:
Short-Term Investments: Identify quick trend changes for short-term trading decisions.
Long-Term Investments: Detect long-term trend starts and changes for strategic investment decisions.
Technical Analysis: Combine different technical analysis tools for more comprehensive and reliable analyses.
With this indicator, you can better understand market movements and make more informed investment decisions. Try it now and enhance your trading strategy!
by Fekonomi

Alpine Predictive BandsAlpine Predictive Bands - ADX & Trend Projection is an advanced indicator crafted to estimate potential price zones and trend strength by integrating dynamic support/resistance bands, ADX-based confidence scoring, and linear regression-based price projections. Designed for adaptive trend analysis, this tool combines multi-timeframe ADX insights, volume metrics, and trend alignment for improved confidence in trend direction and reliability.
Key Calculations and Components:
Linear Regression for Price Projection:
Purpose: Provides a trend-based projection line to illustrate potential price direction.
Calculation: The Linear Regression Centerline (LRC) is calculated over a user-defined lookbackPeriod. The slope, representing the rate of price movement, is extended forward using predictionLength. This projected path only appears when the confidence score is 70% or higher, revealing a white dotted line to highlight high-confidence trends.
Adaptive Prediction Bands:
Purpose: ATR-based bands offer dynamic support/resistance zones by adjusting to volatility.
Calculation: Bands are calculated using the Average True Range (ATR) over the lookbackPeriod, multiplied by a volatilityMultiplier to adjust the width. These shaded bands expand during higher volatility, guiding traders in identifying flexible support/resistance zones.
Confidence Score (ADX, Volume, and Trend Alignment):
Purpose: Reflects the reliability of trend projections by combining ADX, volume status, and EMA alignment across multiple timeframes.
ADX Component: ADX values from the current timeframe and two higher timeframes assess trend strength on a broader scale. Strong ADX readings across timeframes boost the confidence score.
Volume Component: Volume strength is marked as “High” or “Low” based on a moving average, signaling trend participation.
Trend Alignment: EMA alignment across timeframes indicates “Bullish” or “Bearish” trends, confirming overall trend direction.
Calculation: ADX, volume, and trend alignment integrate to produce a confidence score from 0% to 100%. When the score exceeds 70%, the white projection line is activated, underscoring high-confidence trend continuations.
User Guide
Projection Line: The white dotted line, which appears only when the confidence score is 70% or higher, highlights a high-confidence trend.
Prediction Bands: Adaptive bands provide potential support/resistance zones, expanding with market volatility to help traders visualize price ranges.
Confidence Score: A high score indicates a stronger, more reliable trend and can support trend-following strategies.
Settings
Prediction Length: Determines the forward length of the projection.
Lookback Period: Sets the data range for calculating regression and ATR.
Volatility Multiplier: Adjusts the width of bands to match volatility levels.
Disclaimer: This indicator is for educational purposes and does not guarantee future price outcomes. Additional analysis is recommended, as trading carries inherent risks.

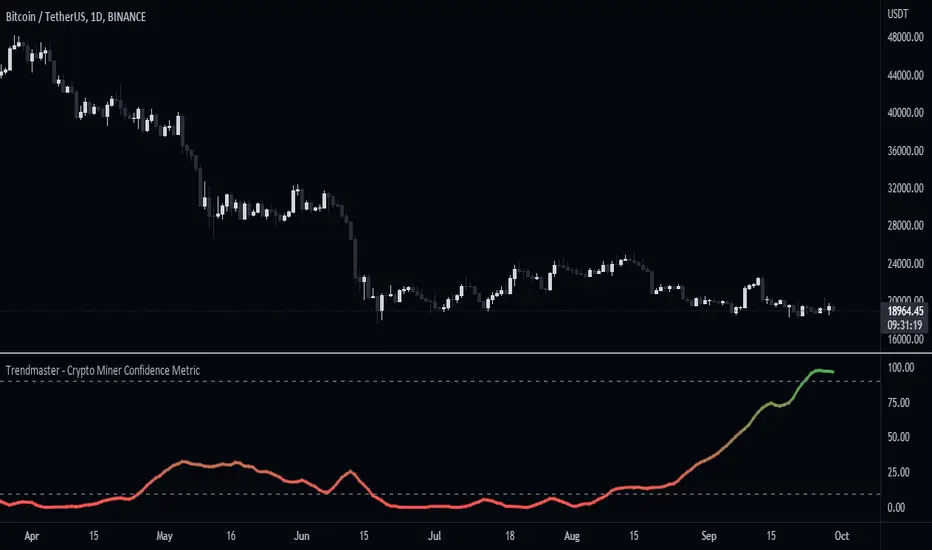
Trendmaster - Crypto Miner Confidence MetricWhat it is:
The Crypto Miner Confidence Metric analyses a handful of highly utilized Crypto networks to gain insight into the potential sentiment amongst those securing them and more specifically Crypto miners.
What it does:
It takes into account the overall trend in the increase or decrease of current computational power securing the networks, otherwise known as the hashrate - as well as the overall network inflows/outflows and holdings of those miners.
How to use it:
Using this data we can conclude whether their stance is currently Bullish or Bearish, with a value of 100 indicating an extremely positive future outlook from miners and a value of 0 representing a severe lack of confidence. Changes or pivots in the direction of miner confidence can indicate a shift in their Bullish or Bearish stance.
Quadratic Regression Trend ChannelIt's been a while since I have published anything meaningful for all members, but here is my next step in evolution of trend channel technology, my attempt at "Quadratic Regression Trend Channel" custom tailored for regression enthusiasts. I'm actually doing a lot more than my profile shall ever reveal. Many members may have heard of "polynomial regression channel"(PRC), but I wouldn't accurately label this as having the "poly-" capability in it with differing amounts of nth degrees/orders.
This indicator is derived from my "HLC Banded Quadratic Regression" indicator, the 3rd indicator I had ever published in my earliest days of tinkering around with Pine Script. It always had a destiny, and TV has graciously delivered on upgrading Pine with many new capabilities to run this algorithm with ease and in the manner that I wished to write it. Any subscribing TradingViewer has the freedom to use this indicator and as many as they shall desire.
Blessed is the "Immense Power of Pine" in 2021, as I utilized a multitude of new Pine features including extensive use of arrays for the quadratic regression formula, arrays of line.new(), input(group=), and input(inline=). I spent an incredible amount of time creating this, and it was no easy task to condense this amount of sophistication within less than 150 lines of code at the time of this original debut release. I have striven to achieve the indicator's computational efficiency potential to be as fast as possible with highly optimized code to handle the large amount of sampling it utilizes and is capable of. I hope you find it analytically favorable and beyond your expectations.
First of all, it has different sampling methods I haven't seen in any other PRC available, providing tightly snug and fit curvatures dependent on my optional choices not found in comparable indicators. This yields the best quality of fit I can provide by employing quadratic regression in order to provide a superb "visual analysis" of your price action in high noise environments. I also included my novel time warp feature to rewind the indicator regression into a previous state of time. If you're trading on really fast timeframes, I included an option to only calculate once per bar at it's closure. This will aid with computational efficiency of the TV servers, and it's intended to not to slow down your charting experience amongst a wide assortment of other indicators in your overlay chart.
I allowed a couple of variability methods for the confidence bands. A variety of coloring options, line thickness, and other perks are there to accommodate your distinct visual acuity. There is also a nifty option to color the regression by the slope of the curvatures. This is enabled by default, and I anticipate that you may find that color option uniquely useful. The amount of chords in the curvature are automatically calculated depending on the regression period selected to achieve a nice fluid arch for any setting.
Anyhow, I believe that sums up most of it's important characteristics in a brief explanation. It's potential is best personally discovered by simply using it with the myriad of control settings available. I published it with protected code, because I simply wanted to confine this monstrosity to my TradingView laboratory. I would rather not have this thing uncaged, rabidly running around the planet frothing out of the mouth on a Frankenstein AI later, unless it's mine on a short leash. Besides, I'm still trying to figure out the math behind "cubic regression". :)
Sorry in advance about not providing the source code, I hope you'll understand... We ALL know what devastation happens when things are "unleashed" from a BSL-4 lab to run amok. Countless billions have yet to learn a horrific lesson about the mania of evil at a future Geneva convention. If you don't know the mythical story about Pandora's box(a jar actually), look it up!
Features List Includes:
Calculation Throttling
Regression Period
Time Warp
Multiple Sampling Methods
Confidence Bands Variability Controls
Indicator Customization Options
When available time provides itself, I will consider your inquiries, thoughts, and concepts presented below in the comments section, should you have any questions or comments regarding this indicator. When my indicators achieve more prevalent use by TV members , I may implement more ideas when they present themselves as worthy additions. Have a profitable future everyone!
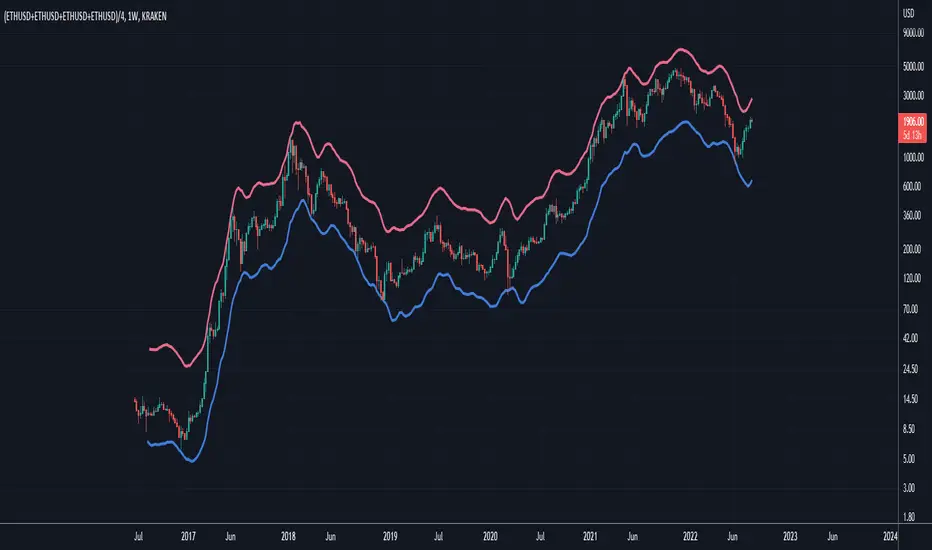
Ethereum: Confidence BandsPurpose of this Script
Similar to "Bitcoin: Confidence Bands", this script is designed to show regions of positive and negative overextension for Ethereum, where price is expected to either reverse long-term or at least shorter-term, using custom price loops tuned for the Ethereum case. Again, the idea is that one can be highly confident that Ethereum's price stays within the Confidence Bands, especially when looking at weekly closes. It might be wise to reduce exposure to Ethereum when price gets very near to the red band, and vice versa for an approach of the blue band. Of course this constitutes no financial advice, and one should always consider all available information for making trading decisions.
Settings
This indicator should only be used:
- with the default inputs (but of course feel free to play around a bit for testing purposes)
- on the weekly (W) time frame
- and for the following ticker setup, used to get well averaged Ethereum price data (ideally just copy this and paste it into the ticker field in the upper left area of the chart interface): (KRAKEN:ETHUSD+COINBASE:ETHUSD+BITFINEX:ETHUSD+POLONIEX:ETHUSD)/4
Otherwise the intended functionality cannot be guaranteed.
Access
For access please contact me via DM on TradingView or on Twitter (linked on my TradingView profile and in my signature).
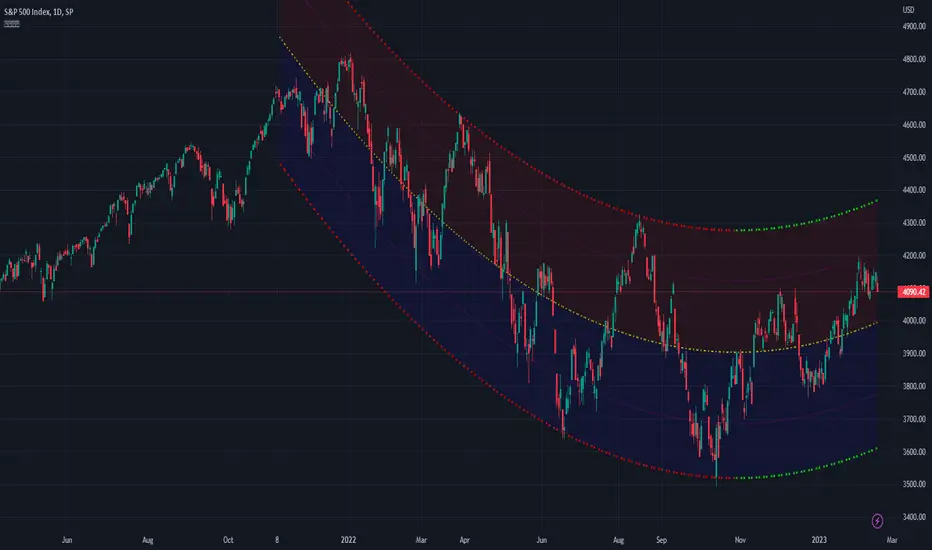
Bitcoin: Confidence BandsPurpose of this Script
This script is designed to show regions of positive and negative overextension for Bitcoin, where price is expected to either reverse long-term or at least shorter-term, using custom price loops. The idea is that one can be highly confident that Bitcoin's price stays within the Confidence Bands, especially when looking at weekly closes. It might be wise to reduce exposure to Bitcoin when price gets very near to the red band, and vice versa for an approach of the blue band. Of course this constitutes no financial advice, and one should always consider all available information for making trading decisions.
Settings
This indicator should only be used:
- with the default inputs (but of course feel free to play around a bit for testing purposes)
- on the weekly (W) time frame
- and for the BraveNewCoin Liquid Index for Bitcoin (BNC:BLX).
Otherwise the intended functionality cannot be guaranteed.
Access
For access please contact me via DM on TradingView or on Twitter (linked on my TradingView profile and in my signature).

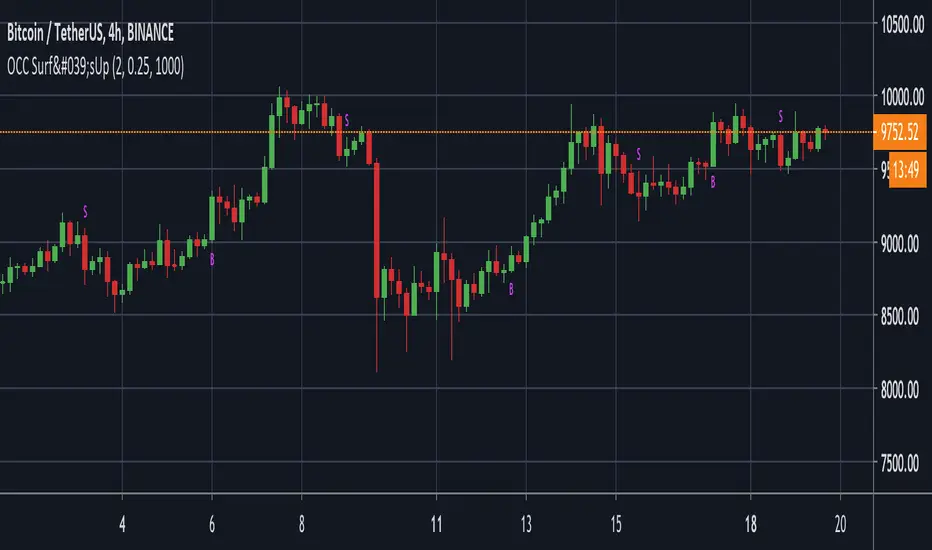
Surf's Up Alerts 1.0Optimal Markets - USDT/ BTC -USD/ BTC all major exchanges
Optimal Chart - 4H
Average trades - 1-2/week
YTD Profit (0 leverage) = 62%
This script was designed to give new traders confidence and some guidance when entering into the crypto trading industry.
When added to the USD/ BTC 4H (optimal) charts of any high volume exchange, three new alert conditions will appear under the Surf's Up indicator alerts. Turn on the "Buy Signal" and "Sell Signal" to be alerted of potential large price increases. This script analyzes multiple data pieces to determine points in which the price has the highest probability of moving up, along with a sell alert that will alert the user of either: the point at which the trend is dying and to take profit OR that the trend is not happening, and to cut your losses. "Secure Profit" can be set to alert you of given profit target, at which time you can set a stop loss just above break even, essentially making a risk-free trade! This is OPTIONAL as it could cause you to a leave a large winning trade too early as well :)
Buy and Sell conditions have been programmed to know when the user is already in a trade, so multiple alerts will not fire, allowing full integration of auto trading as well.
Surf's Up is a back-tested strategy turned study in order to give high potential trade alerts. This way, anyone can easily add the script to the BTC/USD 4H chart, and simply turn on/off any of the 3 alerts: Buy, Sell, or Secure Profit.
You can get more information along with access to this script/alert system by clicking the link in the signature, or sending us a PM here on Tradingview.
Happy Trading!
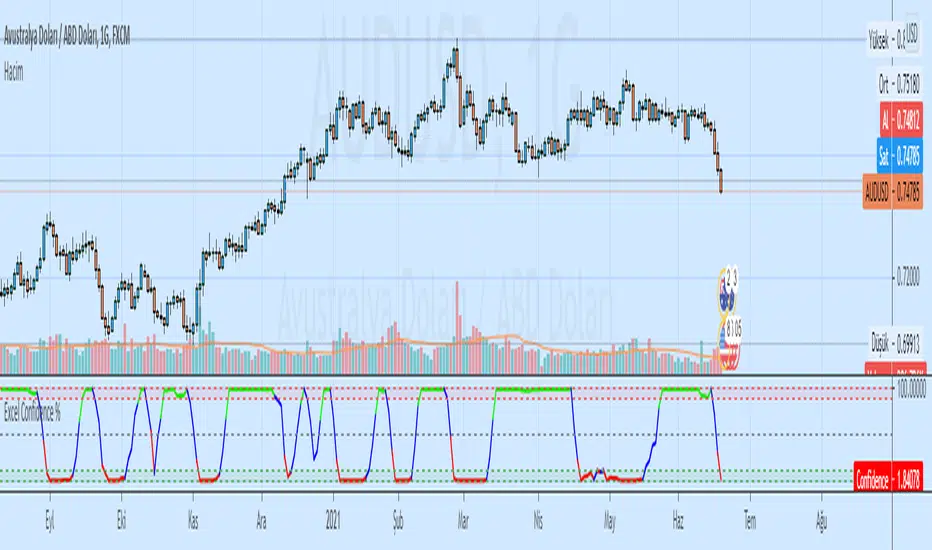
Excel Confidence %Excel Confidence %
Ranges between 0 and 100, usually at the extreme end of the scale.
A value of 0 indicates an unlikely move up, while 100 indicates a high probability of a rise.
You can try to use a slower version of the indicator (replacing 7 and 15 in the formula 3 and 5, respectively, and trade intersections, like stochastics.
You can also trade levels buy at values of 90 and above, sell at 10 and below.
Scoring Development Sample [BigBitsIO]This script shows a sample of how to do confidence weighted scoring indicators and for loops with Pine. This indicator may or may not be found useful, it's intent is to provide a sample on how to create such an indicator and use certain Pine features.
Features:
- Defined points based on the confidence of RSI and Stochastic indicator
- Defined points based on candle color and sma trend direction
- For loops used to calculate bonus points for "extended periods" of confidence.
*** DISCLAIMER: For educational and entertainment purposes only. Nothing in this content should be interpreted as financial advice or a recommendation to buy or sell any sort of security or investment including all types of crypto. DYOR, TYOB. ***

Exponential Least Squares Moving AverageModified LSMA (Least Squares Moving Average) to use exponential rates of growth instead of linear regression. Inputting a number into the confidence interval allows the user to have set percentage of statistical guarantee based on past movement. To set this percentage of guarantee (Default set to 97.5%), refer to the input values below:
0.000 = 50%
0.255 = 60%
0.525 = 70%
0.835 = 80%
1.040 = 85%
1.285 = 90%
1.645 = 95%
1.960 = 97.5%
2.330 = 99%

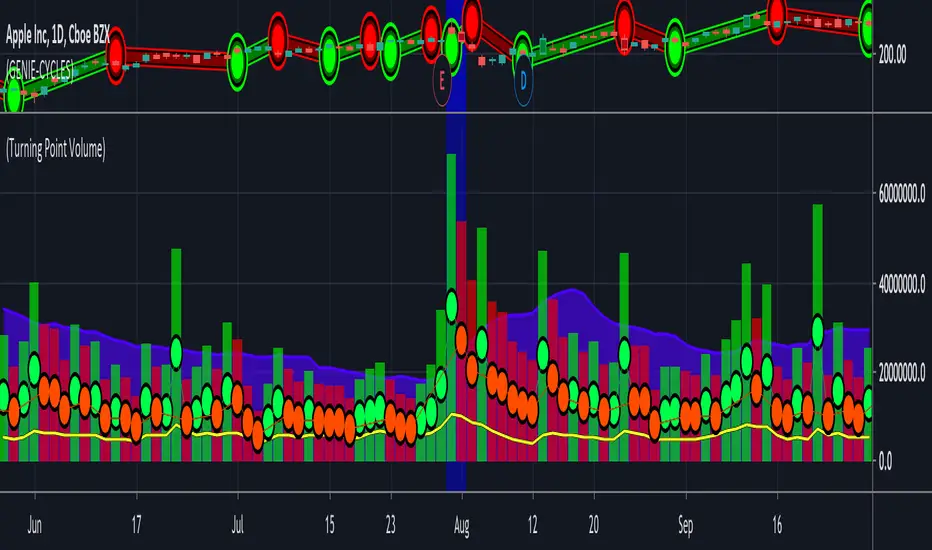
(14) Turning Point Volume VS-332Although dramatic increases in volume can accurately reflect the sentiment of changes in price, small changes do as well. Think of it this way. Every share sold or purchased is a vote for or against the current price action. If the price has gone up today and the volume also went up, compared to the previous days volume, the votes of the majority of the traders that produced this volume agreed with the sentiment that this price change represented. If the volume was suppressed on this price increase, that sentiment was not confirmed. This provides you with a very good window into the collective minds of traders allowing you to judge every candle, every indicator and every price action in a much more initiative and accurate way. The SDG Turning Point Volume indicator again utilizes a dot system to easily allow you to see in a glance if the volume is confirming the price action sentiment (green dot) or if it is discounting the price action (red dot.)
There are many situations where volume alone can indicate important inflection points in an equities direction. It may not even reverse direction, but an abrupt change in the rate of change, can be a very profitable entry point – if you can see it coming and act in advance of some or most of the traders making this market.
Access this Genie indicator for your Tradingview account, through our web site. (Links Below) This will provide you with additional educational information and reference articles, videos, input and setting options and trading strategies this indicator excels in.
Confidence IntervalsThis indicator allows you to be able to see the confidence intervals for whatever asset you are trading given a certain expiry. Confidence intervals project the most probable price ranges over a certain period of time in the future.
In order to use this you must first specify what expiry you want to use in days, so if you want to project the confidence interval 1 day out you would input 1, if you want 1 year out you'd input 252 (the number of trading days in 1 year), if you want 12hrs out you'd input 0.5.
Next you must specify what timeframe you are using on your chart in minutes, so if you're using 5 min chart you'd input 5, if you're using 4hr you'd input 240, if you're using daily charts you'd use 1440.
Finally you must input what standard deviation you want to use for the confidence range.
Confidence levels are really helpful in trading, especially for options, because it allows you to be able to choose a more strategic expiry based on probabilities. In other types of trading such as stocks, futures, and FX confidence levels can be helpful in helping you better plan out your trade by figuring out where price probably will and will not go given a certain period of time in the future. Additionally, confidence levels allow you to be able to visualize volatility expansion and contraction.
Standard Deviation Probabilities:
0.5 STD has a 99% of touching the bounds of the interval and a 50% chance of closing beyond the bounds (these probabilities are not predicated on a certain direction, if you pick a certain direction divide these probabilities by 2)
1 STD has a 64% of touching the bounds of the interval and a ~30-32% chance of closing beyond the bounds (these probabilities are not predicated on a certain direction, if you pick a certain direction divide these probabilities by 2)
1.6 STD has a ~40% of touching the bounds of the interval and a ~20% chance of closing beyond the bounds (these probabilities are not predicated on a certain direction, if you pick a certain direction divide these probabilities by 2)
2 STD has a ~10% of touching the bounds of the interval and a ~5% chance of closing beyond the bounds (these probabilities are not predicated on a certain direction, if you pick a certain direction divide these probabilities by 2)
3 STD has a <2% of touching the bounds of the interval and a <1% chance of closing beyond the bounds (these probabilities are not predicated on a certain direction, if you pick a certain direction divide these probabilities by 2)
