Coinbase/Binance Premium Histogram with SMA- Indicator Name and Purpose: The Coinbase/Binance Premium Histogram with SMA is a TradingView indicator designed to visualize the price differential, or premium, between Coinbase and Binance exchanges for a specified cryptocurrency base asset, such as BTC in BTCUSD.
- Dynamic Symbol Construction: It automatically extracts the base currency from the current chart symbol and constructs the appropriate tickers for Coinbase (e.g., COINBASE:BTCUSD) and Binance (e.g., BINANCE:BTCUSDT).
- Price Retrieval and Premium Calculation: The indicator fetches closing prices from both exchanges and computes the premium as the difference between the Coinbase price and the Binance price.
- Histogram Visualization: The premium is plotted as a histogram in a separate pane below the main chart. Positive premiums (higher prices on Coinbase) are colored green, while negative premiums (higher on Binance) are colored red.
- Simple Moving Average (SMA) Integration: A user-configurable SMA of the premium is included, with a default length of 14 periods, displayed as a gray line to offer a smoothed trend perspective.
- Analytical Utility: This tool facilitates the examination of exchange-specific pricing variations, which may indicate potential arbitrage opportunities or market disparities.
- Interpretation of the Premium: A positive Coinbase premium, indicating that Bitcoin trades at a higher price on Coinbase compared to Binance, often reflects strong buying pressure from U.S.-based investors and institutions. This heightened demand can signal potential upward momentum in Bitcoin's price, as it may precede broader market rallies driven by increased institutional interest and optimistic sentiment. Conversely, a negative premium suggests weaker U.S. demand or selling pressure, which could contribute to downward price movements.
- Compatibility with Other Cryptocurrencies: The script is designed to function with all cryptocurrencies that have a USD trading pair on Coinbase and a USDT pair on Binance. It delivers the highest proven signal strength for Bitcoin, where the premium has historically served as a reliable indicator of price direction. The indicator has also demonstrated effectiveness for other assets, such as Ethereum, where a positive premium similarly signals robust U.S. demand and potential bullish momentum. It can be applied to coins like Solana as well, though signal reliability may vary depending on market dynamics and institutional participation.
Coinbase

Coinbase Premium Index (Custom Tickers)📊 Coinbase Premium Index (Auto Symbol Support)
1. Overview
The Coinbase Premium Index is a widely used indicator to gauge the sentiment difference between US institutional investors (Coinbase Pro) and global retail/futures traders (Binance).
This script calculates the percentage difference between the Coinbase (USD pair) price and the Binance (USDT pair) price.
2. Key Features
🔄 Auto Symbol Matching (New): You no longer need to manually change tickers when switching charts.
If you are looking at a SOL/USDT chart, the indicator automatically detects "SOL" and compares COINBASE:SOLUSD vs BINANCE:SOLUSDT.
🛠 Manual Mode: Includes a manual override option if you wish to compare specific fixed tickers (e.g., strictly BTC).
🎨 Dynamic Visuals:
Histogram: Color-coded bars (Green/Red) indicate positive or negative premiums.
Smart Label: Displays the real-time premium value on the chart. The label color adapts to the trend, and hovering over it shows a Tooltip confirming exactly which tickers are being compared.
3. How to Interpret
The premium indicates the flow of funds and buying pressure:
🟢 Positive Premium (Green Bar):
Coinbase Price > Binance Price
Interpretation: Strong buying pressure from US institutions or spot whales. Often considered a Bullish signal.
🔴 Negative Premium (Red Bar):
Coinbase Price < Binance Price
Interpretation: Strong selling from US investors, or overheated buying in the offshore futures market (Binance). Often considered a Bearish or mean-reversion signal.
4. Settings Guide
Ticker Mode:
Auto (Current Chart): Automatically sets the comparison based on your current chart's base currency (Recommended).
Manual (Custom): Uses the specific tickers defined in the manual input fields below.
Manual Inputs: Enter tickers here if using Manual Mode (Default: COINBASE:BTCUSD vs BINANCE:BTCUSDT).
Bar & Label Settings: Customize colors, transparency, and the vertical position (Y-Offset) of the data label to fit your chart layout.

CB Spot v BN Futs Premium by Chop324Coinbase Spot vs Binance Futures Premium Tracker
What This Indicator Does:
This indicator automatically tracks the price premium or discount between Coinbase spot prices and Binance perpetual futures for any cryptocurrency you're viewing. It works dynamically with whatever ticker you load it on - no manual configuration needed.
How It Works:
The script extracts the base currency from your current chart (BTC, ETH, SOL, etc.) and automatically constructs the corresponding tickers:
Coinbase Spot: COINBASE: USD
Binance Perpetual Futures: BINANCE: USDT.P
It then calculates the simple price difference: Coinbase Spot - Binance Futures
Visual Display:
The premium/discount is plotted as a histogram:
Green columns: Coinbase trading at a premium (higher than Binance)
Red columns: Coinbase trading at a discount (lower than Binance)
Baseline at 0: Represents price parity between exchanges
Why This Matters:
Coinbase premium is a useful market sentiment indicator, particularly for institutional/US retail activity:
Positive premium: Often indicates strong US-based buying pressure
Negative premium: May suggest selling pressure or capital flowing to offshore exchanges
Extreme deviations: Can signal localized supply/demand imbalances or arbitrage opportunities
Usage:
Simply load the indicator on any crypto chart (BTCUSDT, ETHUSDT, SOLUSDT, etc.) and it will automatically display the premium/discount for that asset.
Note: Requires both Coinbase spot and Binance perpetual futures data to be available for the symbol you're viewing.

Spot vs. Derivatives BasisThis indicator calculates the basis between average spot and average perpetual futures prices across selected exchanges. It helps identify deviations between spot and perp markets — a key signal for funding pressure, arbitrage, or market dislocation.
Key Features:
Manual Pair Control – Enable or disable specific trading pairs as needed
Flexible Basis Smoothing – Apply SMA, EMA, WMA, or VWMA to filter noise
Anomaly Highlighting – Automatically flags basis deviations beyond ±0.1%

52SIGNAL RECIPE Coinbase Institutional Smart Money DetectorCoinbase Institutional Smart Money Detector
◆ Overview
Coinbase Institutional Smart Money Detector is an innovative indicator that detects the buying and selling movements of institutional investors through Coinbase Prime in real-time. This powerful tool tracks the flow of funds from large institutions to provide valuable signals before significant market direction changes occur. It can be applied to Bitcoin charts on any exchange, allowing traders to follow the "smart money" movements of institutions anytime, anywhere.
The unique strength of this indicator lies in its comprehensive assessment of institutional investors' consecutive trading behaviors, volume patterns, and trend strength by analyzing Coinbase data in real-time. By providing clear visual representation of institutional fund flow data that is difficult for ordinary traders to access, you gain the opportunity to move alongside the big players in the market.
─────────────────────────────────────
◆ Key Features
• Coinbase Prime Data Analysis: Tracks institutional movements in real-time by analyzing data from Coinbase Prime, an institutional-only service
• Real-time Institutional Fund Flow Monitoring: Immediately detects large institutions' spot buying/selling activities, allowing positioning ahead of the market
• Universal Exchange Compatibility: Applicable to Bitcoin charts on any exchange, enabling use on your preferred trading platform
• Institutional Continuity Analysis: Identifies continuous institutional activity by tracking consecutive buying/selling patterns
• Smart Volume Analysis: Detects increased volume compared to averages and analyzes key trading time periods
• Trend Strength Measurement: Quantifies and displays the strength of upward/downward trends by analyzing candle patterns
• Intuitive Visualization: Clearly marks institutional activity points on charts through bar coloring and labels
• Real-time Strength Display: Calculates and displays current trend strength in a table in real-time
• Customizable Settings: Allows customization of key parameters to match your trading style
─────────────────────────────────────
◆ Understanding Signal Types
■ Institutional Buy Signal
• Definition: Occurs when institutional investors show consecutive buying activity through Coinbase Prime, accompanied by increased volume and strong upward trend
• Visual Representation: Translucent blue bar coloring and "Institution Buying Detected!" label on the candle where the buy signal occurs
• Market Interpretation: Indicates that institutional investors are actively buying spot Bitcoin, which is likely to lead to price increases
• Signal Strength Factors:
▶ Consecutive price increase patterns
▶ Above-average volume
▶ Strong upward trend strength measurement
▶ Significant price movement
■ Institutional Sell Signal
• Definition: Occurs when institutional investors show consecutive selling activity through Coinbase Prime, accompanied by increased volume and strong downward trend
• Visual Representation: Translucent pink bar coloring and "Institution Selling Detected!" label on the candle where the sell signal occurs
• Market Interpretation: Indicates that institutional investors are actively selling spot Bitcoin, which is likely to lead to price decreases
• Signal Strength Factors:
▶ Consecutive price decrease patterns
▶ Above-average volume
▶ Strong downward trend strength measurement
▶ Significant price movement
─────────────────────────────────────
◆ Understanding Trend Strength
■ Trend Strength Measurement Method
• Definition: Measures trend strength by analyzing the ratio of up/down candles over a recent period
• Visual Representation: Displayed in the table as "BULL STRENGTH" or "BEAR STRENGTH" with percentage value and "STRONG" or "WEAK" status
• Strength Threshold: Strong/weak determination according to user-configurable threshold
• Calculation Method:
▶ Upward trend strength = (Number of upward candles) / (Total analysis period)
▶ Downward trend strength = (Number of downward candles) / (Total analysis period)
▶ Displayed as "STRONG" when strength is above threshold, "WEAK" when below
■ Utilizing Trend Strength
• Signal Filtering: Generates signals only when trend strength is strong, reducing false signals
• Trend Confirmation: Evaluates the health and sustainability of the current market trend
• Entry/Exit Decisions: Consider entering in strong trends and exiting when trends weaken
• Risk Management: Develop strategies to reduce position size in weak trends and increase in strong trends
─────────────────────────────────────
◆ Practical Trading Applications
■ Institutional Buy Signal Strategy
• Trend Reversal Scenario:
▶ Setup: Strong institutional buy signal during a downtrend
▶ Entry: Buy after signal confirmation in the next candle
▶ Stop Loss: Below the low of the signal candle
▶ Take Profit: When reaching previous major resistance or when trend strength weakens
• Trend Continuation Scenario:
▶ Setup: Institutional buy signal after correction in an uptrend
▶ Entry: Buy after signal confirmation
▶ Stop Loss: Below recent major low
▶ Take Profit: Gradually take profits considering trend strength
■ Institutional Sell Signal Strategy
• Trend Reversal Scenario:
▶ Setup: Strong institutional sell signal during an uptrend
▶ Entry: Sell after signal confirmation in the next candle
▶ Stop Loss: Above the high of the signal candle
▶ Take Profit: When reaching previous major support or when trend strength weakens
• Trend Continuation Scenario:
▶ Setup: Institutional sell signal after bounce in a downtrend
▶ Entry: Sell after signal confirmation
▶ Stop Loss: Above recent major high
▶ Take Profit: Gradually take profits considering trend strength
■ Multi-Timeframe Approach
• Higher Timeframe Direction Confirmation:
▶ Check institutional signals and trend strength on daily/4-hour charts
▶ Use for setting main trading direction
• Lower Timeframe Entry Point Finding:
▶ Wait for lower timeframe signals that align with higher timeframe direction
▶ Use for capturing precise entry points
• Cross-Timeframe Signal Alignment:
▶ Signal strength increases when signals occur in the same direction across multiple timeframes
▶ Capture high-probability trading opportunities
─────────────────────────────────────
◆ Indicator Settings Guide
■ Main Setting Parameters
• Institutional Continuity Period:
▶ Purpose: Sets the period to check institutional consecutive buying/selling activity
▶ Lower value: Generates more signals, increases responsiveness
▶ Higher value: Reduces number of signals, increases reliability
• Trend Strength Threshold:
▶ Purpose: Sets the minimum threshold for determining strong trends
▶ Lower value: More signals, less filtering
▶ Higher value: Generates signals only in stronger trends, higher filtering
─────────────────────────────────────
◆ Synergy with Other Indicators
• Support/Resistance Levels:
▶ Institutional signals occurring at key support/resistance levels have higher probability
▶ Combination of key technical analysis levels and institutional activity provides powerful signals
• Moving Averages:
▶ Pay attention to institutional signals near key moving averages (50MA, 200MA)
▶ Strong trend change possibility when moving average crossovers coincide with institutional signals
• RSI/Momentum Indicators:
▶ Institutional buy signals in oversold conditions increase reversal probability
▶ Institutional sell signals in overbought conditions increase reversal probability
• Volume Profile:
▶ Institutional signals at high volume nodes confirm important price levels
▶ Institutional activity in key trading areas greatly impacts price direction
• Market Structure:
▶ Institutional signals near key market structures (higher highs/lows, lower highs/lows) suggest structural changes
▶ Coincidence of market structure changes and institutional activity indicates important trend turning points
─────────────────────────────────────
◆ Conclusion
Coinbase Institutional Smart Money Detector provides traders with valuable insights by tracking spot Bitcoin trading activities of institutional investors through Coinbase Prime in real-time. Because it can be applied to Bitcoin charts on any exchange, you can utilize it immediately on your preferred trading platform.
The core value of this indicator is providing intuitive visualization of institutional fund flow data that is difficult for ordinary traders to access. By comprehensively analyzing consecutive price movements, volume increases, and trend strength to capture institutional activity, you gain the opportunity to move alongside the big players in the market.
Clear buy/sell signals based on Coinbase Prime data and real-time trend strength measurements help traders quickly grasp market conditions and make strategic decisions. By integrating this powerful tool into your trading strategy, secure a competitive edge to understand where the market's smart money is flowing and position accordingly.
─────────────────────────────────────
※ Disclaimer: Like all trading tools, the Institutional Smart Money Detector should be used as a supplementary indicator and not relied upon exclusively for trading decisions. Past patterns of institutional behavior may not guarantee future market movements. Always employ appropriate risk management strategies in your trading.
Coinbase Institutional Smart Money Detector
◆ 개요
Coinbase Institutional Smart Money Detector는 코인베이스 프라임(Coinbase Prime)을 통한 기관 투자자들의 현물 비트코인 매수/매도 움직임을 실시간으로 감지하는 혁신적인 지표입니다. 이 강력한 도구는 대형 기관들의 자금 흐름을 추적하여 중요한 시장 방향 전환이 일어나기 전에 귀중한 신호를 제공합니다. 어떤 거래소의 비트코인 차트에도 적용 가능하여 트레이더들이 언제 어디서든 기관의 "스마트 머니" 움직임을 따라갈 수 있게 해줍니다.
이 지표의 독보적인 강점은 코인베이스 데이터를 실시간으로 분석하여 기관 투자자들의 연속적인 매매 행동, 거래량 패턴, 그리고 추세 강도를 종합적으로 평가한다는 점입니다. 일반 트레이더들이 접근하기 어려운 기관 자금 흐름 데이터를 시각적으로 명확하게 제공함으로써, 여러분은 시장의 큰 손들과 함께 움직일 수 있는 기회를 얻게 됩니다.
─────────────────────────────────────
◆ 주요 특징
• 코인베이스 프라임 데이터 분석: 기관 전용 서비스인 코인베이스 프라임의 데이터를 실시간으로 추적하여 기관의 움직임 포착
• 실시간 기관 자금 흐름 모니터링: 대형 기관들의 현물 매수/매도 활동을 즉각적으로 감지하여 시장에 앞서 포지셔닝 가능
• 모든 거래소 호환성: 어떤 거래소의 비트코인 차트에도 적용 가능하여 선호하는 트레이딩 플랫폼에서 활용 가능
• 기관 연속성 분석: 연속적인 매수/매도 패턴을 추적하여 기관의 지속적인 활동 식별
• 스마트 볼륨 분석: 평균 대비 거래량 증가를 감지하고 주요 거래 시간대를 분석
• 추세 강도 측정: 캔들 패턴을 분석해 상승/하락 추세의 강도를 수치화하여 표시
• 직관적 시각화: 바 컬러링과 라벨을 통해 기관 활동 지점을 차트에 명확하게 표시
• 실시간 강도 표시: 현재 추세의 강도를 실시간으로 계산하여 테이블에 표시
• 사용자 정의 설정: 주요 매개변수를 조정하여 자신의 트레이딩 스타일에 맞게 커스터마이징 가능
─────────────────────────────────────
◆ 신호 유형 이해하기
■ 기관 매수 신호
• 정의: 코인베이스 프라임을 통해 기관 투자자들이 연속적인 매수 활동을 보이며, 이와 함께 거래량 증가와 강한 상승 추세가 나타날 때 발생
• 시각적 표현: 매수 신호가 발생한 캔들에 반투명 파란색 바 컬러링과 함께 "Institution Buying Detected!" 라벨 표시
• 시장 해석: 기관 투자자들이 적극적으로 현물 비트코인을 매수하고 있으며, 이는 곧 가격 상승으로 이어질 가능성이 높음을 의미
• 신호 강도 요소:
▶ 연속적인 가격 상승 패턴
▶ 평균보다 높은 거래량
▶ 강한 상승 추세 강도 측정값
▶ 유의미한 가격 변동
■ 기관 매도 신호
• 정의: 코인베이스 프라임을 통해 기관 투자자들이 연속적인 매도 활동을 보이며, 이와 함께 거래량 증가와 강한 하락 추세가 나타날 때 발생
• 시각적 표현: 매도 신호가 발생한 캔들에 반투명 분홍색 바 컬러링과 함께 "Institution Selling Detected!" 라벨 표시
• 시장 해석: 기관 투자자들이 적극적으로 현물 비트코인을 매도하고 있으며, 이는 곧 가격 하락으로 이어질 가능성이 높음을 의미
• 신호 강도 요소:
▶ 연속적인 가격 하락 패턴
▶ 평균보다 높은 거래량
▶ 강한 하락 추세 강도 측정값
▶ 유의미한 가격 변동
─────────────────────────────────────
◆ 추세 강도 이해하기
■ 추세 강도 측정 방식
• 정의: 최근 일정 기간 동안의 상승/하락 캔들 비율을 분석하여 추세의 강도를 측정
• 시각적 표현: 테이블에 "BULL STRENGTH" 또는 "BEAR STRENGTH"로 표시되며, 백분율 값과 함께 "STRONG" 또는 "WEAK" 상태 표시
• 강도 임계값: 사용자가 설정 가능한 임계값에 따라 강함/약함 판정
• 계산 방식:
▶ 상승 추세 강도 = (상승 캔들 수) / (전체 분석 기간)
▶ 하락 추세 강도 = (하락 캔들 수) / (전체 분석 기간)
▶ 강도가 임계값 이상일 때 "STRONG", 미만일 때 "WEAK"로 표시
■ 추세 강도의 활용
• 신호 필터링: 추세 강도가 강할 때만 신호를 생성하여 허위 신호 감소
• 추세 확인: 현재 시장 추세의 건전성과 지속 가능성 평가
• 진입/퇴출 결정: 강한 추세에서 진입하고 약한 추세로 전환될 때 퇴출 고려
• 리스크 관리: 약한 추세에서는 포지션 크기를 줄이고, 강한 추세에서는 늘리는 전략 수립 가능
─────────────────────────────────────
◆ 실전 트레이딩 응용
■ 기관 매수 신호 활용 전략
• 추세 전환 시나리오:
▶ 설정: 하락 추세 중 강한 기관 매수 신호 발생
▶ 진입: 신호 확인 후 다음 캔들에서 매수
▶ 손절: 신호 캔들의 저점 아래
▶ 이익실현: 이전 주요 저항선 도달 시 또는 추세 강도가 약해질 때
• 추세 지속 시나리오:
▶ 설정: 상승 추세 중 조정 후 기관 매수 신호 발생
▶ 진입: 신호 확인 후 매수
▶ 손절: 최근 주요 저점 아래
▶ 이익실현: 추세 강도를 고려하여 단계적으로 이익실현
■ 기관 매도 신호 활용 전략
• 추세 전환 시나리오:
▶ 설정: 상승 추세 중 강한 기관 매도 신호 발생
▶ 진입: 신호 확인 후 다음 캔들에서 매도
▶ 손절: 신호 캔들의 고점 위
▶ 이익실현: 이전 주요 지지선 도달 시 또는 추세 강도가 약해질 때
• 추세 지속 시나리오:
▶ 설정: 하락 추세 중 반등 후 기관 매도 신호 발생
▶ 진입: 신호 확인 후 매도
▶ 손절: 최근 주요 고점 위
▶ 이익실현: 추세 강도를 고려하여 단계적으로 이익실현
■ 다중 시간프레임 접근법
• 상위 시간프레임 방향성 확인:
▶ 일봉/4시간봉에서 기관 신호 및 추세 강도 확인
▶ 주 트레이딩 방향 설정에 활용
• 하위 시간프레임 진입점 찾기:
▶ 상위 시간프레임 방향과 일치하는 하위 시간프레임 신호 대기
▶ 정밀한 진입점 포착에 활용
• 시간프레임 간 신호 일치 확인:
▶ 여러 시간프레임에서 동일한 방향의 신호가 발생할 때 신호 강도 증가
▶ 높은 확률의 트레이딩 기회 포착
─────────────────────────────────────
◆ 지표 설정 가이드
■ 주요 설정 매개변수
• Institutional Continuity Period (기관 연속성 확인 기간):
▶ 목적: 기관의 연속적인 매수/매도 활동을 확인할 기간 설정
▶ 낮은 값: 더 많은 신호 생성, 반응성 증가
▶ 높은 값: 신호 수 감소, 신뢰성 증가
• Trend Strength Threshold (추세 강도 임계값):
▶ 목적: 추세가 강하다고 판단할 최소 임계값 설정
▶ 낮은 값: 더 많은 신호, 낮은 필터링
▶ 높은 값: 더 강한 추세에서만 신호 생성, 높은 필터링
─────────────────────────────────────
◆ 다른 지표와의 시너지
• 지지/저항 레벨:
▶ 주요 지지/저항 레벨에서 발생하는 기관 신호는 확률이 더 높음
▶ 기술적 분석의 핵심 레벨과 기관 활동의 결합은 강력한 시그널 제공
• 이동평균선:
▶ 주요 이동평균선(50MA, 200MA) 근처에서 발생하는 기관 신호 주목
▶ 이동평균선 돌파와 기관 신호가 일치할 때 강한 추세 변화 가능성
• RSI/모멘텀 지표:
▶ 과매수/과매도 상태에서 발생하는 기관 신호는 반전 가능성 높임
▶ 모멘텀 다이버전스와 기관 신호의 일치는 강력한 반전 신호
• 볼륨 프로파일:
▶ 높은 볼륨 노드에서 발생하는 기관 신호는 중요한 가격 레벨 확인
▶ 주요 거래 영역에서의 기관 활동은 가격 방향에 큰 영향 미침
• 시장 구조:
▶ 주요 시장 구조(높은 고점/저점, 낮은 고점/저점) 근처에서 발생하는 기관 신호는 구조 변화 암시
▶ 시장 구조 변화와 기관 활동의 일치는 중요한 추세 전환점 표시
─────────────────────────────────────
◆ 결론
Coinbase Institutional Smart Money Detector는 코인베이스 프라임을 통한 기관 투자자들의 현물 비트코인 거래 활동을 실시간으로 추적하여 트레이더들에게 귀중한 통찰력을 제공합니다. 어떤 거래소의 비트코인 차트에도 적용 가능하기 때문에, 여러분이 선호하는 트레이딩 플랫폼에서 바로 활용할 수 있습니다.
이 지표의 핵심 가치는 일반 트레이더들이 접근하기 어려운 기관 자금 흐름 데이터를 직관적으로 시각화하여 제공한다는 점입니다. 연속적인 가격 움직임, 거래량 증가, 그리고 추세 강도를 종합적으로 분석하여 기관의 활동을 포착함으로써, 여러분은 시장의 큰 손들과 함께 움직일 수 있는 기회를 얻게 됩니다.
코인베이스 프라임 데이터를 기반으로 한 명확한 매수/매도 신호와 실시간 추세 강도 측정은 트레이더들이 시장 상황을 한눈에 파악하고 신속하게 전략적 결정을 내릴 수 있게 도와줍니다. 이 강력한 도구를 여러분의 트레이딩 전략에 통합함으로써, 시장의 스마트 머니가 어디로 흘러가는지 파악하고 그에 따라 포지셔닝할 수 있는 경쟁 우위를 확보하세요.
─────────────────────────────────────
※ 면책 조항: 모든 트레이딩 도구와 마찬가지로, Institutional Smart Money Detector는 보조 지표로 사용해야 하며 트레이딩 결정을 전적으로 의존해서는 안 됩니다. 과거의 기관 행동 패턴이 미래 시장 움직임을 보장하지는 않습니다. 항상 적절한 리스크 관리 전략을 트레이딩에 활용하세요.

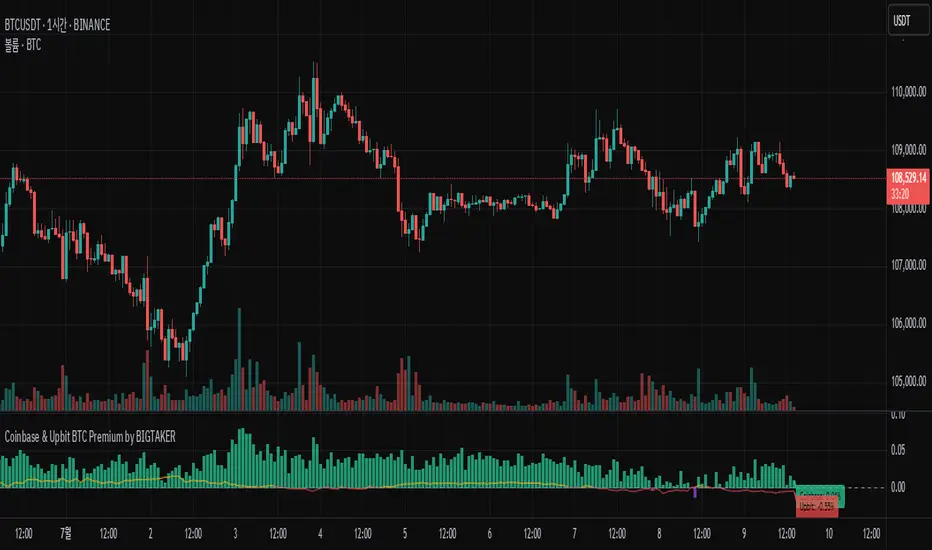
Coinbase BTC Premium by BIGTAKERBTC Premium Gap Analysis: Binance, Coinbase, Upbit
This indicator provides real-time analysis and visualization of the premium gap between the Binance BTCUSDT price and the BTC prices on Coinbase (BTCUSD) and Upbit (BTCKRW).
Key Features
Coinbase Premium Gap
Measures the price difference between Coinbase and Binance as a percentage.
To improve visibility, the Coinbase premium is visually amplified by 10x.
Upbit Premium Gap
Calculates the premium by comparing Upbit's BTCKRW price (converted into USD using the real-time USDKRW exchange rate) against Binance BTCUSDT.
Dynamic Color Coding
Premiums above 0% are displayed in lime green, indicating positive premiums.
Premiums below 0% are displayed in red, indicating discounts.
Real-Time Labels
Displays real-time premium values for both Coinbase and Upbit on the right side of the chart.
Additional Notes
Upbit premiums are adjusted for the USD/KRW exchange rate to ensure accurate USD-based comparison.
The Coinbase premium is magnified visually (10x) to better capture minor movements, while the actual premium value remains correctly displayed.
The indicator is optimized for traders who monitor global BTC market price disparities across major exchanges.
How to Use
Quickly track global BTC price discrepancies across Binance, Coinbase, and Upbit.
Detect "Kimchi Premium" conditions in the Korean market through Upbit premiums.
Analyze buying and selling pressure in North American markets through Coinbase premiums.
Spot Premium with ROCDescription:
This indicator tracks the spot premium of BTC by comparing the perpetual futures price (perp) from Binance against the spot price on Coinbase. The histogram displays the price difference (spot minus perp) with green bars when spot is higher and red when perp carries a premium. The Rate of Change (ROC) line measures how quickly this premium shifts, with an option to normalize fluctuations for greater stability.
Implications & Possible Use Cases:
• Market Sentiment Gauge: A sustained positive premium often indicates bullish sentiment, while a discount can signal bearish bias.
• Arbitrage Signals: Significant divergences between perp and spot may present short-term arbitrage opportunities across exchanges.
• Risk Management & Hedging: Traders can align derivatives and spot positions when premiums deviate sharply, reducing funding cost exposures.
• Funding Rate Insights: Since perp funding rates tend to follow premium levels, this indicator can act as an early warning for funding spikes.
• Trend Confirmation: Use the normalized ROC to confirm continuation or reversal of premium trends, filtering out noise around small diff values.
Let me know if you would like additional features.

Coinbase Premium DivergenceCoinbase Spot premium indicator
Includes divergence where the premium is decreasing and price is increasing (and vice-versa); orange bear div, blue bull div.
Confluence = Green bull / Red bear
Use to identify warnings
Probably best to use on 15 /30 min
Applies only to current conditions in the bitcoin market.
For use on BTCUSD only.

BTC Coinbase PremiumThis script is designed to compare the price of Bitcoin on two major exchanges: Coinbase and Binance. It helps you see if there’s a difference in the price of Bitcoin between these two exchanges, which is known as a “premium” or “discount.”
Here’s how it works in simple terms:
Getting the Prices:
The script first fetches the current price of Bitcoin from Coinbase and Binance. It looks at the closing price, which is the price at the end of the selected time period on your chart.
Calculating the Difference:
It then calculates the difference between these two prices. If Bitcoin is more expensive on Coinbase than on Binance, this difference will be positive, indicating a “premium.” If it’s cheaper on Coinbase, the difference will be negative, indicating a “discount.”
Visualizing the Difference:
The script creates a visual chart that shows this price difference over time. It uses green bars to show when there’s a premium (Coinbase is more expensive) and red bars to show when there’s a discount (Coinbase is cheaper).
Optional Table Display:
If you choose to, the script can also show this price difference in a small table at the top right corner of your chart. The table displays the words “Coinbase Premium” and the exact dollar amount of the premium or discount.
Why does it matter?
Traders and investors have spotted a correlation between bullish strength on BTC and a strong Coinbase premium along with the inverse of a strong Coinbase discount and BTC price weakness.

Coinbase Premium ($) Absolute Dollar Amount # Coinbase Dollar Premium Indicator
## Description
The Coinbase Dollar Premium Indicator is a powerful tool for cryptocurrency traders and analysts, providing real-time insight into the price differences between major exchanges. This indicator calculates and visualizes the dollar amount premium or discount of Bitcoin on Coinbase compared to the average price on Binance and Kraken.
## Key Features
1. **Dollar Value**: Unlike percentage-based indicators, this tool shows the actual dollar amount difference, giving traders a clear understanding of the magnitude of price disparities.
2. **Multi-Exchange Comparison**: By averaging the prices from Binance and Kraken, the indicator provides a more robust baseline for comparison, reducing the impact of single-exchange anomalies.
3. **Clear Visual Representation**: The indicator uses a color-coded histogram for easy interpretation:
- Green bars indicate a premium on Coinbase (Coinbase price is higher)
- Red bars indicate a discount on Coinbase (Coinbase price is lower)
- The height of each bar represents the dollar amount of the premium or discount
4. **Zero Line Reference**: A horizontal line at zero helps quickly distinguish between premium and discount states.
## Use Cases
- **Arbitrage Opportunities**: Identify potential arbitrage opportunities between exchanges.
- **Market Sentiment**: Gauge institutional and retail investor sentiment, as Coinbase is often associated with US institutional activity.
- **Price Prediction**: Use divergences between exchanges as a potential indicator of short-term price movements.
- **Risk Management**: Understand the pricing landscape across major exchanges to make more informed trading decisions.
This indicator is valuable for both short-term traders looking for quick opportunities and long-term investors wanting to understand market dynamics. By providing a clear, dollar-based view of inter-exchange price differences, the Coinbase Dollar Premium Indicator offers unique insights into the cryptocurrency market's microstructure.
*Note: This indicator is for informational purposes only and should not be considered financial advice. Always conduct your own research and consider your risk tolerance before trading.*

LONG/SHORT PIFRO que esse indicador faz?
Esse indicador tem o objetivo de plotar o valor de Premium Index e Funding Rate de qualquer token que seja negociado nos futuros da Binance. Basta acessar o token, por exemplo "BTCUSDT" ou "BTCUSDT.P" e o indicador funcionará de forma automática.
A ideia de leitura desse indicador é verificar as maiores oscilações e aliar a analise técnica para tomar uma decisão de compra ou venda.
What does this indicator do?
This indicator aims to plot the Premium Index and Funding Rate value of any token that is traded on Binance futures. Just access the token, for example "BTCUSDT" or "BTCUSDT.P" and the indicator will work automatically.
The idea of reading this indicator is to check the biggest fluctuations and combine technical analysis to make a buy or sell decision.
=============
O que é o Índice Bitcoin Premium?
O índice Bitcoin Premium rastreia o prêmio ou desconto dos contratos perpétuos de Bitcoin em relação ao preço do índice à vista por minuto. O Índice de prêmio é baseado na diferença de preço entre o último preço negociado de um contrato perpétuo e o preço do índice à vista. O preço do índice à vista é um índice à vista ponderado pelo volume, o que significa um preço médio obtido em várias bolsas.
Basicamente, ele mostra para cada criptomoeda se o mercado à vista está negociando acima ou abaixo do contrato perpétuo. O valor pode ser superior, inferior ou igual a 0. Quando o valor está acima de 0, o contrato perpétuo está sendo negociado acima do “preço de referência”, quando o valor está abaixo de 0, o índice à vista está negociando acima do contrato perpétuo .
Como ler o índice premium do Bitcoin?
Existem várias maneiras de visualizar o Índice Bitcoin Premium. Você pode observar o valor (acima ou abaixo de 0) semelhante às taxas de financiamento ou pode observar certos extremos. Esta informação pode ser muito útil na sua estratégia de negociação. O gráfico é exibido como um gráfico de velas com um corpo e o pavio (também conhecido como sombra) da vela. O pavio pode mostrar um certo extremo, enquanto o fechamento da vela mostra o valor.
O valor acima ou abaixo de 0 mostra se o preço dos contratos perpétuos de Bitcoin está sendo negociado acima ou abaixo do índice à vista. Quando o índice à vista está sendo negociado em alta, o prêmio cai abaixo de 0 e fica negativo, geralmente, isso é conhecido como um sinal de alta. Quando o valor está sendo negociado acima de 0 e fica positivo, significa que o contrato perpétuo do Bitcoin está sendo negociado acima do índice à vista, geralmente isso é visto como um sinal de baixa.
Os mercados são um reflexo das emoções humanas e muitas vezes, antes que o preço possa mudar, vemos um certo extremo nas emoções. Esse extremo pode ser identificado no Índice Premium. Quando temos um sinal extremo no Índice Bitcoin Premium as chances de uma reversão aumentam. Esta pode ser uma reversão de curto prazo ou uma reversão maior.
Resumindo, um prêmio de índice à vista é geralmente de alta e um prêmio de derivativos é geralmente um sinal de baixa.
Mas, tal como acontece com as taxas de financiamento, por vezes demora um pouco para que essa pressão de compra ou venda seja expressa no preço e, portanto, é sempre importante combinar esta métrica com outras métricas, como a estrutura de preços.
Por exemplo, aqui na imagem abaixo podemos ver uma leitura extrema no índice premium do Bitcoin. Embora várias horas após o evento ainda vejamos a subida do preço, vemos que está bastante perto de uma reversão e, eventualmente, o preço muda.
Descrição por whaleportal
What is the Bitcoin Premium Index?
The Bitcoin Premium index tracks the premium or discount of Bitcoin perpetual contracts relative to the spot index price per minute. The premium Index is based on the difference in price between the last traded price of a perpetual contract and the spot index price. The spot index price is a volume- weighted spot index, which means an average price taken from multiple exchanges.
Basically, it shows you for each cryptocurrency whether the spot market is trading higher or lower than the perpetual contract. The value can either be above, below, or equal to 0. When the value is above 0, the perpetual contract is trading higher than the “mark price”, when the value is below 0 the spot index is trading higher than the perpetual contract.
How to read the Bitcoin premium index?
There are multiple ways to view the Bitcoin Premium Index. You can either look at the value (above or below 0) similar to the funding rates or you can look at certain extremes. This information can be very helpful in your trading strategy. The chart is displayed as a candlestick chart with a body and the wick (also known as shadow) of the candle. The wick can show a certain extreme, while the close of the candle shows the value.
The value, either above or below 0 shows whether the price of Bitcoin perpetual contracts is trading higher or lower than the spot index. When the spot index is trading higher, the premium will go below 0 and turns negative, usually, this is known to be a bullish sign. When the value is trading higher than 0 and turns positive, it means the Bitcoin perpetual contract is trading higher than the spot index, usually, this is seen as a bearish signal.
The markets are a reflection of human emotions and often before the price can shift we are seeing a certain extreme in emotions. That extreme can be spotted in the Premium Index. When we have an extreme signal in the Bitcoin Premium Index the chances of a reversal increase. This can be either a short-term reversal or a bigger reversal.
In short, a spot index premium is usually bullish and a derivatives premium is usually a bearish signal.
But as with funding rates, it sometimes takes a moment for that buying or selling pressure to be expressed in the price and therefore it is always important to combine this metric with other metrics like the price structure.
For example, here in the image below we can see an extreme reading in the premium index on Bitcoin. Although in several hours after the event we still see the price climb, we do see that it’s rather close to a reversal and eventually the price turns around.
Description by whaleportal

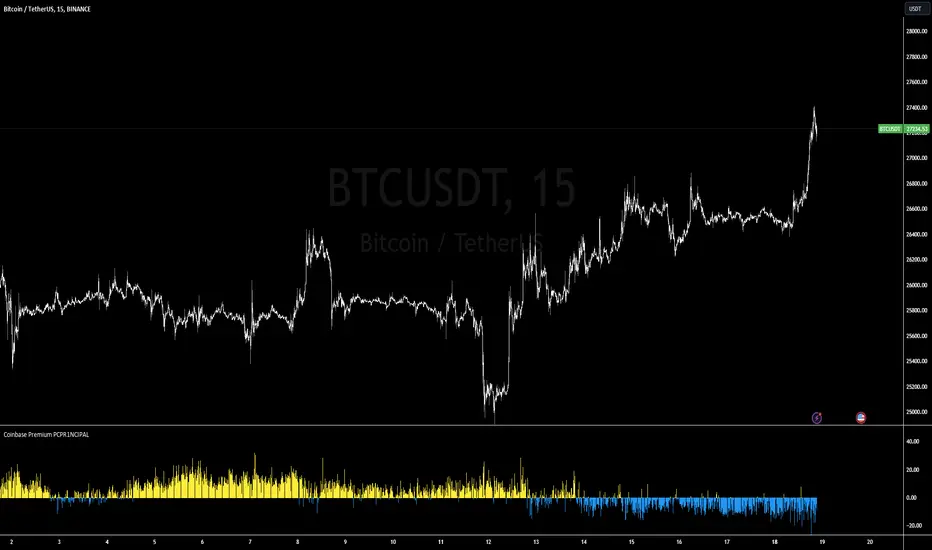
Coinbase/Binance Premium Histogram PCPR1NCIPALSummary of the "Coinbase/Binance Premium Histogram" Indicator:
The "Coinbase/Binance Premium Histogram" is a custom indicator developed for trading platforms that support the Pine Script language, primarily TradingView. Its primary function is to visualize the price differential or "premium" between Bitcoin's (BTC) price on two major exchanges: Coinbase and Binance.
Key Features:
Data Sources: The indicator pulls the closing prices of Bitcoin (BTC) from both the Coinbase (BTCUSD) and Binance (BTCUSDT) exchanges.
Premium Calculation: The indicator computes the premium by subtracting the Coinbase price from the Binance price.
If the result is positive, this means the BTC price on Binance is higher than on Coinbase.
Conversely, if the result is negative, this indicates that the BTC price on Coinbase is higher than on Binance.
Histogram Visualization: The price differential or "premium" is then plotted as a histogram.
Bars above the zero line (in blue) represent instances where the Binance price is higher than the Coinbase price.
Bars below the zero line (in red) represent instances where the Coinbase price is higher than the Binance price.
Color Coding: The histogram uses color coding to easily differentiate between positive and negative premiums:
Blue Bars: Indicate a positive premium, meaning BTC on Binance is priced higher than on Coinbase.
Red Bars: Indicate a negative premium, implying BTC on Coinbase is priced higher than on Binance.
Purpose: Traders and investors can use this indicator to spot potential arbitrage opportunities between the two exchanges or for signs of institutional buying. A significant difference in prices could mean a chance to buy BTC cheaper on one platform and sell at a higher price on the other, thereby capitalizing on the price disparity. However, it's essential to consider transaction fees, potential transfer delays, and other associated risks before pursuing any arbitrage strategy.
Blackrock Spot ETF Premium BTCUSD (COINBASE) V1I created an indicator that takes the spot BTC/USD pair from major exchanges and compares it to the Spot BTC/USD pair on Coinbase that institutions will use for their Spot ETFs.
Blackrock Spot ETF Premium BTCUSD (COINBASE)
I suspect we will see a new "Kimchi Premium" where the Spot ETF pressures from institutions will raise the Coinbase Bitcoin price by a factor of 10-50% premium to the other exchanges.
Naturally excess coins from other exchanges will flow into Coinbase to capture this.
This indicator should be good for some time until one of the other exchanges delist or stop using BTCUSD "spot" If it breaks it I will update it if I remember.
FederalXBT,

BTC Coinbase Premium TrendBTC Coinbase (institutional trader) vs. Binance (retail trader) Premium
Positive values: Coinbase trading at a premium (institutions more bullish than retail)
Negative values: Coinbase trading at a discount (institutions more bearish than retail)
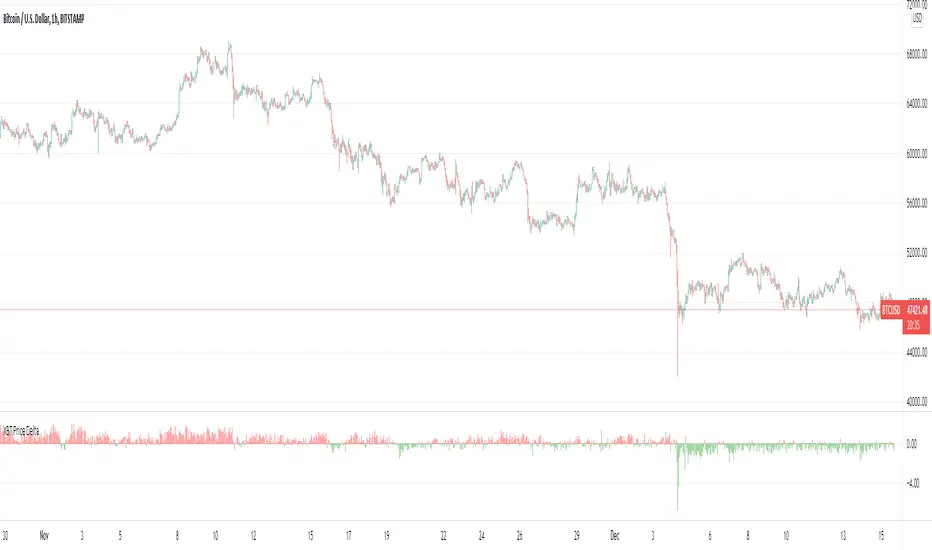
XBT Price DeltaCoinbase spot versus Bybit Perps Indicator
Red = Perps price above Spot price-Perps leading
Green = Spot price above Perps price-Spot Leading
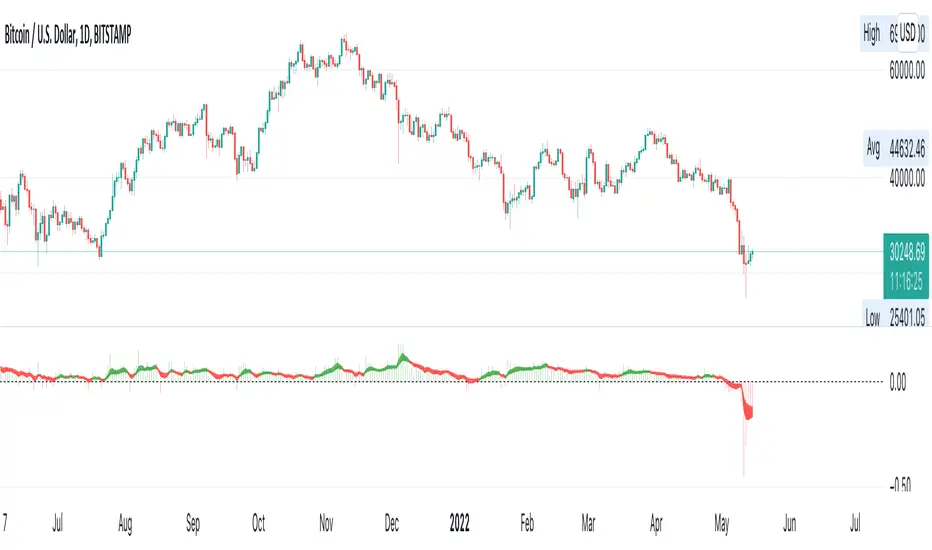
Bitcoin Premium for Bitfinex and Coinbase By CompoundWater
Bitcoin Premium for Bitfinex and Coinbase By CompoundWater
Timing and Application:
When the crypto trend is obviously positive for a long time frame, give short-term investors a reference.
Purpose:
This is for Bitcoin Price between Bitfinex(BFX) and Coinbase(CB)
and give you some hint when to be careful and when to find chance to buy/long BTC.
if
(BFX – CB ) Bitcoin Price:
< 0 will show red line below
> 0 will show green line below
Action:
💀 show (BFX – CB <0 too much): Be care market may be too greed!
💗 show (BFX – CB >0 too much ): Try to find some chance to long BTC!
Why?
There are many big and old players in Bitfinex.
Coinbase may has more small investors and new user.
Data source: Coinbase/Bitfinex BTCUSD
The indicator is recommended to be applied in 4hr timeframes.
Disclaimer: only for learning reference, please consider by yourselves

BTC Premium (Grayscale & Coinbase)This indicator plots the bitcoin premium on Grayscale and Coinbase in %.

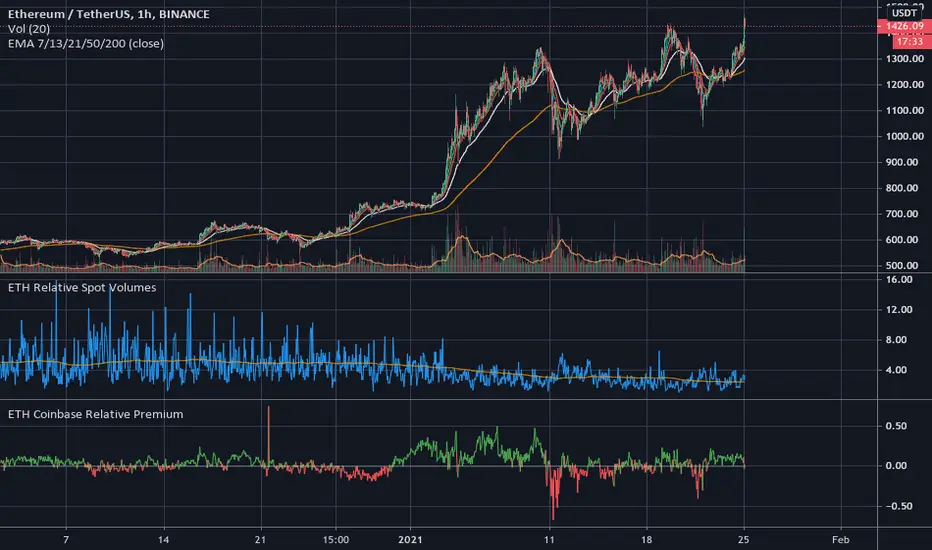
ETH Coinbase Relative PremiumIndicates the relative price premium on Coinbase ETHUSD market against Binance ETHUSDT market.
A great indicator for spotting US-driven spot buying.
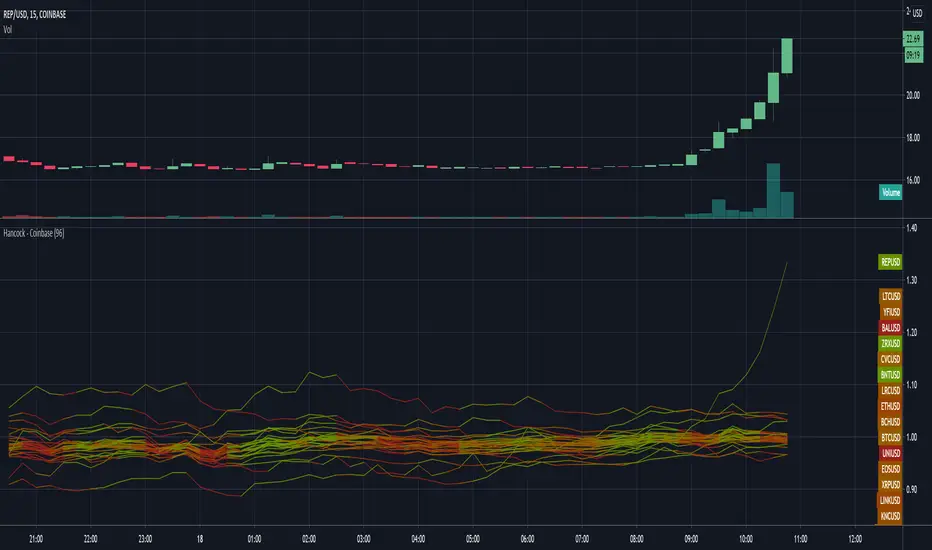
Hancock - CoinbaseSimple script aggregating normalised to 12 hour close average of coinbase tickers.
Hancock
RSI + MFI - Crypto Bull and Bear market A fancy styled version of the RSI (Relative Stochastic Index) + MFI (Money Flow Index) oscillators in order to emphasize buy and sell opportunities.
The 80 and 20 Bands are meant to be used in Bull or Bear markets. Better performing in D timeframes.
The circles represent the cross between RSI and MFI .
Designed for Crypto Markets
Thanks @micheleprandina
Credits:

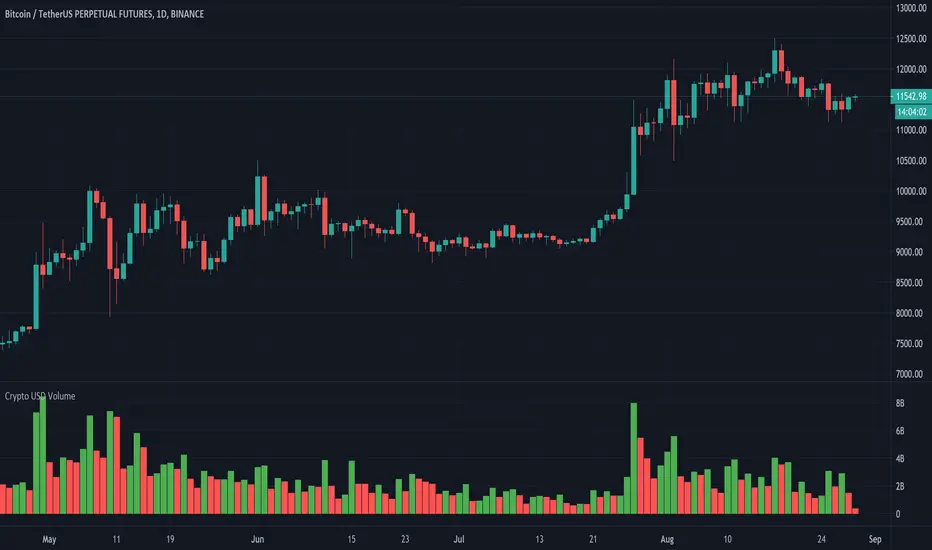
Crypto USD VolumeOften times I need to check the volume in cryptocurrency exchanges and I find myself checking which type of volume I am looking at, I need to manually make sense what the data is and converting it into USD volume which I end up going to CoinMarketCap website to verify whether my calculation is right.
Today I thought it was about time I created an automatic way to find the volume in USD Dollars. This is what this script does.
1 - It removes the base currency from the symbol (e.g., "BTCUSD", it would remove "BTC", leaving us with the "USD" part.). This is important because it helps us identify the currency the pair uses.
2 - It has different pair's variables, each is given a specific currency that the final volume is calculated from. (BTC, ETH, BNB and USD are the default currencies, for other ones, it must be added manually).
This works with all crypto symbols that include BTC, ETH, BNB and USD as currencies. If you modify it, please make sure to compare data with the exchange's one.

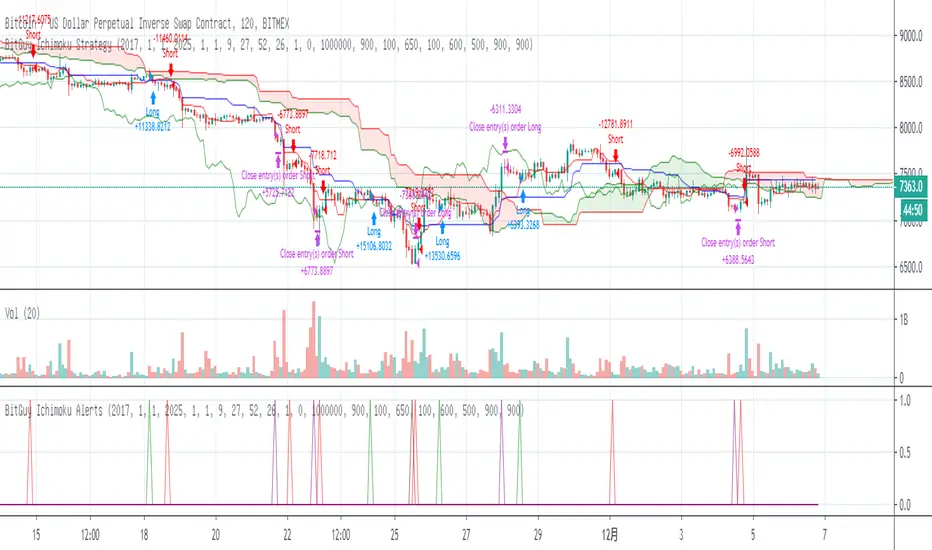
BITMEX Bybit binance HUOBI OKCOIN BTC Ichimoku TREND AlertsBITMEX Bybit binance HUOBI OKCOIN BTC Ichimoku TREND Alerts
This is a very effective trend strategy.
Strategy principle
HOW TO USE
set long position when a green arrow appears in the chart.
set short position when a red arrow appears in the chart.
For the long position and the short direction, you can set the stop profit & stop loss or trailing profit stop & trailing stop loss respectively.
When a purple arrow appears to close a position, an aggressive trader can go in the opposite direction when it is purple.
Strategy applicability
The default setting is for bitmex perpetual swap contract XBTUSD , bybit BTCUSD perpetual futures contract ,binance btcusdt Spot,Bitfinex BTCUSD Spot,bitflyer BTCJPY Spot,bithumb BTCKRW Spot,bitso BTCMXN Spot, bitstamp BTCUSD Spot,bittrex BTCUSDT Spot,Coinbase BTCUSD spot, deribit BTCPERP perpetual futures contract,gemini BTCUSD Spot,Hitbit BTCUSDT Spot,huobi BTCUSDT Spot KRAKEN XBTUSD spot,OKCOIN OKEX BTCUSD3M BTCUSD BTCUSD2W,Poloniex BTCUSDT Spot etc btc symbol with 30 minutes timeframe.
This indicator has broad applicability and can be applied to multiple different symbols.
This indicator also applies to the ETHUSD symbol etc, just adjust the default configuration.
Using the alert of the indicator, it can work well on the trading robot like Gunbot,autoview, without repaint false signals.
这是非常有效的趋势策略。
如何使用
在图表中出现绿色箭头就做多。
在图表中出现红色箭头就做空。
对于多头头寸和空头方向,您可以分别设置止损和止损或尾随利润止损和尾随止损;当出现紫色箭头时平仓,激进的交易者,可以在紫色时就做反方向。
策略适用性
默认设置是针对bitmex交易所 XBTUSD永久掉期合约,BYBIT交易所 BTCUSD永续期货合约,binance币安交易所 btcusdt现货,Bitfinex交易所 BTCUSD现货,bitflyer交易所 BTCJPY现货,bithumb交易所 BTCKRW现货,bitso交易所 BTCMXN现货,bitstamp交易所 BTCUSD现货,bittrex交易所 BTCUSDT现货,Coinbase交易所 BTCUSD现货,deribit交易所 BTCPERP永续期货合约,gemini双子星交易所 BTCUSD现货,Hitbit交易所 BTCUSDT现货,huobi火币交易所 BTCUSDT现货,KRAKEN交易所 XBTUSD现货,OKCOIN OKEX交易所 BTCUSD3M OK BTC季度合约 BTCUSD BTCUSD2W OK BTC次周合约,Poloniex BTCUSDT现货等2小时区间的btc交易。
Bitmex XBTUSD 2H 比特币期货 2 hours Bitcoin Futures
这个指标具有广泛的适用性,可以适用多个不同交易品种。
该指标还适用于ETHUSD,ETHBTC,ADABTC,TRXBTC,XRPBTC交易品种等,只需调整默认配置即可。
Bitmex ETHUSD 2H 以太币合约
binance ADABTC 2H
Binance ETHBTC 90 minutes 分钟
Binance TRXBTC89 minutes 分钟
Binance XRPBTC 90 minutes 分钟
使用该指标的警报设置,它可以在自动交易机器人上很好地工作,而无重绘错误的信号。