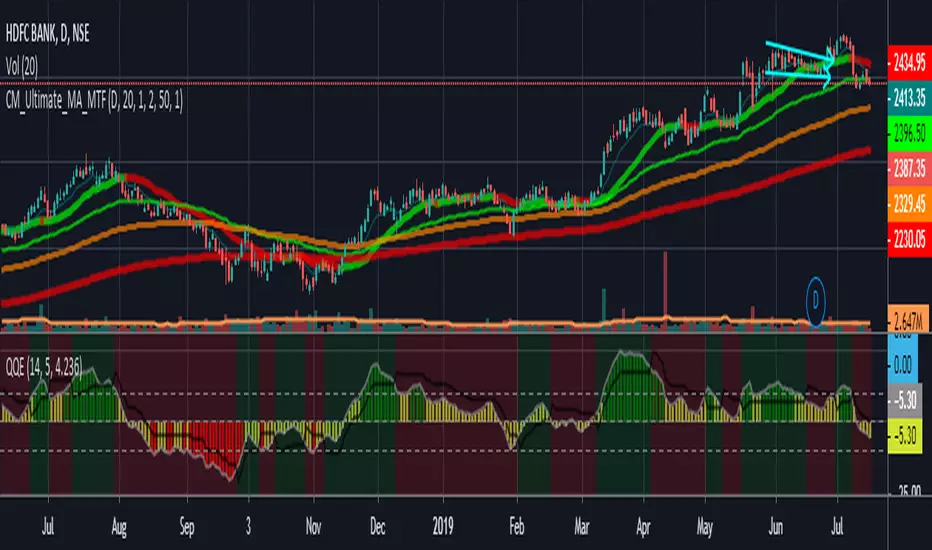
_CM_Ultimate_MA_MTF_V4***For a Detailed Video Overview Showing all of the Settings...
Click HERE to View Video
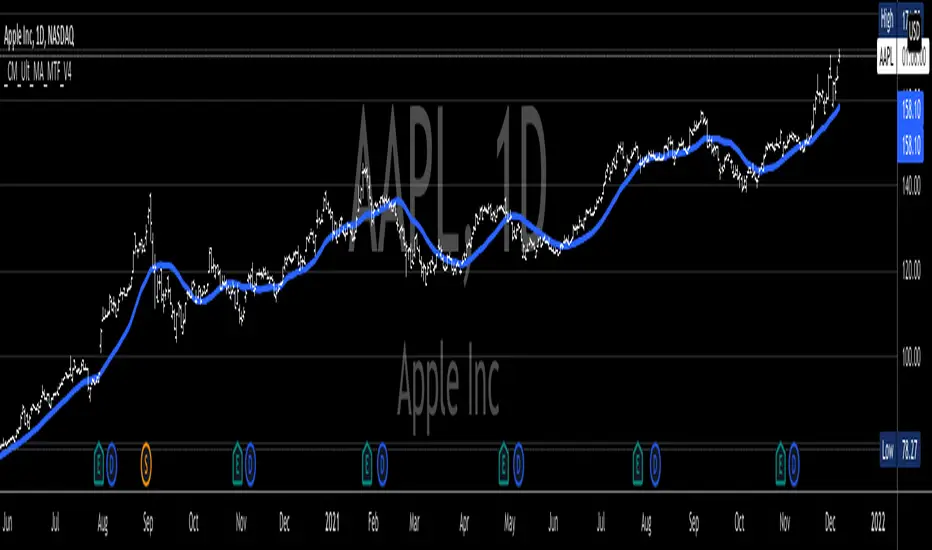
New _CM_Ultimate_MA_MTF_V4 - Update - 08-24-2021
Thanks to @SKTennis for help with code
Added Ability to Plot 1 or 2 Moving Averages - Fast MA & Slow MA
Added Ability to Plot Fast MA with Multi TimeFrame
Added Ability to Plot Slow MA with Multi TimeFrame
Added Ability to Color Fast MA Based on Slope of MA
Added Ability to Color Fast MA based on being Above/Below Slow MA
Added Ability to Plot 8 Types of Moving Averages
Simple, Exponential, Weighted, Hull, VWMA, RMA, TEMA, & Tilson T3
Added Ability to Set Alerts Based on:
Slope Change in the Fast MA Or Fast MA Crossing Above/Below Slow MA.
Added Ability to Plot "Fill" if Both Moving Averages are Turned ON
Added Ability to control Transparency of Fill
Added Alerts to Settings Pane.
Customized how Alerts work. Must keep Checked in Settings Pane, and When you go to Alerts Panel, Change Symbol to Indicator (_CM_Ultimate_MA_MTF_V4)
Customized Alerts to Show Symbol, TimeFrame, Closing Price, & Moving Average Signal Name in Alert
Alerts are Pre-Set to only Alert on Bar Close
See Video for Detailed Overview
New Updates Coming Soon!!!
***Please Post Feedback and Any Feature Requests in the Comments Section Below***
Chrismoody
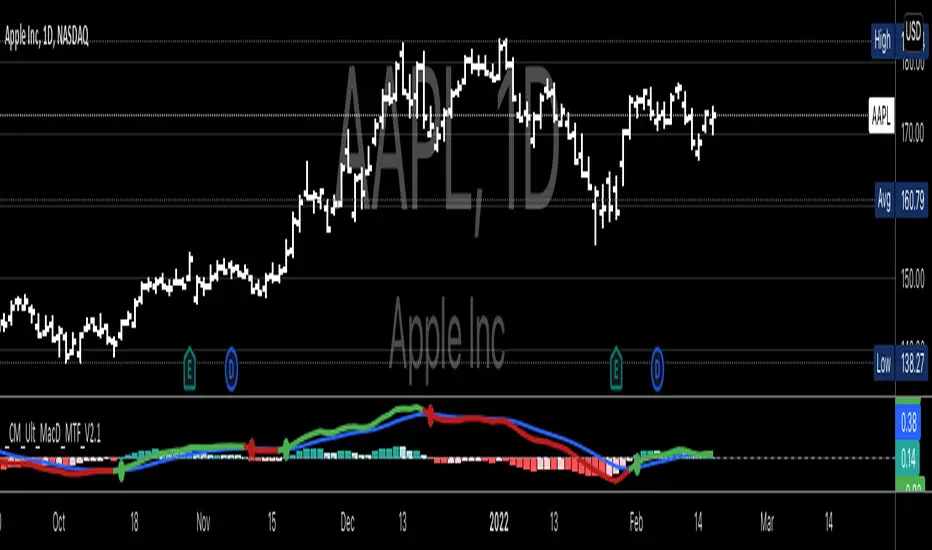
CM MACD Custom Indicator - Multiple Time Frame - V2***For a Detailed Video Overview Showing all of the Settings...
Click HERE to View Video
New _CM_MacD_Ult_MTF _V2 Update 07-28-2021
Thanks to @SKTennis for help in Updating code to V2
Added Groups to Settings Pane.
Added Color Plots to Settings Pane
Switched MTF Logic to turn ON/OFF automatically w/ TradingView's Built in Feature
Updated Color Transparency plots to work in future update
Added Ability to Turn ON/OFF Show MacD & Signal Line
Added Ability to Turn ON/OFF Show Histogram
Added Ability to Change MACD Line Colors Based on Trend
Added Ability to Highlight Price Bars Based on Trend
Added Alerts to Settings Pane.
Customized how Alerts work. Must keep Checked in Settings Pane, and When you go to Alerts Panel, Change Symbol to Indicator (CM_Ult_MacD_MTF_V2)
Customized Alerts to Show Symbol, TimeFrame, Closing Price, MACD Crosses Up & MACD Crosses Down Signals in Alert
Alerts are Pre-Set to only Alert on Bar Close
See Video for Detailed Overview
New Updates Coming Soon!!!
***Please Post Feedback and Any Feature Requests in the Comments Section Below***
MacD Custom Indicator (updated to version 4)I updated existing script “ MacD Custom Indicator-Multiple Time Frame+All Available Options! ” originally created by ChrisMoody to Pine Script 4. version, so you can use it within your own strategy for algotrading or trading bots.

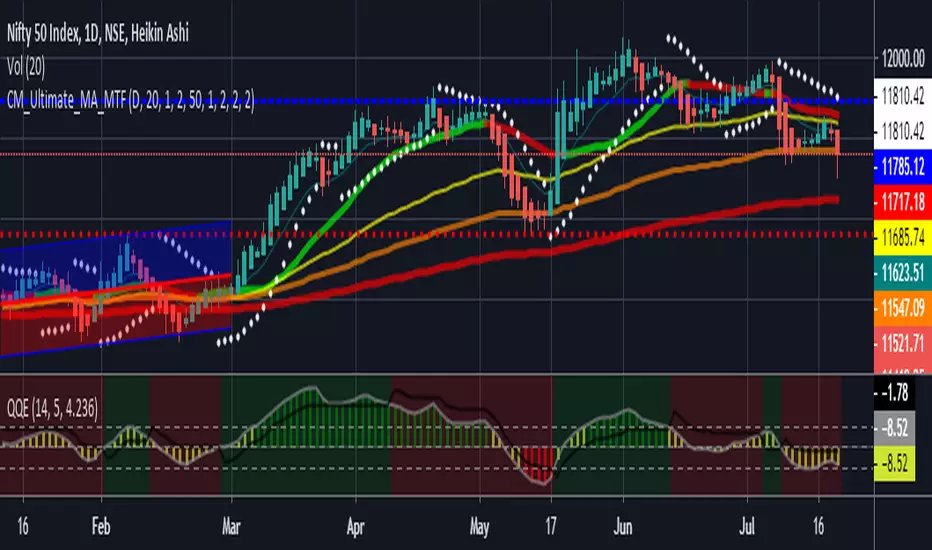
Ultimate_MA_MTF_CMChrisMoody MTF Ultimate Moving Average combined
with Exponential Moving Averages with Price line, i needed to analyze stocks
I have added 50, 100, 200 Period Moving Average to Chrismoody's UMA_MTF
Chris's MA can be found at
i have just combined these averages in a script major contribution goes to chris not me
please look at his indicator still is million times better than me
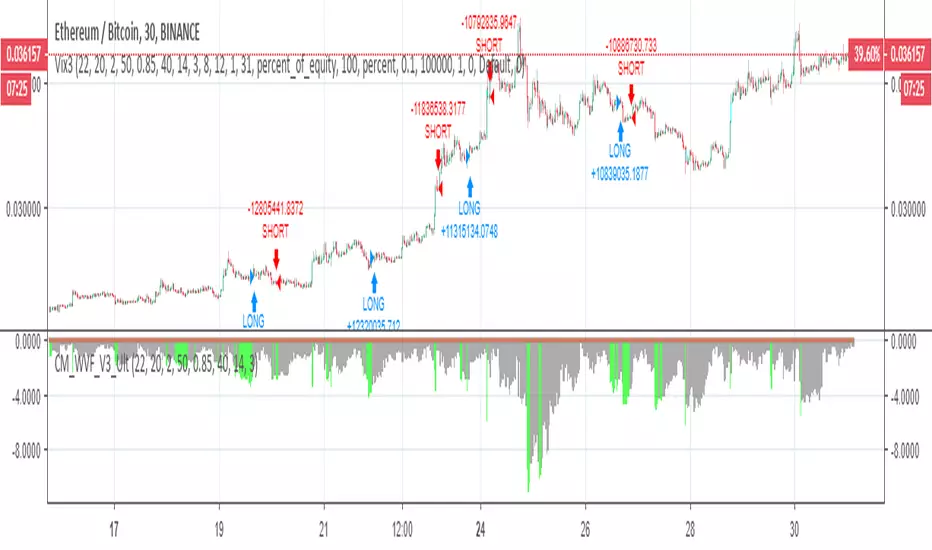
CM Vix V3 Strategy ChrisMoody developed an indicator VIX , I combined it with DEMA and share here for a long time ago ( )
I wanted to share this indicator's version 3 as a strategy. If you like it, we can combine it with other indicators together.
Ice Yolo RSI Public//Created By ChrisMoody on 8/15/2014
//Uploaded By Iceberg on 6/13/2018
//This script allovvs you to set up to 3 different length RSI at the same time. I usually use tvvo.
//Chris removed his script and someone asked mine. I simplified a lot of lines.
//This script shovvs highlighted background vvhen your First RSI is in oversold or overbought zone, and flashes vvhen
//it crosses the lines. You can use it to check crossings or bounces of different lengths too.
//The settings highly depends on your Timeframe AND trading style. So make sure they match you as you like. I don't recommend using
//the default ones! Thanks for using, and thanks again Chris Moody!

CM_Guppy_EMA Revised by JustUncleLThis is an updated version of script created By ChrisMoody to use Daryl Guppy EMA's.
30-Aug-2017 Revisions by JustUncleL
Added Optional Alert Arrows
Added Alertcondition to generate signals for Alarm Subsystem.
Changed some default colours.
CMs Original script and details can be found here:

CM_Donchian Channels V3 revised by JustUncleLThis is a revised version of Chris Moody's "CM_Donchian Channel Modified_V2" script.
ChrisMoody:
"Modified Donchian Channel with separate adjustments for upper and lower levels. Purpose is if you expect big move up, use lower input for example 3 or 4, and longer upper input, eg. 40 - 100 and use lower input line as a stop out. Opposite if you expect big move down. Mid Line Rule in Long Example: If lower line is below entry take partial profits at Mid Line and move stop to Break even. If Lower line moves above entry price before price retraces to midline use Lower line as Stop...Opposite if Shorting."
V3 Revisions by JustUncleL 23-Aug-2017:
Change alert to use alertcondition
Upgraded to Version3 Pinescript.
Moved all breakout arrows to bottom of screen
Added bar colouring patch.
Changed some defaults.

Vix FIX / StochRSI StrategyThis strategy is based off of Chris Moody's Vix Fix Indicator . I simply used his indicator and added some rules around it, specifically on entry and exits.
Rules :
Enter upon a filtered or aggressive entry
If there are multiple entry signals, allow pyramiding
Exit when there is Stochastic RSI crossover above 80
This works great on a number of stocks. I am keeping a list of stocks with decent Profit Factors and clean equity curves here .
Possible ways to use this:
Modify this script and setup alerts around the various entries
Use as is with different stocks or currency pairs
Modify entry / exit points to make it more profitable for even more symbols and currencies

QG3 HistogramColor coded Histogram based on moving average cross overs, shows positive and negative divergence very well.
Edited by Enkindel, original code by ChrisMoody, QG3 system by QuadG
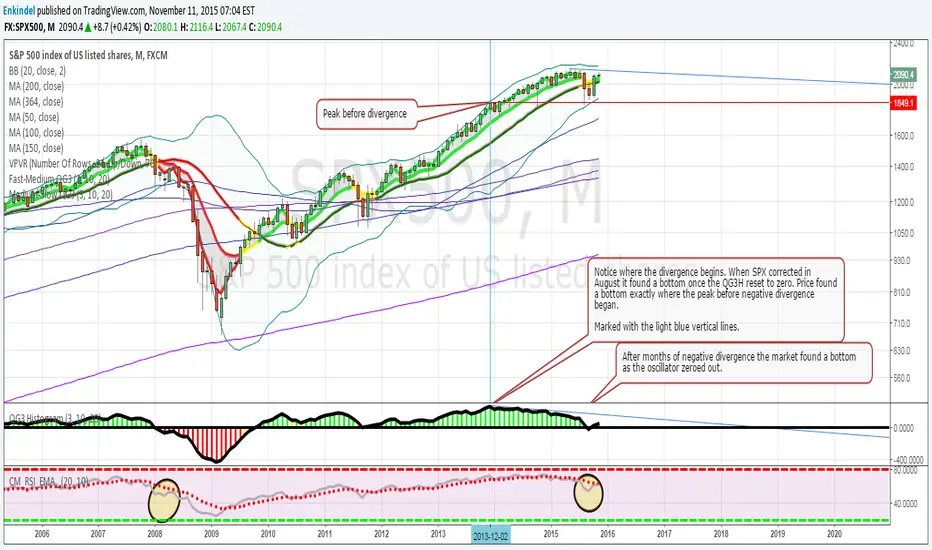
Medium-Slow QG3Color coded moving average cross overs.
Edited by Enkindel, original code by ChrisMoody, QG3 system by QuadG

Fast-Medium QG3Color coded moving average cross overs.
Edited by Enkindel, original code by ChrisMoody, QG3 system by QuadG

CM Stochastic POP Method 2-Jake Bernstein_V1Yesterday Jake Bernstein authorized me to post his updated results with the Stochastic Pop Trading System he developed many years ago.
You can take a look at the Original System with Updated Settings at
This indicator is a different set of rules Jake mentioned in the PDF he allowed me to post.
To view the PDF use this link:
dl.dropboxusercontent.com
Today we’re releasing the version described in the PDF that uses the StochK values of 55, 50, and 45. The rules are discussed in the PDF but here is a simple breakdown:
Enter Long when StochK is below 50 and Crosses Above 55
Exit Long on Cross Below 55
Enter Short when StochK is Above 50 and crosses Below 45
Exit Short on Cross Above 45
Two Important Items to understand about this method:
To code the rules Precisely we need a function that will be available when Strategy Capabilities are released on TradingView.
There is one of Jakes Profit Maximizing Strategies that needs to be integrated with this code…which again we need the Strategy based Function that will be coming soon.
To Compare this system to the Stochastic Pop Method 1 System shown yesterday at I used the same Symbol and dates for you to compare…but remember to give this Method 2 System a Fair Look/Evaluation…we need the Soon To Be Released…TradingView Strategy Capabilities.
BackTesting Results Example: EUR-USD Daily Chart Since 01/01/2005
Strategy 1 – Stochastic Pop Method 2 System:
Go Long When Stochasticis below 50 and Crosses Above 55. Go Short When Stochastic is above 50 and Crosses Below 45. Exit Long/Short When Stochastic has a Reverse Cross of Entry Value.
Results:
Total Trades = 151
Profit = 40,758 Pips
Win% = 37.1%
Profit Factor = 1.26
Avg Trade = 270 Pips Profit
***Most Consecutive Wins = 4 ... Most Consecutive Losses = 7
Strategy 2:
Rules - Proprietary Optimization Jake Will Teach. Only Added 1 Additional Exit Rule.
Results:
Total Trades = 151
Profit = 60.305 Pips
Win% = 37.1%
Profit Factor = 1.38
Avg Trade = 399 Pips Profit
***Most Consecutive Wins = 4 ... Most Consecutive Losses = 7
Indicator Includes:
-Ability to Color Candles (CheckBox In Inputs Tab)
Green = Long Trade
Blue = No Trade
Red = Short Trade
Jake Bernstein will be a contributor on TradingView when Backtesting/Strategies are released. Jake is one of the Top Trading System Developers in the world with 45+ years experience and he is going to teach TradingView.com’s community how to create Trading Systems and how to Optimize the correct way.
Link To PDF:
dl.dropboxusercontent.com
Link to Original Version of Indicator with Updated Settings.

CM Stochastic POP Method 1 - Jake Bernstein_V1A good friend ucsgears recently published a Stochastic Pop Indicator designed by Jake Bernstein with a modified version he found.
I spoke to Jake this morning and asked if he had any updates to his Stochastic POP Trading Method. Attached is a PDF Jake published a while back (Please read for basic rules, which also Includes a New Method). I will release the Additional Method Tomorrow.
Jake asked me to share that he has Updated this Method Recently. Now across all symbols he has found the Stochastic Values of 60 and 30 to be the most profitable. NOTE - This can be Significantly Optimized for certain Symbols/Markets.
Jake Bernstein will be a contributor on TradingView when Backtesting/Strategies are released. Jake is one of the Top Trading System Developers in the world with 45+ years experience and he is going to teach how to create Trading Systems and how to Optimize the correct way.
Below are a few Strategy Results....Soon You Will Be Able To Find Results Like This Yourself on TradingView.com
BackTesting Results Example: EUR-USD Daily Chart Since 01/01/2005
Strategy 1:
Go Long When Stochastic Crosses Above 60. Go Short When Stochastic Crosses Below 30. Exit Long/Short When Stochastic has a Reverse Cross of Entry Value.
Results:
Total Trades = 164
Profit = 50, 126 Pips
Win% = 38.4%
Profit Factor = 1.35
Avg Trade = 306 Pips Profit
***Most Consecutive Wins = 3 ... Most Consecutive Losses = 6
Strategy 2:
Rules - Proprietary Optimization Jake Will Teach. Only Added 1 Additional Exit Rule.
Results:
Total Trades = 164
Profit = 62, 876 Pips!!!
Win% = 38.4%
Profit Factor = 1.44
Avg Trade = 383 Pips Profit
***Most Consecutive Wins = 3 ... Most Consecutive Losses = 6
Strategy 3:
Rules - Proprietary Optimization Jake Will Teach. Only added 1 Additional Exit Rule.
Results:
Winning Percent Increases to 72.6%!!! , Same Amount of Trades.
***Most Consecutive Wins = 21 ...Most Consecutive Losses = 4
Indicator Includes:
-Ability to Color Candles (CheckBox In Inputs Tab)
Green = Long Trade
Blue = No Trade
Red = Short Trade
-Color Coded Stochastic Line based on being Above/Below or In Between Entry Lines.
Link To Jakes PDF with Rules
dl.dropboxusercontent.com

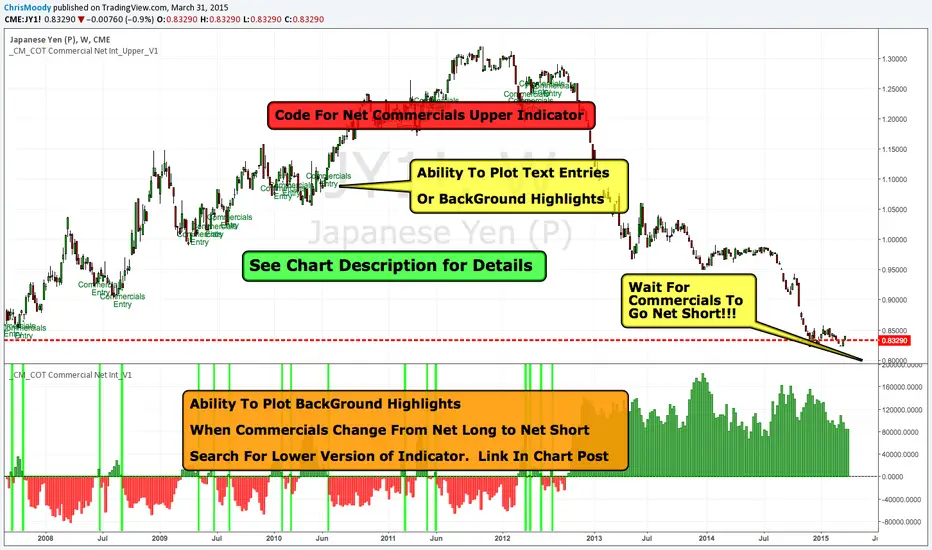
_CM_COT Commercial Net Interest_Upper_V1Overview.
-This is the Beginning of a Educational Series from Jake Bernstein to the TradingView Community.
-Many Traders use the COT Data Incorrectly.
-Jake Discovered if You Look at the Net Commercials and Take Note When Commercials net Buying is Either At All Time Highs, Or Net Buying = Longest Period of Buying Look for an Extreme Move To the Upside.
-In The Future We Will Show Precise Entry Signals…But a Basic Entry Signal Is When Commercials Go From Net Long to Net Short.
-Full Credit in Methodology goes to Jake Bernstein at www.Trade-Futures.com and www.2Chimps.net
Thought Process:
-Commercials Represent Large (Typically Billion Dollar) Companies.
-Take Note - When Commercials Are Buying at Record High
-Take Note - When Commercials Are Buying For Record Long Periods of Time
***Note…Commercials Can Buy For Extended Periods Dollar Cost Averaging…
***Basic Entry Listed In Overview.
***More Precise Entries Will Be Introduced Soon.
Indicator Shows Net Commercials
-Full Credit goes to Greeny for Creating Original Code. I only made slight modifications.
Modifications include
-Added Ability to Plot Text Entries when Commercials Switch From Net Long To Short
-Added Optional Background Highlighting when Commercials Switch from Long to Short
-Added Optional Alert Capability If Commercials Go From Net Long to Short
***Additional Indicators and Updates Coming Soon
***Link To Lower Indicator:
_CM_COT Commercial Net Interest_V1Overview.
-This is the Beginning of a Educational Series from Jake Bernstein to the TradingView Community.
-Many Traders use the COT Data Incorrectly.
-Jake Discovered if You Look at the Net Commercials and Take Note When Commercials net Buying is Either At All Time Highs, Or Net Buying = Longest Period of Buying Look for an Extreme Move To the Upside.
-In The Future We Will Show Precise Entry Signals…But a Basic Entry Signal Is When Commercials Go From Net Long to Net Short.
-Full Credit in Methodology goes to Jake Bernstein at www.Trade-Futures.com and www.2Chimps.net
Thought Process:
-Commercials Represent Large (Typically Billion Dollar) Companies.
-Take Note - When Commercials Are Buying at Record High
-Take Note - When Commercials Are Buying For Record Long Periods of Time
***Note…Commercials Can Buy For Extended Periods Dollar Cost Averaging…
***Basic Entry Listed In Overview.
***More Precise Entries Will Be Introduced Soon.
Indicator Shows Net Commercials
-Full Credit goes to Greeny for Creating Original Code. I only made slight modifications.
Modifications include
-Took Off Net Long and Short Individual Plots
-Added Optional Background Highlighting when Commercials Switch from Long to Short
-Added Optional Alert Capability If Commercials Go From Net Long to Short
-Ability to Show INVERSE - This makes it Easier for some Traders to See…Since the Signals look similar to MacD/RSI Type Indicators.
***Additional Indicators and Updates Coming Soon
***Link To Upper Indicator:

CM_Williams_Vix_Fix_V3_Upper_Text PlotsWilliams Vix Fix Text Plots! Alert Capable!
Use With Lower Indicator or as Single Indicator!
Has Text Plots For All Plot Types Lower Indicator Uses.
To Get Lower Indicator:
Info On Lower Indicator - Discussion:

CM_Gap_Indicator_Intra-Day_V2.1CM_Gap_Indicator_Intra-Day_V2.1
Updated Intra-Day Gap Indicator.
Version 2.1…Many Additional Features To Come.
***Designed for Intra-Day Charts.
***Great for Stocks…Forex and Futures Sunday Night Gaps.
***Plots Green Lines If Gap Up (See Added Features Below)
***Plots Red Lines If Gap Down
MAJOR Feature Added:
***Added Check Boxes In Inputs Tab That Let’s You Choose if You Want To See All Gaps, Or Only Gaps That Open Above/Below Previous Days High/Low
Other Features Added:
***Gap Mid Lines
***Color Fill Based On Gap Up Or Down
Additional Features Coming!!!

CM_NarrowRange_WideRange_Bars_V1Ever heard of NR2, NR3, NR4, NR7 Strategies?
Version 1 of Narrow Range And Wide Range Bars
Link To Rare Book On Technical Price Patterns!!!
More To Come Once I Go Thru Book.
***While I haven’t read the book yet…Skimming Thru it Shows Great Examples of The Statistics Any Technical Trader Should Know Regarding Their Trading Methodology!!!
Link To PDF - Day Trading With Short Term Price Patterns And Opening Range Breakout.
d.pr

_CM_High_Low_Open_Close_Weekly-IntradayUpdated Indicator - Plots High, Low Open, Close
For Weekly, Daily, 4 Hour, 2 Hour, 1 Hour Current and Previous Sessions Levels.
Updated Adds 4 Hour, 2 Hour, 1 Hour levels for Forex and Intra-Day Traders.

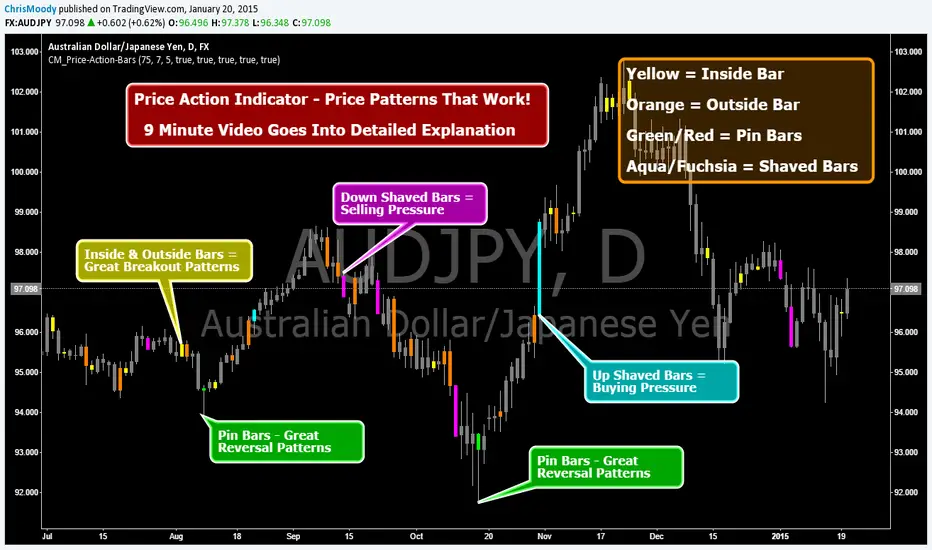
CM_Price-Action-Bars-Price Patterns That Work!Price Action Indicator - Price Patterns That Work!
9 Minute Video Goes Into Detailed Explanation
4 Simple but Effective Price Patterns!
Yellow = Inside Bar – Breakout Patterns
Orange = Outside Bar – Breakout Patterns
Green/Red = Pin Bars
Aqua/Fuchsia = Shaved Bars
***MANY Features and Customizing Options…Detailed Overview In Video.
How To Turn Bars Patterns On And Off.
Ways To Customize.
General Thought Process of the 4 Price Action Patterns.
What Each Setting in the Inputs Tab Does.
***Special Announcement. Video Below Just Updated. Received a Special Promotion from the creator of these Price Action Bars and Many other Price Action Setups. Hedge Fund Manager and Founder of 2ndSkiesForex.com Chris Capre.
1st 10 minutes of Video is covering throughout process and how to implement the Indicators.
2nd 12 minutes covers a Special Promotion offered to TradingView members directly from Chris Capre.
Video Link Below.
vimeopro.com
This Version of the video will be taken down 2/01/2015 and the original video will be uploaded again.
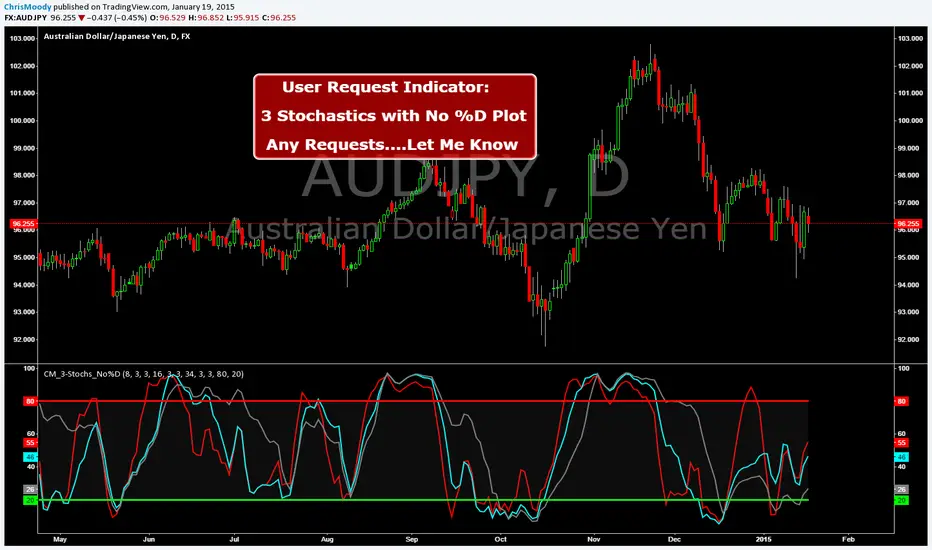
CM_3-Stochastics_No%D_UserRequestCreated By ChrisMoody on 1-19-2014 by User Request
Plots 3 Stochastic Lines.....No %D Lines...by User Request.