Mkt-Viper Edge🔶 Overview
The Mkt-Viper Edge is a specialized market architecture engine designed to map key levels and display the liquidity framework of any asset. It focuses exclusively on Institutional Order Flow and Market Structure analysis to identify high-probability reversal and continuation zones.
Markets do not move randomly; they move from liquidity to liquidity. This indicator automates the complex task of identifying where "Smart Money" has positioned itself. It acts as an X-Ray for your chart—revealing Order Blocks, Fair Value Gaps, Key Support and Resistance levels and Volume areas that are invisible to the naked eye. By visualizing the imbalance between buyers and sellers (Delta) and mapping the breaking points of market structure (BoS/CHoCH), Viper Edge provides the precise "Where" and "Why" behind price movement.
🔶 What makes Mkt-Viper Edge unique?
The Mkt-Viper Edge distinguishes itself by bridging the gap between Price Structure and Institutional Volume. While standard indicators blindly plot pivots and levels based on price alone, Mkt-Viper Edge verifies multiple structural elements against the underlying order flow.
Its Money Flow Matrix engine moves beyond simple "Volume Profiles" by analyzing intra-candle "Wick Pressure." This allows the system to decode the true buying vs. selling intent hidden inside every candle, rather than just aggregating raw data. By cross-referencing this volume data against Key Levels, Order Blocks, and Fair Value Gaps, the system filters out "fake" structure to reveal the high-probability zones where Smart Money is actually active.
Main Features
🔶 Viper Money Flow Matrix
The centerpiece of the system is the Matrix—a next-generation Volume Profile and Liquidity scanner. Instead of simply showing how much volume occurred at a price, the Matrix breaks down the intent of that volume.
The Logic:
The engine scans historical price action (customizable lookback) and categorizes volume into Buying Pressure and Selling Pressure based on "Wick Polarity" logic. It then projects this data as a dashboard on the right side of your chart.
Visuals:
The Wings: The bars extending Left and Right represent the "Delta" (Net Difference) and "Total Liquidity."
Value Area (VA):
The High and Low lines indicate the zone where 70% (Institutional Standard) of the trading activity occurred. Breakouts from this zone can potentially lead to explosive moves.
POC (Point of Control):
The price level with the highest volume node acts as a massive magnet for price.
VWAP: An optional "Anchor VWAP" provides a rolling benchmark for fair value (Daily/Weekly/Monthly).
🔶 Ranked Market Structure (MS)
Understanding the "Bias" is the first step in any trade. The Ranked Market Structure module automates the mapping of Trend Structure using Swing Pivots and ranks them based on how strong the break was.
Features:
External Structure:
Detects major BoS (Break of Structure) and CHoCH (Change of Character) events to define the macro trend.
Internal Structure: (Optional)
Highlights micro-breaks for scalpers looking for entries within the larger leg.
Breakout Grading:
Not all structural breaks are equal. The system automatically grades the "Quality" of every break using a traffic-light system (Green/Yellow/Red circles).
Green:
Indicates a high-momentum, impulsive break (Strong Displacement).
Red:
Indicates a weak break where price barely closed past the level, suggesting a potential lack of follow-through.
🔶 Institutional Order Blocks (OB)
Order Blocks represent footprints where institutions have initiated large positions. This module automatically detects these zones and equips them with a deep-dive data suite, allowing you to validate the conviction behind every level.
Zone Analytics (Volume & Delta):
Every Order Block is generated with an embedded data readout. The system analyzes the specific candle that created the zone and displays:
Total Liquidity:
Displays the absolute volume count (e.g., 2.5M) executed during the zone's creation.
Relative Dominance (%):
Shows the significance of this zone compared to all other active Order Blocks on the chart. If a zone shows "50%," it means it holds half of the total volume of all currently displayed structures, helping you identify the most dominant level.
Net Delta:
A numerical display of the net volume imbalance (e.g., Δ +50K), revealing exactly how aggressive the buyers or sellers were.
Volume Bars:
Visual bars on the edge of the zone showing the exact ratio of Buying vs. Selling pressure.
Strength Grading (S/W):
Not all Order Blocks are created equal. The system automatically grades the quality of every zone by comparing its formation volume against the historical average.
Strong (S):
Marked when the zone was formed on significant volume expansion, indicating high institutional participation.
Weak (W):
Marked when the zone formed on low or declining volume, suggesting less reliability.
Usage:
These zones can potentially be high-probability reversal points. When price returns to a Bullish OB (Green), it is a prime location to look for Long entries.
🔶 Fair Value Gaps (FVG)
Price moves aggressively when liquidity is one-sided, leaving behind "Inefficiencies" or Gaps. The FVG module highlights these specific pockets of imbalance.
The Logic:
The system scans for three-candle patterns where the wicks do not overlap. It draws a zone extending forward until price fills the gap.
Mitigation Tracking:
The engine actively monitors the "Health" of the gap. Specifically, it tracks the 50% (Consequent Encroachment) level. Once price closes beyond the 50% mark of the gap, the zone is considered "Mitigated" and is automatically removed to keep your chart clean.
🔶 Smart Support & Resistance Grid
The Mkt-Viper Edge utilizes a dynamic Support & Resistance engine that evolves in real-time as price action unfolds. Instead of cluttering the chart with every minor turning point, this system builds a high-fidelity grid based on interaction frequency and volume intensity.
Volume-Validated Levels:
The engine includes a built-in Volume Filter that ignores weak structure. A level is only projected if the pivot point was formed with sufficient volume relative to the moving average. This automatically filters out low-conviction "noise" pivots, leaving only the structural levels where real money changed hands.
Dynamic Adaptability:
The grid is not a static drawing; it is a living ecosystem. As price tests and reacts to specific levels, the system updates the grid to reflect the most current market reality, ensuring you are always trading against relevant structure rather than stale data.
Wick Precision:
Users can customize the drawing logic, choosing between "Average Center" (for broad zones) or "Wick Precision" (snapping lines to the exact Highs/Lows) for pinpoint bounce trading.
⚠️ Technical Disclosure: Dynamic Object Regeneration
To ensure the grid remains relevant to the current price action, this module utilizes "Functional Repainting." As new pivot highs and lows are formed and confirmed, the indicator effectively "re-draws" the grid to prioritize the most recent and significant structures. Old or invalidated levels are automatically removed to prevent chart clutter.
🔶 Viper Command Dashboard
For traders who need a macro view, the Command Dashboard provides a real-time "Satellite Link" to multiple timeframes (1m to Daily). Select up to 6 different time frames to view data from.
Data Points:
Structure:
Displays the current Bull/Bear status of the Market Structure logic across all TFs.
Money Flow:
Tracks the Money Flow Index (MFI) to show if volume is expanding or contracting.
Viper Band: (Integration)
Displays the trend status relative to the Viper Band from the Mkt-Viper Pro indicator if you are using the full suite.
Forecast:
Based on the alignment of ADX and EMA trends, the dashboard generates a simplified "Forecast" (Pump, Dump, or Consolidation) to help you align with the dominant momentum.
🔶 Visual Intelligence (Theme Engine)
Visual clarity is essential for rapid decision-making. A cluttered or poorly contrasted chart can lead to cognitive fatigue. To address this, Mkt-Viper Edge features a global Color Theme Engine that instantly synchronizes every element of the suite—signals, candles, clouds, and text—to a unified palette.
The Presets:
The system comes with five professionally designed profiles to suit different trading environments and lighting conditions:
Viper Original: High-contrast Neon Green & Purple (Optimized for Dark Mode).
Classic: Standard Green/Red configuration for traditionalists.
Cool Blues: A calming Blue/Violet palette designed to reduce emotional reactivity.
Ember & Ash: High-warmth Orange/Slate contrast.
Monochrome: Grayscale/Silver logic for distraction-free structural analysis.
Customization:
Traders with specific branding requirements or accessibility needs (such as color blindness) can select "Custom Theme." This unlocks distinct color inputs, allowing you to define your own specific Bullish, Bearish, and Neutral colors that instantly propagate across the entire indicator suite
System Integration
Mkt-Viper Edge is designed to function as the "Structure" module within the wider Mkt-Viper ecosystem. While powerful alone, it is calibrated to work seamlessly with Mkt-Viper Pro (Trend Overlay and Viper Oscillator).
🔶 How to use: The "Edge" Workflow
1. Identify the Bias:
Look at the Smart Structure. Are we making Higher Highs (Bullish BoS)? If the Command Dashboard shows Bullish structure on the Higher Timeframes (H1, H4), look for Longs.
2. Find the Interest Level:
Locate an unmitigated Order Block or FVG that aligns with the trend direction.
3. Validate with Volume:
Check the Money Flow Matrix. Is the POC (Point of Control) sitting near your Order Block? High volume nodes act as "Confluence," increasing the probability of a bounce.
4. Execution: Set your entry at the edge of the Order Block or the 50% mark of the FVG.
🔶 Realistic Expectations & Methodology
The Nature of Liquidity:
Viper Edge identifies where orders were placed historically. While price often reacts to these "Memory" zones, market conditions change. A strong news event can blow through an Order Block without pausing.
Lag vs. Structure:
Market Structure (BoS) is inherently reactive—it requires a candle close to confirm. Therefore, structural signals will always appear after the pivot has formed. This is not "lag" in the traditional sense, but the necessary confirmation of a structural shift.
Object Limit (Technical Disclosure):
TradingView places limits on how many drawing objects (Boxes/Lines) can be on a chart. To ensure performance, Viper Edge uses an active "Garbage Collection" system that deletes the oldest levels once the buffer (default 50-100) is full. This is normal behavior to keep your chart fast and responsive.
---------------------
Disclaimer
The content provided in my scripts, indicators, ideas, algorithms, and systems is for educational and informational purposes only. It does not constitute financial advice, investment recommendations, or a solicitation to buy or sell any financial instruments. I will not accept liability for any loss or damage, including without limitation any loss of profit, which may arise directly or indirectly from the use of or reliance on such information.
All investments involve risk, and the past performance of a security, industry, sector, market, financial product, trading strategy, back test, or individual's trading does not guarantee future results or returns. Investors are fully responsible for any investment decisions they make. Such decisions should be based solely on an evaluation of their financial circumstances, investment objectives, risk tolerance, and liquidity needs.
Changeofcharacter

eBacktesting - Learning: Change of CharactereBacktesting - Learning: Change of Character helps you spot a “Change of Character” (CHoCH) — the moment price stops behaving one way and starts behaving the other.
It does this by tracking clear swing highs and swing lows, then marking the first **candle close** that breaks structure **against** the current move:
- Bullish CHoCH: price shifts from making lower structure to breaking above a key swing high.
- Bearish CHoCH: price shifts from making higher structure to breaking below a key swing low.
Use CHoCH to practice timing: early trend shifts, reversals, and potential new legs — especially when combined with your usual confluence (liquidity, premium/discount, key levels, sessions, etc.).
These indicators are built to pair perfectly with the eBacktesting extension, where traders can practice these concepts step-by-step. Backtesting concepts visually like this is one of the fastest ways to learn, build confidence, and improve trading performance.
Educational use only. Not financial advice.

SMC Trend Reversal by Pooja🌟 SMC Trend Reversal by Pooja — CHoCH + BOS + RSI Confirmation
🔥 Smart Money Concepts • Trend Reversal Detection • Multi-Asset Optimized
The SMC Trend Reversal by Pooja is a powerful market-structure indicator designed for traders who follow Smart Money Concepts (SMC) and want to identify trend reversals, BOS, and CHoCH with high clarity.
It blends pivot-based structure breaks, RSI confirmation, and an optional session filter, giving traders a clean and reliable view of market shifts across Crypto, Forex, Indices, and Equity Derivatives.
✨ 🔰 Why SMC Matters in Crypto & Forex?
Both Crypto and Forex markets:
Trade 24/7 / 5 days with high volatility
React strongly to liquidity zones, market structure shifts, and smart money footprints
Often reverse sharply after liquidity grabs
Follow clean CHoCH → BOS → Trend progression sequences
This is why CHoCH (Change of Character) and BOS (Break of Structure) are crucial tools used by professional SMC traders to catch early trend reversals.
This indicator automates that process for you.
No clutter. No repaints. No noise.
Just pure SMC structure.
🚀 Key Features
🟣 CHoCH Detection (Change of Character)
Detects when the market shifts direction
A CHoCH appears when the trend flips from down → up or up → down
Highlights the earliest sign of a trend reversal
Draws a clean CHoCH line across structure
Works beautifully in volatile markets like Crypto & Forex
🔵 BOS Detection (Break of Structure)
Identifies structural continuation in the same direction
Helps confirm the new trend after CHoCH
Clear BOS lines to visualize progression of market flow
Ideal for trend-following and breakout traders
🧠 RSI-Based Confirmation (Optional)
To avoid fake CHoCH signals, the indicator uses RSI filtering:
RSI > Upper Level → Show “B” Buy Label
RSI < Lower Level → Show “S” Sell Label
This improves accuracy especially in:
Fast crypto markets (BTC, ETH, SOL etc.)
Liquidity-driven assets (Forex, Indices)
⏱️ Session Block (Asia/Kolkata Compatible)
Avoid signals in the first few minutes of market open or in volatile windows.
Block signals in a selected time range
Perfect for Indian market opening volatility (09:00–09:25)
🎯 Clean, Minimal, Easy-to-Read Visuals
✔ Horizontal structural lines
✔ Color-coded CHoCH and BOS
✔ Buy (B) / Sell (S) labels only when meaningful
✔ No unnecessary clutter
✔ Suitable for both beginners and advanced SMC traders
📢 Built-In Alerts
Receive notifications for:
🔔 Bullish CHoCH
🔔 Bearish CHoCH
🔔 Bullish BOS
🔔 Bearish BOS
Perfect for mobile, desktop, and webhook automation.
📈 How It Helps Your Trading
✔ Catch early trend reversals with confidence
✔ Avoid false signals with RSI filtering
✔ Trade like Smart Money (Institutional concepts)
✔ Works on all timeframes — scalping to swing
✔ Specially powerful on Crypto & Forex due to their structure-driven nature
✔ Cleaner charts → Better decisions → Higher probability trades
🧩 Who Should Use This Indicator?
✔ SMC / ICT style traders
✔ Breakout and trend-following traders
✔ Reversal traders
✔ Crypto & Forex scalpers
✔ Option buyers looking for early trend shifts
✔ Intraday NIFTY / BANKNIFTY traders
⚠️ Disclaimer
This indicator is for educational purposes and market analysis only.
It does not guarantee profits. Always practice risk management and test your settings before using it live.

Precision Structure Pro [BOSWaves]Precision Structure Pro - Multi-Tier Market Structure Execution with HTF Trend Alignment
Overview
Precision Structure Pro is a market analysis system designed to provide traders with structural understanding of price action. The system operates on the principle that markets follow observable patterns that can be systematically identified and interpreted. Precision Structure Pro combines adaptive indicators, dynamic visualizations, and customizable alerts to support both trend-following and contrarian strategies. Each feature translates technical concepts into actionable, on-chart insights, allowing traders to make informed decisions without information overload. The system emphasizes clarity, precision, and adaptability, enabling users to interpret market behavior in real time with risk-aware, disciplined trading practices.
Structural Analysis Engine
At the core of Precision Structure Pro lies the Structural Analysis Engine, a sophisticated framework designed to detect meaningful shifts in market structure with minimal lag and maximum reliability. Traditional swing-based systems merely connect price highs and lows, often generating false signals during periods of noise or minor retracement. Precision Structure Pro's engine goes deeper, analyzing market momentum, volatility, and price clusters to distinguish between genuine structural breaks and minor fluctuations.
The engine employs a configurable lookback period ranging from 5 to 50 bars, allowing traders to calibrate sensitivity based on their preferred timeframe and trading style. Shorter periods produce more frequent signals suitable for scalping and intraday trading, while longer periods generate fewer but more significant structural markers ideal for swing and position trading. This adaptability ensures the system remains relevant across all trading methodologies.
Break of Structure (BOS) Detection
Break of Structure (BOS) signals are provided whenever price decisively moves beyond a previous swing high or low, highlighting potential continuation setups. The system offers two confirmation methodologies: body-based confirmation, which requires candle closes beyond structural levels for conservative validation, and wick-based confirmation, which triggers on price touches for more aggressive entry opportunities. This dual-option approach allows traders to align the tool's sensitivity with their risk tolerance and market conditions.
Use Case 1: Trend Continuation Trading
A trader identifies a pullback within an established uptrend. The dashboard confirms higher timeframe alignment remains bullish despite the short-term retracement. When price breaks back above the pullback structure, the system generates a BOS signal and activates the trade dashboard with entry, stop-loss, and three profit targets. As targets are hit sequentially, the trader takes partial profits while trailing the remainder, combining systematic risk management with the flexibility to capture extended moves.
Change of Character (CHoCH) Recognition
Change of Character (CHoCH) alerts indicate early reversal opportunities, marking the transition from trending to counter-trend behavior before it becomes evident to the naked eye. CHoCH signals emerge when price breaks a structural level counter to the established trend direction, providing advance warning of potential trend exhaustion or reversal. These signals are particularly valuable for identifying market turning points that precede traditional reversal indicators, offering traders strategic positioning advantages for both exits and counter-trend entries.
By combining BOS and CHoCH signals, traders can identify both continuation and reversal scenarios, enabling them to adapt strategies to shifting market conditions without relying solely on lagging indicators. The engine maintains a persistent memory of structural levels, tracking which pivots remain relevant and which have been invalidated by price action, ensuring that only significant structural events generate signals while noise is systematically filtered.
Use Case 2: Counter-Trend Reversal Trading
During an established trend, price breaks structure in the opposite direction, triggering a CHoCH signal. The candles begin changing color to reflect the structural shift. However, the dashboard shows the higher timeframe remains in the original trend direction, alerting the trader to timeframe conflict. This prompts tighter profit management focused on early targets rather than extended holds, as the setup represents a counter-trend opportunity requiring tactical rather than strategic positioning.
Multi-Timeframe Integration
Multi-timeframe integration within the Structural Analysis Engine provides an additional layer of context that dramatically enhances signal reliability. For instance, a BOS signal on a lower timeframe gains significantly more weight when aligned with the trend observed on a higher timeframe. This hierarchical approach allows traders to confirm signals against broader market trends, reducing exposure to false breakouts and enhancing confidence in entries and exits.
The system continuously monitors a user-selected higher timeframe - configurable to any interval from minutes to weekly charts - and compares its structural trend against current timeframe signals. When lower timeframe BOS or CHoCH events align with higher timeframe directional bias, the system validates these as premium opportunities. The on-chart dashboard displays real-time higher timeframe trend status, showing whether the broader context is bullish, bearish, or neutral, providing traders with instant situational awareness without requiring manual chart switching.
Hierarchical Confirmation and Filtering
Traders can enable higher timeframe alignment requirements, which filters out signals that conflict with the dominant trend on larger timeframes. This filtering mechanism significantly reduces false signals during counter-trend noise while preserving high-probability setups that ride institutional momentum. The result is a trading system that respects market hierarchy, acknowledging that larger timeframe structures exert gravitational influence on smaller timeframe movements, and positioning traders on the right side of dominant flows.
The engine is designed to be highly adaptive, factoring in price volatility and recent momentum to filter out noise while emphasizing meaningful structural changes. The result is a system that not only identifies key market turning points but does so in a way that is sensitive to context, volatility, and timeframe alignment, creating a comprehensive structural narrative that evolves with market conditions.
Volatility-Adaptive Stop-Loss Calculation
Managing risk is as important as identifying opportunities, and Precision Structure Pro addresses this through its Volatility-Adaptive Trade Management system. Unlike static stop-loss levels that fail to account for changing market conditions, this system calculates dynamic stop-loss points based on volatility measurements and market structure. The system employs an analysis window that captures current market movement characteristics and serves as the foundation for all risk calculations.
The system employs a multi-layered calculation methodology. First, it establishes a base distance by applying a user-configurable volatility multiplier (0.5 - 5.0x, default 2.0x) to the measured market volatility. This base distance is then scaled by a stop-loss multiplier (0.1-5.0R, default 1.2R) to determine final stop placement. In high-volatility environments - such as during major news events or market opens - stops are adjusted wider to avoid premature exits from normal price oscillation, while in calm, low-volatility periods, stops tighten to prevent unnecessary exposure and improve capital efficiency.
Tiered Take-Profit System
Take-profit levels are tiered into three distinct targets, each calculated as a ratio of the stop-loss distance. The first target typically sits at 0.8R (80% of the risk distance), providing a conservative profit-taking opportunity that's frequently achieved. The second target extends to 1.6R, capturing intermediate moves while maintaining realistic probability. The third target reaches for 2.8R or beyond, designed to capture extended trend moves and maximize profit potential when momentum continues. These ratios are fully customizable, allowing traders to adapt the system to their profit-taking preferences and market characteristics.
This tiered approach enables traders to lock in profits progressively, reducing psychological pressure while allowing portions of positions to capture larger moves. Traders can take partial profits at early targets and move stops to breakeven to create risk-free positions, while letting remaining size run toward final targets or trailing stops. This partial exit strategy dramatically improves trading psychology by removing the binary pressure of all-or-nothing exits, while maintaining exposure to extended moves that generate outsized returns.
Visual Trade Mapping
Visual representations of dynamic levels are overlaid on the chart with sophisticated rendering techniques. Each level features a multi-layer glow effect - a translucent outer layer for ambient visibility, a semi-transparent middle layer for depth, and a solid core line marking precise price levels. Entry levels appear in bright white, stop-loss zones in vibrant red with danger shading, and take-profit levels in neon green with success-themed styling. Risk and reward zones are represented by translucent boxes that span from entry to stop (risk) and entry to final target (reward), providing immediate visual assessment of trade quality without manual calculation.
Dynamic Status Labels
Labels accompany each level, displaying precise price values and status indicators. Take-profit labels show "PENDING" status until price reaches them, at which point they dynamically update to "HIT" with altered styling to celebrate achievement. Stop-loss labels remain prominent throughout the trade, maintaining awareness of maximum risk. This comprehensive visual mapping ensures traders understand trade structure at a glance, facilitating faster decision-making and reducing cognitive load during active trading sessions.
Intelligent Position Sizing Calculator
Position sizing translates risk percentage into actual trade size. Precision Structure Pro includes a position sizing calculator that performs this computation automatically, eliminating manual calculation errors that can lead to over-leverage or inefficient capital utilization.
The calculator employs a standardized formula that works across all asset classes: Position Size equals Account Size multiplied by Risk Percentage, divided by Stop Distance. This calculation automatically accounts for varying instrument characteristics - whether trading cryptocurrencies with multiple decimal places, forex pairs with pip-based measurements, stocks with dollar-based stops, or futures with point-based movements.
Position Sizing Configuration
Traders configure two key parameters: total account size (their available trading capital) and risk percentage per trade (typically 1-2% for conservative risk management). When a trade signal generates, the system instantly calculates the exact number of units, shares, contracts, or coins to trade based on the automatically-determined stop distance. This calculation appears directly in the on-chart dashboard, displaying both the dollar amount at risk and the precise position size.
This functionality ensures consistent risk across all trades - whether stop distance is narrow or wide, position size adjusts to maintain identical dollar risk. It eliminates execution delays caused by manual calculation and prevents common position sizing errors that plague discretionary traders. The position sizing display can be toggled on or off based on user preference.
On-Chart Dashboard Overview
Information overload impairs decision-making, particularly during fast-moving market conditions. Precision Structure Pro's on-chart dashboard consolidates critical market information into a single, scannable interface that provides situational awareness without requiring navigation between multiple indicators or charts.
The dashboard features a hierarchical information architecture designed for rapid comprehension. At the top, a bold status header announces trade state - LONG ACTIVE or SHORT ACTIVE - with color-coded backgrounds matching trade direction. This visual confirmation prevents confusion about current exposure, particularly when managing multiple positions across different instruments.
Dashboard Components
The higher timeframe status section displays the broader market context, showing whether the selected higher timeframe is BULLISH, BEARISH, or NEUTRAL with corresponding color coding. This provides instant confirmation that current trade direction aligns with dominant market structure, or warns when taking counter-trend positions that require tighter management.
The core metrics section presents trade fundamentals in clean, organized rows: direction confirmation, precise entry price, stop-loss level with distance percentage, and three take-profit targets each showing status (PENDING or HIT), price level, and percentage gain from entry. Visual separators organize these sections, creating clear information boundaries that facilitate quick scanning during time-sensitive decisions.
When position sizing display is enabled, the bottom section shows calculated risk amount in dollars and exact position size in trading units. This eliminates the cognitive step of mental calculation, allowing traders to execute positions immediately with confidence in their risk management.
Dashboard Customization
The dashboard supports four positioning options - top-right, top-left, bottom-right, or bottom-left - allowing traders to anchor it in their preferred location based on personal workflow and chart layout. Importantly, the dashboard only appears when an active trade exists, preventing chart clutter during pure analysis phases when no positions are held. This adaptive visibility ensures the interface remains clean and focused, presenting information only when relevant.
Dynamic Candle Coloring
Technical precision means little if the information isn't immediately digestible. Precision Structure Pro employs sophisticated visualization techniques to transform complex structural data into intuitive visual language that communicates market state at a glance.
The system implements dynamic candle coloring that reflects current structural trend. When market structure is bullish - characterized by BOS signals breaking upward - candles render in cyan tones, creating a visual flow that reinforces upward momentum. When structure turns bearish, candles shift to magenta, immediately communicating downward pressure. During transitional or consolidative periods when structure is unclear, candles display in neutral gray, signaling caution and the absence of clear directional bias. This color-coded system allows traders to interpret market character without analyzing individual price bars, dramatically accelerating pattern recognition.
Structural Level Visualization
Structural break events are marked with multi-layered horizontal lines that employ sophisticated rendering techniques. Each structural level features three layers: a wide, highly transparent outer glow creating ambient visibility, a medium-width semi-transparent middle layer adding dimensional depth, and a solid, precise core line marking the exact price level. This gradient effect makes critical levels stand out prominently even on cluttered charts, while maintaining visual elegance and professional aesthetics.
Professional Label System
Labels accompany each structural event with clean, professional text. BOS events are marked simply as "BOS," while CHoCH events receive distinctive "CHoCH" labeling. These labels are positioned intelligently using volatility-based offsets - appearing above price highs for bearish breaks and below price lows for bullish breaks - ensuring they float in whitespace rather than obscuring candles or overlapping with price action. The system limits the number of simultaneously visible labels (configurable from 1 - 10, default 3) to prevent chart clutter, automatically removing the oldest labels as new signals emerge.
Signal Alerts
Real-time monitoring of multiple charts across various timeframes is impractical for discretionary traders. Precision Structure Pro's alert system helps traders track critical market events, even when away from their trading stations.
The system provides distinct alerts for each signal type. Bullish and bearish Break of Structure alerts fire when upward or downward BOS events occur, with alert messages including current entry price and ticker symbol for context. Bullish and bearish Change of Character alerts notify traders of potential reversals, providing warning to either exit existing positions or prepare counter-trend entries. A generic "New Trade Signal" alert triggers on any valid BOS or CHoCH event, useful for traders monitoring multiple instruments simultaneously.
Trade Management Alerts
Trade management alerts operate independently from signal alerts. Take Profit 1, 2, and 3 alerts fire when price reaches each respective target level, prompting traders to execute their planned partial exit strategy. The Stop Loss Hit alert provides critical notification when trades fail, enabling rapid response to adverse movements and preventing extended drawdowns from unmonitored positions.
The system incorporates intelligent alert tracking to prevent notification spam. Each alert type fires once per event - when a profit target is hit, for example, the system sends a single notification rather than repeatedly alerting as price fluctuates around the level. Alert states reset when new trade signals generate, ensuring fresh monitoring for each position.
Alert Delivery
Alerts route through TradingView's native alert infrastructure, providing multiple delivery options. Traders can receive pop-up notifications during active monitoring, email alerts for remote tracking, mobile push notifications through the TradingView app. This provides flexibility for traders to remain connected to market developments regardless of their physical location or monitoring capabilities.
Design Philosophy
Precision Structure Pro emphasizes clarity, adaptability, and risk-aware execution. Every feature - from structural analysis to dynamic visualizations and customizable alerts - is intended to provide insight, not guarantees. Markets are inherently uncertain, and no indicator can predict future price movements with certainty. Rather than promoting false confidence, the toolkit is designed to enhance situational awareness, improve pattern recognition, and streamline execution of sound trading strategies.
Traders are encouraged to integrate toolkit outputs with personal judgment, broader market context, and sound risk management principles. The system excels at identifying structural patterns and managing trade logistics, but ultimate decision authority rests with the trader. This approach fosters a disciplined, systematic mindset that prioritizes high-probability setups, multi-timeframe confluence, and methodical execution over reactive, emotion-driven trading.
Trading Psychology Benefits
The progressive profit-taking system embedded in the tiered take-profit structure addresses a critical psychological challenge: the tension between capturing large moves and avoiding profit give-backs. By systematically reducing position size at early targets while maintaining exposure to extended moves, traders experience regular positive reinforcement that reduces emotional stress and prevents premature exits. This psychological framework promotes patience and discipline, allowing traders to let winners run without the paralyzing fear of watching profits disappear.
Similarly, the volatility-adaptive stop-loss system prevents two common psychological traps: using stops that are too tight (leading to death by a thousand cuts from repeated small losses) and using stops that are too wide (resulting in catastrophic losses that damage both capital and confidence). By anchoring stop distance to current volatility, the system ensures stops are neither arbitrary nor divorced from market reality, promoting acceptance of losses as normal cost of business rather than personal failures.
Final Notes
Precision Structure Pro provides a layered, multi-dimensional perspective of the market, helping traders interpret price action with confidence, refine strategies, and improve trade quality over time. Its combination of adaptive signals, visual clarity, and comprehensive dashboarding creates a system that is both functional and intuitive, enabling both novice and experienced traders to operate efficiently in complex markets. The system supports trader judgment by providing the structural foundation upon which trading decisions are built.
Practical Use & Context
Precision Structure Pro performs best in markets exhibiting clear structural formation with meaningful momentum shifts at key levels. In highly compressed or low-liquidity environments where price drifts without conviction, structural signals may be sparse or unreliable. During extended consolidation with minimal directional variance, the system may generate fewer actionable signals as formation events fail to meet validation thresholds.
The system identifies structural breaks and generates complete trade setups including entry levels, stop-loss placement, and tiered profit targets. For optimal results, traders may choose to combine these signals with additional confirmation tools or filters based on their individual trading methodology and risk tolerance.
Risk Disclaimer
Precision Structure Pro is designed for educational and informational purposes only. Past performance does not guarantee future results. Trading involves substantial risk of loss and is not suitable for all investors. Traders should employ proper risk management, never risk more than they can afford to lose, and consider all outputs as advisory information requiring independent verification. All trading decisions should be made with full awareness of market uncertainty and personal risk tolerance. No indicator or system can guarantee profitable trades, and users accept full responsibility for their trading outcomes.

SMC N-Gram Probability Matrix [PhenLabs]📊 SMC N-Gram Probability Matrix
Version: PineScript™ v6
📌 Description
The SMC N-Gram Probability Matrix applies computational linguistics methodology to Smart Money Concepts trading. By treating SMC patterns as a discrete “alphabet” and analyzing their sequential relationships through N-gram modeling, this indicator calculates the statistical probability of which pattern will appear next based on historical transitions.
Traditional SMC analysis is reactive—traders identify patterns after they form and then anticipate the next move. This indicator inverts that approach by building a transition probability matrix from up to 5,000 bars of pattern history, enabling traders to see which SMC formations most frequently follow their current market sequence.
The indicator detects and classifies 11 distinct SMC patterns including Fair Value Gaps, Order Blocks, Liquidity Sweeps, Break of Structure, and Change of Character in both bullish and bearish variants, then tracks how these patterns transition from one to another over time.
🚀 Points of Innovation
First indicator to apply N-gram sequence modeling from computational linguistics to SMC pattern analysis
Dynamic transition matrix rebuilds every 50 bars for adaptive probability calculations
Supports bigram (2), trigram (3), and quadgram (4) sequence lengths for varying analysis depth
Priority-based pattern classification ensures higher-significance patterns (CHoCH, BOS) take precedence
Configurable minimum occurrence threshold filters out statistically insignificant predictions
Real-time probability visualization with graphical confidence bars
🔧 Core Components
Pattern Alphabet System: 11 discrete SMC patterns encoded as integers for efficient matrix indexing and transition tracking
Swing Point Detection: Uses ta.pivothigh/pivotlow with configurable sensitivity for non-repainting structure identification
Transition Count Matrix: Flattened array storing occurrence counts for all possible pattern sequence transitions
Context Encoder: Converts N-gram pattern sequences into unique integer IDs for matrix lookup
Probability Calculator: Transforms raw transition counts into percentage probabilities for each possible next pattern
🔥 Key Features
Multi-Pattern SMC Detection: Simultaneously identifies FVGs, Order Blocks, Liquidity Sweeps, BOS, and CHoCH formations
Adjustable N-Gram Length: Choose between 2-4 pattern sequences to balance specificity against sample size
Flexible Lookback Range: Analyze anywhere from 100 to 5,000 historical bars for matrix construction
Pattern Toggle Controls: Enable or disable individual SMC pattern types to customize analysis focus
Probability Threshold Filtering: Set minimum occurrence requirements to ensure prediction reliability
Alert Integration: Built-in alert conditions trigger when high-probability predictions emerge
🎨 Visualization
Probability Table: Displays current pattern, recent sequence, sample count, and top N predicted patterns with percentage probabilities
Graphical Probability Bars: Visual bar representation (█░) showing relative probability strength at a glance
Chart Pattern Markers: Color-coded labels placed directly on price bars identifying detected SMC formations
Pattern Short Codes: Compact notation (F+, F-, O+, O-, L↑, L↓, B+, B-, C+, C-) for quick pattern identification
Customizable Table Position: Place probability display in any corner of your chart
📖 Usage Guidelines
N-Gram Configuration
N-Gram Length: Default 2, Range 2-4. Lower values provide more samples but less specificity. Higher values capture complex sequences but require more historical data.
Matrix Lookback Bars: Default 500, Range 100-5000. More bars increase statistical significance but may include outdated market behavior.
Min Occurrences for Prediction: Default 2, Range 1-10. Higher values filter noise but may reduce prediction availability.
SMC Detection Settings
Swing Detection Length: Default 5, Range 2-20. Controls pivot sensitivity for structure analysis.
FVG Minimum Size: Default 0.1%, Range 0.01-2.0%. Filters insignificant gaps.
Order Block Lookback: Default 10, Range 3-30. Bars to search for OB formations.
Liquidity Sweep Threshold: Default 0.3%, Range 0.05-1.0%. Minimum wick extension beyond swing points.
Display Settings
Show Probability Table: Toggle the probability matrix display on/off.
Show Top N Probabilities: Default 5, Range 3-10. Number of predicted patterns to display.
Show SMC Markers: Toggle on-chart pattern labels.
✅ Best Use Cases
Anticipating continuation or reversal patterns after liquidity sweeps
Identifying high-probability BOS/CHoCH sequences for trend trading
Filtering FVG and Order Block signals based on historical follow-through rates
Building confluence by comparing predicted patterns with other technical analysis
Studying how SMC patterns typically sequence on specific instruments or timeframes
⚠️ Limitations
Predictions are based solely on historical pattern frequency and do not account for fundamental factors
Low sample counts produce unreliable probabilities—always check the Samples display
Market regime changes can invalidate historical transition patterns
The indicator requires sufficient historical data to build meaningful probability matrices
Pattern detection uses standardized parameters that may not capture all institutional activity
💡 What Makes This Unique
Linguistic Modeling Applied to Markets: Treats SMC patterns like words in a language, analyzing how they “flow” together
Quantified Pattern Relationships: Transforms subjective SMC analysis into objective probability percentages
Adaptive Learning: Matrix rebuilds periodically to incorporate recent pattern behavior
Comprehensive SMC Coverage: Tracks all major Smart Money Concepts in a unified probability framework
🔬 How It Works
1. Pattern Detection Phase
Each bar is analyzed for SMC formations using configurable detection parameters
A priority hierarchy assigns the most significant pattern when multiple detections occur
2. Sequence Encoding Phase
Detected patterns are stored in a rolling history buffer of recent classifications
The current N-gram context is encoded into a unique integer identifier
3. Matrix Construction Phase
Historical pattern sequences are iterated to count transition occurrences
Each context-to-next-pattern transition increments the appropriate matrix cell
4. Probability Calculation Phase
Current context ID retrieves corresponding transition counts from the matrix
Raw counts are converted to percentages based on total context occurrences
5. Visualization Phase
Probabilities are sorted and the top N predictions are displayed in the table
Chart markers identify the current detected pattern for visual reference
💡 Note:
This indicator performs best when used as a confluence tool alongside traditional SMC analysis. The probability predictions highlight statistically common pattern sequences but should not be used as standalone trading signals. Always verify predictions against price action context, higher timeframe structure, and your overall trading plan. Monitor the sample count to ensure predictions are based on adequate historical data.

Market Structure ICT Screener [TradingFinder] BoS ChoCh🔵 Introduction
Market Structure is the foundation of every Smart Money and ICT based trading model. It describes how price moves through a sequence of highs and lows, forming clear phases of expansion, retracement and reversal. Understanding this structure allows traders to read institutional order flow and align their positions with the true direction of liquidity.
Two of the most critical components in Market Structure are the Break of Structure (BOS) and Change of Character (CHOCH). A BOS represents trend continuation, confirming strength within the current direction. In contrast, CHOCH also known as a Market Structure Shift (MSS) signals the first sign of a trend reversal or liquidity shift where order flow begins to change from bullish to bearish or vice versa.
Because the market is fractal, structure can exist at multiple levels known as Major (External) and Minor (Internal). Major structure defines the overall trend on higher timeframes while minor or internal structure reveals short term swings and early reversals within that larger move.
🔵 How to Use
Understanding Market Structure starts with identifying how price interacts with previous swing highs and swing lows. Every trend in the market, whether bullish or bearish, is built from a sequence of impulsive and corrective moves. Impulsive legs show strong displacement in the direction of liquidity flow, while corrective legs represent temporary pullbacks as the market rebalances before the next expansion. Recognizing these sequences is essential for reading the story of price and anticipating what may happen next.
A Break of Structure (BOS) occurs when price decisively moves beyond a previous structural point by breaking above the last high in an uptrend or falling below the last low in a downtrend. This event confirms that the current trend remains intact and that liquidity has been successfully taken from one side of the market. A BOS acts as confirmation of continuation and reflects strength within the existing directional bias.
A Change of Character (CHOCH) appears when price violates structure in the opposite direction of the prevailing trend. This is the first signal that market sentiment and order flow may be shifting. For example, during a downtrend if price breaks above a previous high, it indicates that sellers are losing control and a potential bullish reversal may be developing. In an uptrend, when price drops below a recent low, it suggests a possible bearish transition.
Because the market is fractal, structure exists across multiple layers. Major structure reflects the dominant movement visible on higher timeframes and defines the broader directional bias. Minor or internal structure represents smaller swings within that move and helps identify early transitions before they appear on the higher timeframe. When internal and external structures align, they offer a high probability signal for trend continuation or reversal.
By observing BOS and CHOCH across both internal and external structures, traders can clearly visualize when the market is expanding, contracting or preparing to shift direction. This structured understanding of price movement forms the foundation for precise trend analysis and high quality decision making in any Smart Money or ICT based trading approach.
🔵 Settings
🟣 Display Settings
Table on Chart : Allows users to choose the position of the signal dashboard either directly on the chart or below it, depending on their layout preference.
Number of Symbols : Enables users to control how many symbols are displayed in the screener table, from 10 to 20, adjustable in increments of 2 symbols for flexible screening depth.
Table Mode : This setting offers two layout styles for the signal table :
Basic : Mode displays symbols in a single column, using more vertical space.
Extended : Mode arranges symbols in pairs side-by-side, optimizing screen space with a more compact view.
Table Size : Lets you adjust the table’s visual size with options such as: auto, tiny, small, normal, large, huge.
Table Position : Sets the screen location of the table. Choose from 9 possible positions, combining vertical (top, middle, bottom) and horizontal (left, center, right) alignments.
🟣 Symbol Settings
Each of the 20 symbol slots comes with a full set of customizable parameters :
Symbol : Define or select the asset (e.g., XAUUSD, BTCUSD, EURUSD, etc.).
Timeframe : Set your desired timeframe for each symbol (e.g., 15, 60, 240, 1D).
Pivot Period : Set the length used to detect swing highs and lows. Shorter values increase sensitivity, longer ones focus on major structures.
🔵 Conclusion
Mastering Market Structure and understanding the relationship between BOS and CHOCH allows traders to see the market with greater clarity and confidence. These two elements reveal how liquidity moves through different phases of expansion and retracement and how institutional order flow shifts between accumulation and distribution.
By analyzing both internal and external structures, traders can align short term and long term perspectives and anticipate where price is most likely to react. The ability to read these structural shifts helps identify continuation points, reversals and areas where liquidity is engineered or collected.
Incorporating Market Structure into a consistent trading process transforms the way a trader views the chart. Instead of reacting to random movements, each swing, break and shift becomes part of a logical framework that reflects the true behavior of the market. Understanding BOS and CHOCH is not just a concept but a complete language of price that guides every professional decision in Smart Money and ICT based trading.

Advanced Market Structure [OmegaTools]📌 Market Structure
Advanced Market Structure is a next–generation indicator designed to decode price structure in real time by combining classical swing–based analysis with modern quantitative confirmation techniques. Built for traders who demand both precision and adaptability, it provides a robust multi–layered framework to identify structural shifts, trend continuations, and potential reversals across any asset class or timeframe.
Unlike traditional structure indicators that rely solely on visual swing identification, Market Structure introduces an integrated methodology: pivot detection, Donchian trend modeling, statistical confirmation via Z–Score, and volume–based validation. Each element contributes to a comprehensive, systematic representation of the underlying market dynamics.
🔑 Core Features
1. Five Distinct Market Structure Modes
Standard Mode:
Captures structural breaks through classical swing high/low pivots. Ideal for discretionary traders looking for clarity in directional bias.
Confirmed Breakout Mode:
Requires validation beyond the initial pivot break, filtering out noise and reducing false positives.
Donchian Trend HL (High/Low):
Establishes structure based on absolute highs and lows over rolling lookback windows. This approach highlights broader momentum shifts and trend–defining extremes.
Donchian Trend CC (Close/Close):
Similar to HL mode, but calculated using closing prices, enabling more precise bias identification where close–to–close structure carries stronger statistical weight.
Average Mode:
A composite methodology that synthesizes the four models into a weighted signal, producing a balanced structural bias designed to minimize model–specific weaknesses.
2. Dynamic Pivot Recognition with Auto–Updating Levels
Swing highs and lows are automatically detected and plotted with adaptive horizontal levels. These dynamic support/resistance markers continuously extend into the future, ensuring that historically significant levels remain visible and actionable.
3. Color–Adaptive Candlesticks
Price bars are dynamically recolored to reflect the prevailing structural regime: bullish (default blue), bearish (default red), or neutral (gray). This enables instant visual recognition of regime changes without requiring external confirmation.
4. Statistical Reversal Triggers
The script integrates a 21–period Z–Score calculation applied to closing prices, combined with multi–layered volume confirmation (SMA and EMA convergence).
Bullish trigger: Z–Score < –2 with structural confirmation and volume support.
Bearish trigger: Z–Score > +2 with structural confirmation and volume support.
Signals are plotted as diamond markers above or below the bars, identifying potential high–probability reversal setups in real time.
5. Integrated Alpha Backtesting Engine
Each market structure mode is evaluated through a built–in backtesting routine, tracking hit ratios and consistency across the most recent ~2000 structural events.
Performance metrics (“Alpha”) are displayed directly on–chart via a dedicated Performance Dashboard Table, allowing side–by–side comparison of Standard, Confirmed Breakout, Donchian HL, Donchian CC, and Average models.
Traders can instantly evaluate which structural methodology best adapts to the current market conditions.
🎯 Practical Advantages
Systematic Clarity: Eliminates subjectivity in defining structural bias, offering a rules–based framework.
Statistical Transparency: Built–in performance metrics validate each mode in real time, allowing informed decision–making.
Noise Reduction: Confirmed Breakouts and Donchian modes filter out common traps in structural trading.
Multi–Asset Adaptability: Optimized for scalping, intraday, swing, and multi–day strategies across FX, equities, futures, commodities, and crypto.
Complementary Usage: Works as a stand–alone structure identifier or as a quantitative filter in larger algorithmic/trading frameworks.
⚙️ Ideal Users
Discretionary traders seeking an objective reference for structural bias.
Quantitative/systematic traders requiring on–chart statistical validation of structural regimes.
Technical analysts leveraging pivots, Donchian channels, and price action as part of broader frameworks.
Portfolio traders integrating structure into multi–factor models.
💡 Why This Tool?
Market Structure is not a static indicator — it is an adaptive framework. By merging classical pivot theory with Donchian–style momentum analysis, and reinforcing both with statistical backtesting and volume confirmation, it provides traders with a unique ability:
To see the structure,
To measure its reliability,
And to act with confidence on quantifiably validated signals.

DTFX Algo Zones [LuxAlgo]DTFX Algo Zones are auto-generated Fibonacci Retracements based on market structure shifts.
These retracement levels are intended to be used as support and resistance levels to look for price to bounce off of to confirm direction.
🔶 USAGE
Due to the retracement levels only being generated from identified market structure shifts, the retracements are confined to only draw from areas considered more important due to the technical Break of Structure (BOS) or Change of Character (CHoCH).
The simple action that causes a market structure shift occurs is price breaking above or below a specific swing point. When a market structure shift happens, a retracement is drawn from the point of break to the highest or lowest point since that point. Due to the price action necessary for a market structure shift, these retracements will not always be immediately actionable.
These retracement levels are intended to be used as points to watch for price to retrace to and bounce from, confirming the current direction of price.
In the example below, after the retracement is initiated, by bouncing off of the retracement levels formed from the previous market structure shift it would further confirm the bias of the market structure shift. A break going through these levels would display a weakness from the current market structure shift, implying that it could simply be noise.
🔶 DETAILS
The script uses standard SMC Market structure identification to determine Break of Structures (BOS) and Change of Characters (CHoCH). The specific swing points can be identified by the shapes placed above or below the specific swing high/low candle.
By unchecking the "Display All Zones" setting, users are able to specify the exact number of retracement zones to display using the "Show Last" parameter. This is handy for cleaning up the chart to stay focused on the most recent retracements.
Additionally, when displaying multiple zones, the "Clean-Up Level Overlap" setting may be helpful for decluttering as well. This option optimizes the display of retracement levels to minimize their overlap on other adjacent zones.
The script allows for up to 5 Fib levels to be displayed from each zone, with options for display, value, line style, and color for each of the 5.
The calculation for Fib Levels changes depending on the direction of market structure shifts. When an upwards (Bullish) zone is generated, the retracement is drawn with the bottom of the zone being 0 and the top of the zone being 1. This is reversed for downwards (Bearish) zones.
🔶 SETTINGS
Structure Length: Sets the SMC structure length to use for finding MMS.
Show Last: Displays this number of retracement zones. (Display All Zones Must be Unchecked)
Display All Zones: Ignores "Show Last" number and displays all historical MMS Retracement Zones.
Zone Display: Choose which zones to display, only bearish, only bullish, or both.
Clean-Up Level Overlap: Minimizes overlap between adjacent zones and levels.
Fib Levels: Settings to display and customize up to 5 Fib levels for each zone.

Market Structures + ZigZag [TradingFinder] CHoCH/BOS - MSS/MSB🟣 Introduction
🔵 Market Structure
Grasping market structure entails examining market behavior. Essentially, market structure refers to the formation and progression of the market within its trends.
Market structures are generally fractal and nested, leading us to classify them into internal (minor) and external (major) structures. There are several definitions of market structure, with differing perspectives such as Smart Money and ICT offering their own interpretations.
🔵 Zig Zag
The Zigzag indicator is a lagging tool that identifies points on a price chart where significant changes occur compared to the previous wave. By connecting these points, it helps traders detect trends.
This indicator minimizes random price fluctuations, aiming to clarify the primary price trend.
Pivots are points on a price chart where the direction changes. Also known as reversal points, pivots form when supply and demand forces overpower one another.
There are various types of technical analysis pivots, which can be divided into two categories: minor pivots and major pivots, each with distinct significance in analysis.
Major Pivot : These pivots signify substantial changes in the chart's direction and occur at the end of trends. Analysts focusing on primary analysis prioritize major pivot points. In fact, most technical analysis tools are evaluated and based on major pivots.
Minor Pivot : These pivots highlight smaller, subsidiary points and directions, appearing at the end of corrections. Analysts who focus on minor pivots represent small trends. It's important to note that minor pivots are not suitable for use in primary technical tools.
Identifying Minor and Major Pivots :
Minor pivots are formed between two major pivots and do not break the opposing major pivot. (Internal Pivot)
Major pivots are those that either successfully break the opposing pivot or move beyond the previous pivot of the same type. (External Pivot)
🟣 How to Use
🔵 Identifying Break of Structure (BOS)
In a given trend, such as a downtrend, a Break of Structure occurs when the price drops below the previous low and forms a new low (LL). In an uptrend, a BOS (MSB) happens when the price rises and exceeds the last high.
To confirm a trend, at least one BOS is required. The break above or below the previous high or low must be validated by the closing of at least one candle beyond that level.
🔵 Identifying Change of Character (CHOCH)
Change of Character (CHOCH) is an essential concept in market structure analysis, indicating a trend change. In other words, a trend concludes with a CHOCH (MSS). For example, in a downtrend, the price declines with BOS.
While BOS highlights the trend's strength, a CHOCH occurs when the price rises and surpasses the last high, signaling a transition from a downtrend to an uptrend.
This does not imply immediately entering a buy trade; instead, it is prudent to wait for a BOS in the upward direction to confirm the uptrend.
Unlike BOS, confirming a CHOCH does not require a candle to close; simply breaking above or below the previous high or low with the candle's wick is sufficient. The following examples illustrate bearish and bullish CHOCH.
Terms :
Market Structure Shift = MSS
Market Structure Break = MSB
🔵 Zig Zag
Based on identifying pivots and drawing zigzag lines, you can have different uses of this indicator.
Including :
Identifying pivot types along with major and minor recognition.
Identifying internal and external breakouts.
Identifying support and resistance levels.
Identifying Elliott Waves.
Identifying classic patterns.
Identifying pivots with higher validity.
Identifying trends and range areas.
🟣 Settings
Pivot Period Market Structure and ZigZag Line: Using this input, you can determine the pivot period for identifying swings.
Through the settings, you can customize the display, visibility, and color of each line as desired.

Market Structures SMC [TradingFinder] BOS/CHoCH Major & Minor🟣Introduction
Understanding market structure involves analyzing market behavior. In other words, market structure encompasses how the market forms and evolves within trends.
Market structures are typically fractal and nested, so we categorize them into internal (minor) and external (major) structures. There are various definitions of market structure, with different approaches such as Smart Money and ICT providing their own interpretations.
🟣How to Use
The first step in identifying market structure is to analyze key highs and lows. An uptrend is formed when highs and lows are successively higher than previous ones. Similarly, in a downtrend, lows and highs are successively lower than previous ones.
Market trends consist of two types of movements :
•Impulsive movements
•Corrective movements
Impulsive movements align with the main trend and possess high strength and momentum. Conversely, corrective movements go against the main trend and have lower strength and momentum. The following example illustrates these concepts.
🔵 Identifying Break of Structure (BOS)
In a specific trend, for example in a downtrend, when the price breaks below the previous low and forms a new low (LL), a Break of Structure occurs. In an uptrend, a BOS (Market Structure Break or MSB) happens when the price rises and surpasses the last high.
We need at least one BOS to confirm a trend. Breaking above or below the previous high or low must be confirmed by closing at least one candle after that level.
🔵 Identifying Change of Character (CHOCH)
Change of Character (CHOCH) is a key concept in market structure analysis. A change in structure signals a trend change. In other words, a trend ends with a CHOCH (Market Structure Shift or MSS). For instance, in a downtrend, the price declines with BOS.
BOS indicates the strength of the trend, but when the price increases and surpasses the last high, a CHOCH occurs, signaling a shift from a downtrend to an uptrend.
This does not mean entering a buy trade; instead, we should wait for a BOS in the upward direction to confirm the uptrend. Unlike BOS, confirming a CHOCH does not require a candle to close; simply breaking above or below the previous high or low with the candle's wick is sufficient. The following examples show bearish and bullish CHOCH.
🔵 Range Market Structure
Besides uptrends and downtrends, a third structure often found in the market is the range or sideways structure. In this state, the power of buyers and sellers is almost equal, and the market lacks a clear trend.
Many traders believe that the Forex market ranges 80% of the time. Therefore, it requires a lot of patience to wait for a new trend to start.
🟣 Settings
Through the settings, you can customize the display, visibility, and color of each line as desired.

Market Structure (Intrabar) [LuxAlgo]The Market Structure (Intrabar) indicator is designed to automatically detect and highlight real-time intrabar market structures, a core component of the Smart Money Concepts methodology.
🔶 USAGE
The proposed indicator gives a detailed picture of the most recent candle lower timeframe trends, highlighting market structures within them.
This can be particularly useful to assess the price dynamic within the most recent candle. For example, we can see how pronounced a trend is by the number of opposite bullish/bearish market structures formed within the candle.
Users can select the intrabar timeframe of interest from the "Intrabar Timeframe" setting, using a timeframe significantly lower than the chart timeframe will return more intrabar candles and potentially more market structures.
🔹 Dashboard
Users have access to a dashboard returning useful statistics such as the number of formed CHoCH's and BOS's from the intrabar prices. These can be indicative of how predominant a trend is within the intrabar data or if there exist multiple trends.
🔶 DETAILS
Market structures allow determining trend continuations as well as trend reversals in the market through two distinct structures:
🔹 Change of Character (CHoCH)
A change of character (CHoCH) refers to a shift in the market behavior of a security that is driven by changes in the underlying supply and demand dynamics. CHoCH's are indicative of confirmed reversals.
🔹 Break of Structure (BoS)
The break of structure (BoS) refers to the point at which a key level of support or resistance is broken. BOS's are indicative of confirmed trend continuations.
🔶 SETTINGS
🔹Inside the Bar Market Structure
Intrabar Timeframe: Lower timeframe setting option, if set to 'Auto' the script will determine the lower timeframe based on the chart timeframe.
Intrabar Market Structure, Length: Toggles the visibility of the break of structures and change of characters. Length defines the detection length of the swing levels.
Intrabar Swing Levels: Toggles the visibility of the swing levels, including a color customization option for highs and lows.
Intrabar Statistics: Toggles the visibility of the dashboard. Some further statistical details are presented in the tooltips of the table cells
🔹 General
Market Structure Colors: Color customization option for the break of structure and change of character lines and labels.
Intrabar Candle Colors: Color customization option for intrabar candles.
Intrabar Candles Horizontal Offset: Adjusting the intrabar candles horizontal position
Dashboard: Dashboard position and size customization option
🔶 LIMITATIONS
Please note that seconds-based intervals are available for premium and professional plan holders, which implies that the seconds-based intervals usage of the indicator may not be available for all users depending on their subscription plan.
🔶 RELATED SCRIPTS
Smart-Money-Concepts
ICT-Concepts

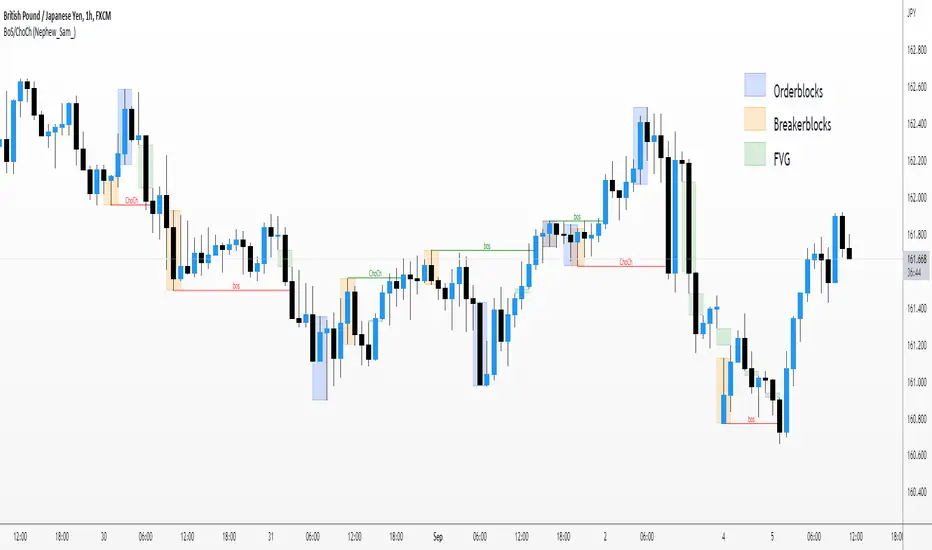
Market Structure BOS/CHOCH/MSB/FVG/OB/BB (Nephew_Sam_)This market structure indictor uses pivot points to find break of structure and change of character.
You can enable the options to find Fair Value Gaps, Breaker Blocks and Orderblocks too. The way this works is, once a bos/choch is found, it will loop back and find all fvg/ob/bb from that point until the previous pivot point.
Settings
Pivot strength - How many candles to the left/right requried to determine a swing high
Breakout Confitmation - The breakout candle should close under the previous pivot or the wick H/L should be under
Show xyz - show HH/LL, Break of structure and change of character
FVG/OB/BB - Show, bull/bear colors, extend boxes to the right, delete boxes once filled, fill type close or H/L
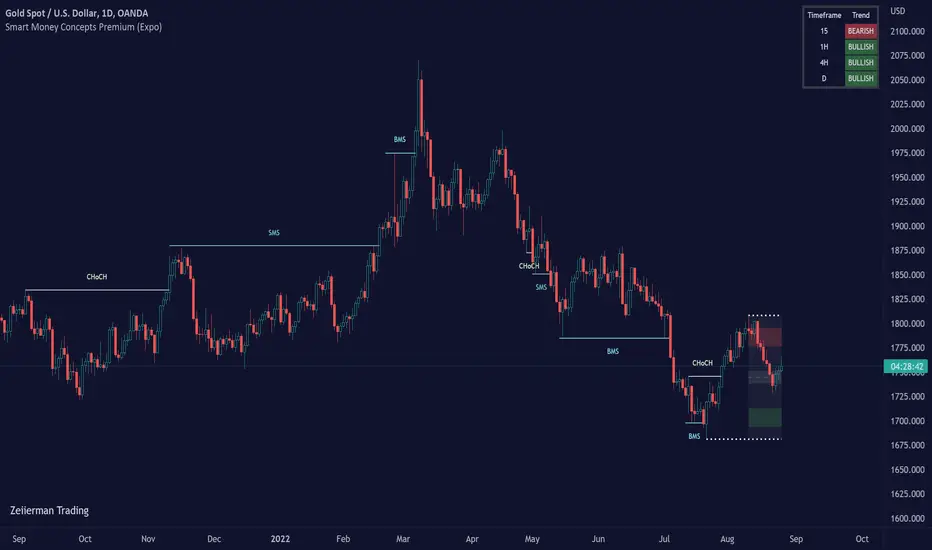
Smart Money Concepts Premium (Expo)Are you a professional Smart Money Concept Trader?
█ This premium version of our SMC indicator includes all advanced Smart Money Concept Trading techniques. The indicator includes all the important concepts such as Market Structure, Change of Character, Current Trading Range, Premium & Discount , Fractals, and Swing Structure. The indicator includes the popular SMC Market Structure Trend to help traders analyze the trend.
In addition to these features, this version adds the following:
Multitimeframe option
Predicted Structure and Range
Backtesting option
External Range Liquidity
Internal Range Liquidity
Liquidity Grab
Fair Value Gap (FVG)
True Fair Value Gap
Imbalance
Order block
Orderflow
Supply & Demand
Equal Highs and Equal Lows
Point of Interest
An alert function that allows you to set any combination of alerts.
This indicator aims to be an all-in-one SMC indicator that helps Smart Money Traders automate their analyzes.
█ HOW TO USE
Use the indicator to trade advanced SMC Trading techniques.
█ Settings
The indicator is fully customized and can be adjusted to fit Swing Trading, Trend Trading, Day Trading, or Scalping.
The indicator works in any market and timeframe.
-----------------
Disclaimer
Copyright by Zeiierman.
The information contained in my Scripts/Indicators/Ideas/Algos/Systems does not constitute financial advice or a solicitation to buy or sell any securities of any type. I will not accept liability for any loss or damage, including without limitation any loss of profit, which may arise directly or indirectly from the use of or reliance on such information.
All investments involve risk, and the past performance of a security, industry, sector, market, financial product, trading strategy, backtest, or individual's trading does not guarantee future results or returns. Investors are fully responsible for any investment decisions they make. Such decisions should be based solely on an evaluation of their financial circumstances, investment objectives, risk tolerance, and liquidity needs.
My Scripts/Indicators/Ideas/Algos/Systems are only for educational purposes!
Ücretli komut dosyası
Smart Money Concept (Expo)Are you Trading SMC? - Are you willing to learn how to apply SMC techniques? - Great, this indicator is for you!
█ This Smart Money Concept ( SMC ) indicator is a sophisticated and highly innovative indicator that combines all the necessary features to trade SMC trading techniques. It is built off of Smart Money Concepts inspired by inner trader circle (ICT) teachings. Smart Money is considered the capital allocated by institutional investors, funds, and other larger financial market participants. This indicator takes the Institutional trading behavior and makes it accessible to retail investors. By using an SMC indicator, you get professional insights into the market.
█ This indicator provides you with all of the most important SMC principles in one indicator. Fully automated and real-time Break of Market Structure, Change of Character, Current Trading Range, Premium & Discount , Fractals, and Swing Structure. In addition to the most important features, we have added a highly unique SMC Market Structure Trend based on the market structure principle. A confirmed swing structure trend background enhances the trend feature even more.
Swing Structure
Identifying major market structures with the indicator.
Current Trading Range
The Range feature ensures that traders always know where the current range is and where to find Premium and Discount within that range. In addition, the range is updated in real-time without any delay.
Premium & Discount Zones
Identifying Premium and Discounts zones automatically for you.
Structure break
Break of Market Structure ( BMS ) and Change of Character ( CHoCH ) - are automatically identified and plotted in real-time.
Supply and Demand
Use our Supply/Demand indicator to identify high probabilities trading zones.
█ HOW TO USE
Use the indicator to trade SMC Trading techniques.
Use the indicator to understand the current market structure.
Use the indicator to identify the current range and premium and discount levels.
█ Settings
The Market structure period is fully customized and can be adjusted to fit Swing Trading, Trend Trading, Day Trading, or Scalping.
The indicator works in any market and timeframe.
█ Basic Terminology
S&D - Supply & Demand
S2D - Supply to Demand
D2S - Demand to Supply
OB - Orderblock
AOI - Area of Interest
POI - Point of Interest
LOR - Level of Respect
FLOR - First Level of Respect
IMB - Imbalance
INF - Inefficiency
FVG - Fair Value Gap
IRL - Internal Range Liquidity
ERL - External Range Liquidity
HH - Higher High
HL - Higher Low
LL - Lower Low
LH - Lower High
BOS - Break of Structure
BMS - Break of Market Structure
mBOS - Minor Break of Structure
SMS - Shift in Market Structure
CHoCH - Change of Character
mCHoCH - minor Change of Character
EQH - Equal Highs
EQL - Equal Lows
BSL - Buy Side Liquidity
SSL - Sell Side Liquidity
LQ - Liquidity
EQ - Equilibrium
PA - Price Action
MTF - Multi Timeframe
HTF - Higher Timeframe
LTF - Lower Timeframe
PT - Protrend
CT - Counter trend
OF - Orderflow
EOF - Expectational Orderflow
LOD - Low of the Day
HOD - High of the Day
HOW - High of the Week
LOW - Low of the week
RE - Risk Entry
CE - Confirmation Entry
DCE - Double Confirmation Entry
SL - Stop loss
RR - Risk Reward
BFI - Banks & Financial Institutions
Hedgies - Hedge Funds
-----------------
Disclaimer
Copyright by Zeiierman.
The information contained in my Scripts/Indicators/Ideas/Algos/Systems does not constitute financial advice or a solicitation to buy or sell any securities of any type. I will not accept liability for any loss or damage, including without limitation any loss of profit, which may arise directly or indirectly from the use of or reliance on such information.
All investments involve risk, and the past performance of a security, industry, sector, market, financial product, trading strategy, backtest, or individual's trading does not guarantee future results or returns. Investors are fully responsible for any investment decisions they make. Such decisions should be based solely on an evaluation of their financial circumstances, investment objectives, risk tolerance, and liquidity needs.
My Scripts/Indicators/Ideas/Algos/Systems are only for educational purposes!

Gann Swing Chart [One-Bar]"Gann used three types of swings chart.
One-Bar Swing Chart (1-Bar Swing Chart): The One-Bar Swing Chart, or Minor Trend Chart, follows the one-bar movements of the market. From a low price, each time the market makes a higher-high than the previous bar, a One-Bar trend line moves up from the recent low to the new high. This action makes the previous low price a One-Bar bottom. From a high price each time the market makes a lower-low than the previous bar, a One-Bar swing line moves down from the recent high to the new low. This action makes the previous high price a One-Bar top.
The combination of One-Bar tops and bottoms forms the One-Bar trend indicator chart. The crossing of a One-Bar swing top changes the One-Bar trend to up. The penetration of a One-Bar swing bottom changes the One-Bar trend to down."
This Indicator only show Gann Swing Chart use One-Bar type.

CHOCH - MSB for Supply and DemandChange of Character (CHOCH) - Market Structure Break (MSB) for Supply & Demand
Description
The script is designed as a confirmation entry tool to be used with supply and demand zones (predefined proximal and distal levels).
When price hits a predefined level it will monitor price action using fractals and an algorithm to determine a potential reversal in trend or change of trend direction.
Once this has been identified you will be alerted in order to anticipate a retracement entry. A good understanding of supply and demand concepts, odds enhancers, and how to identify fresh levels is expected to utilise it's full potential.
Indicator in use
How To Use
Apply one indicator on a higher timeframe, and another on a lower timeframe. In settings, select long for a demand zone and short for a supply zone. Use the higher timeframe to plot major supply and demand zones and a lower timeframe of your choice for the alert. You can refine your levels by manually entering the price levels in settings. The alert is set on the timeframe you set it on.
Manual Selection
Check "override custom levels" and manually enter the price levels of your proximal and distal lines. Input the time and date of your pivot point (candle). Manual selection is recommended as you can refine your zones.
Automatic Selection
Drag and drop the pivot on the candle of choice . The pivot point will mark the zone using the candle's high and low (default setting). Source for top and bottom levels can be changed in settings.
Start Control after X Bar
This defines how many bars is required (from your pivot point) before it sets to anticipate a breach.
